 8
8peptides
spectra
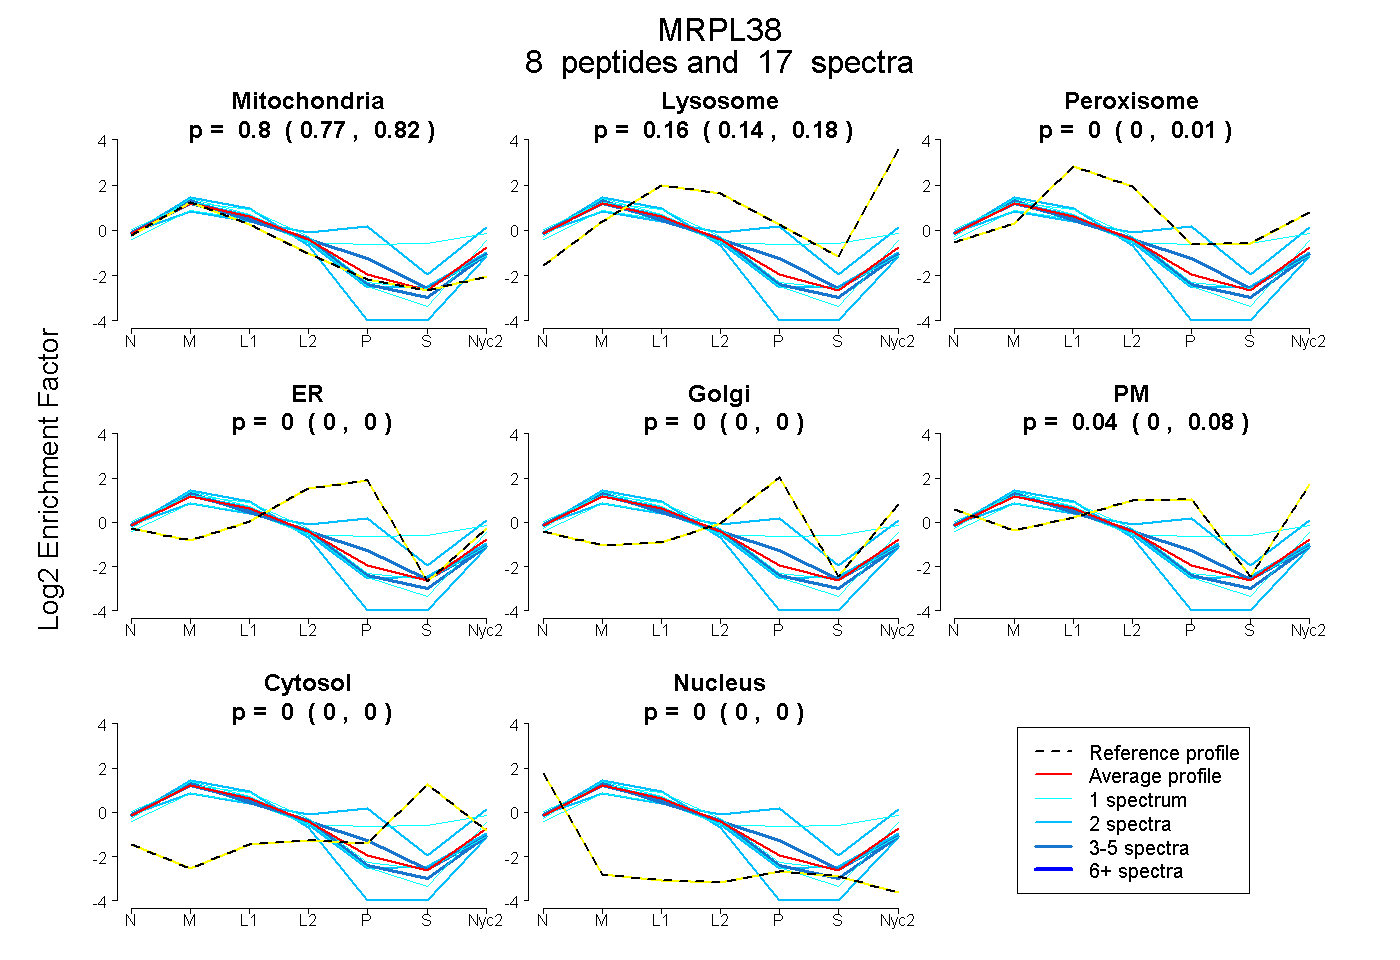
0.769 | 0.816
0.140 | 0.183
0.000 | 0.008
0.000 | 0.000
0.000 | 0.000
0.000 | 0.078
0.000 | 0.000
0.000 | 0.000
4peptides
spectra
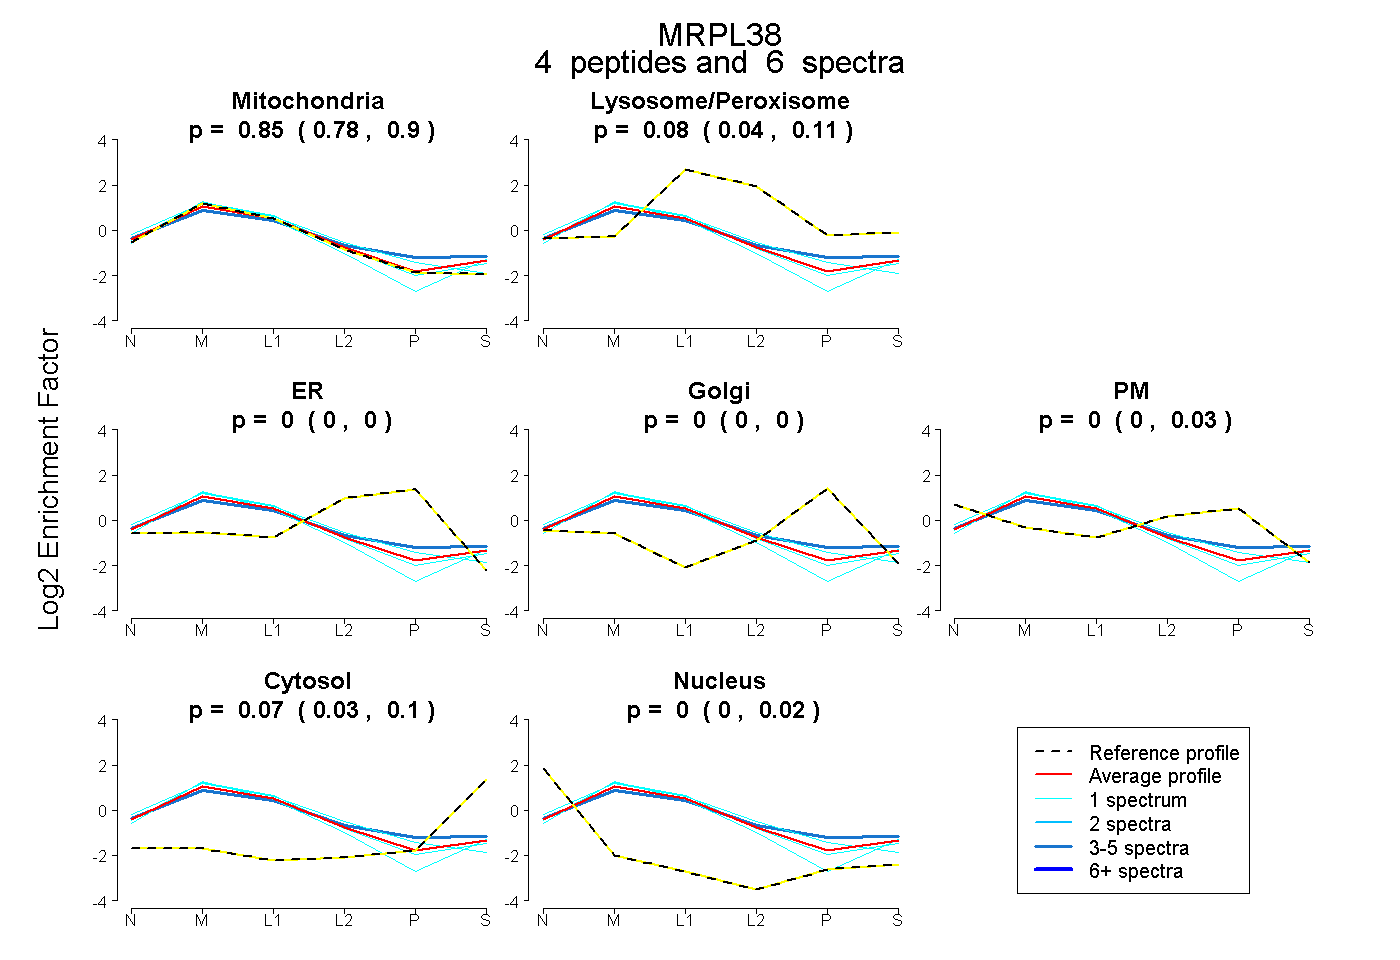
0.781 | 0.902
0.040 | 0.107
0.000 | 0.000
0.000 | 0.000
0.000 | 0.033
0.026 | 0.102
0.000 | 0.019
9peptides
spectra
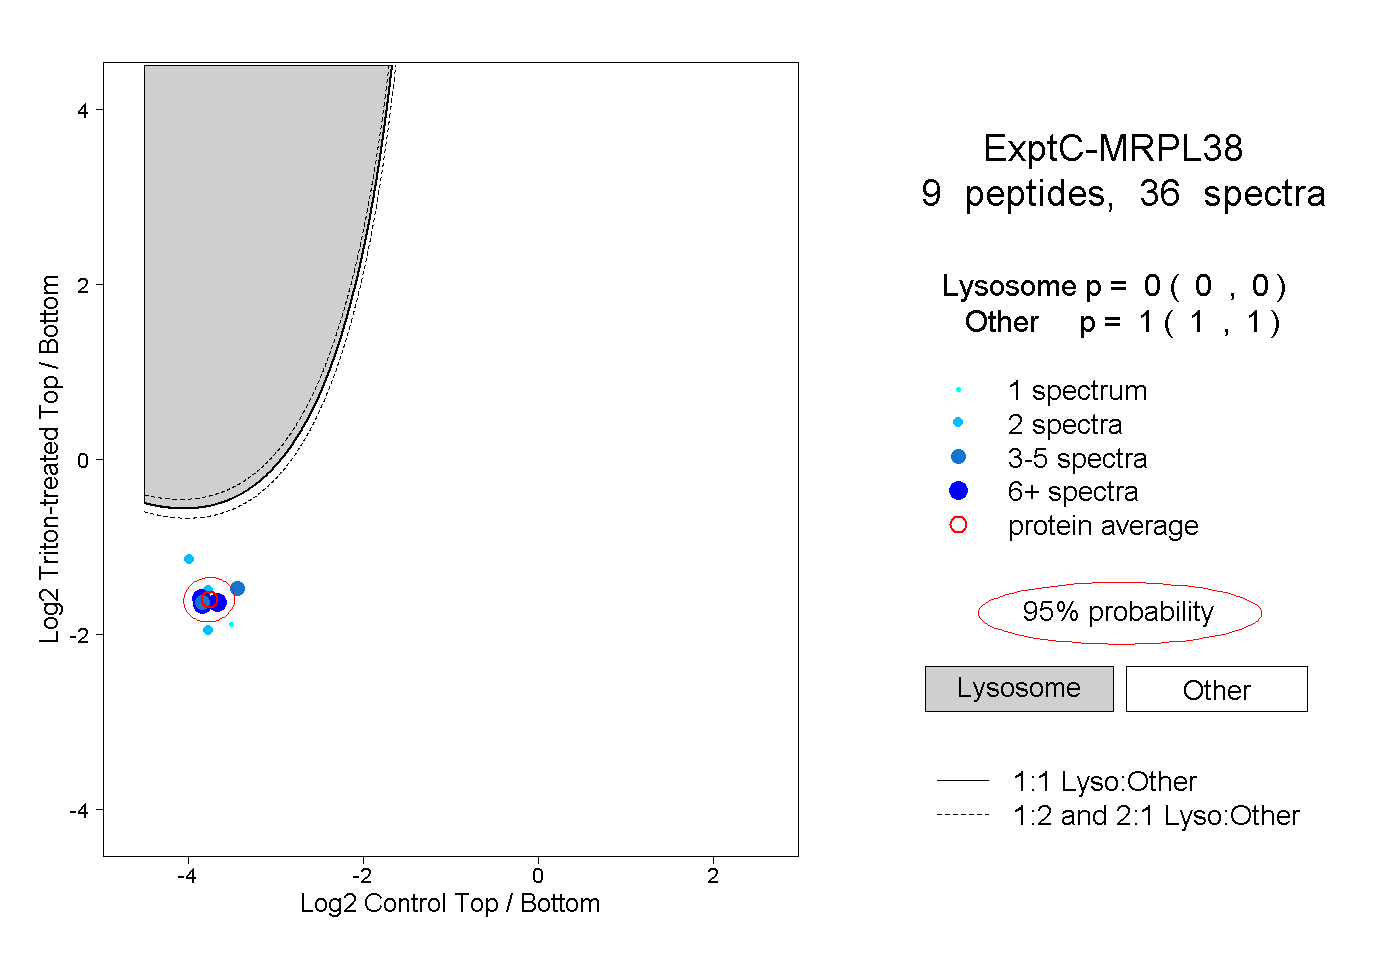
0.000 | 0.000
1.000 | 1.000
2peptides
spectra
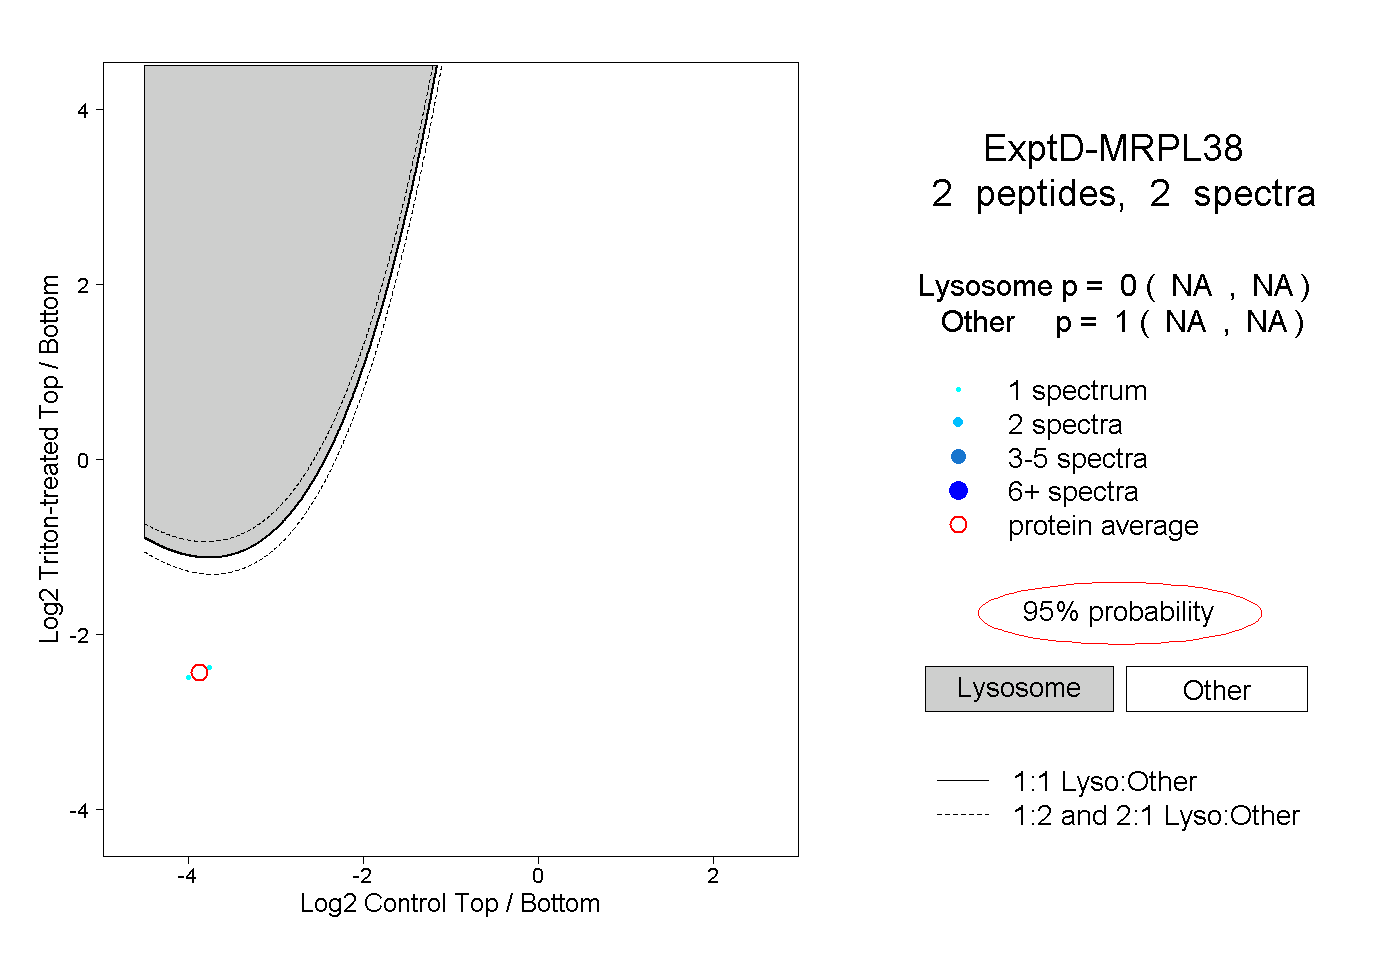
NA | NA
NA | NA