 8
8peptides
spectra
0.769 | 0.816
0.140 | 0.183
0.000 | 0.008
0.000 | 0.000
0.000 | 0.000
0.000 | 0.078
0.000 | 0.000
0.000 | 0.000
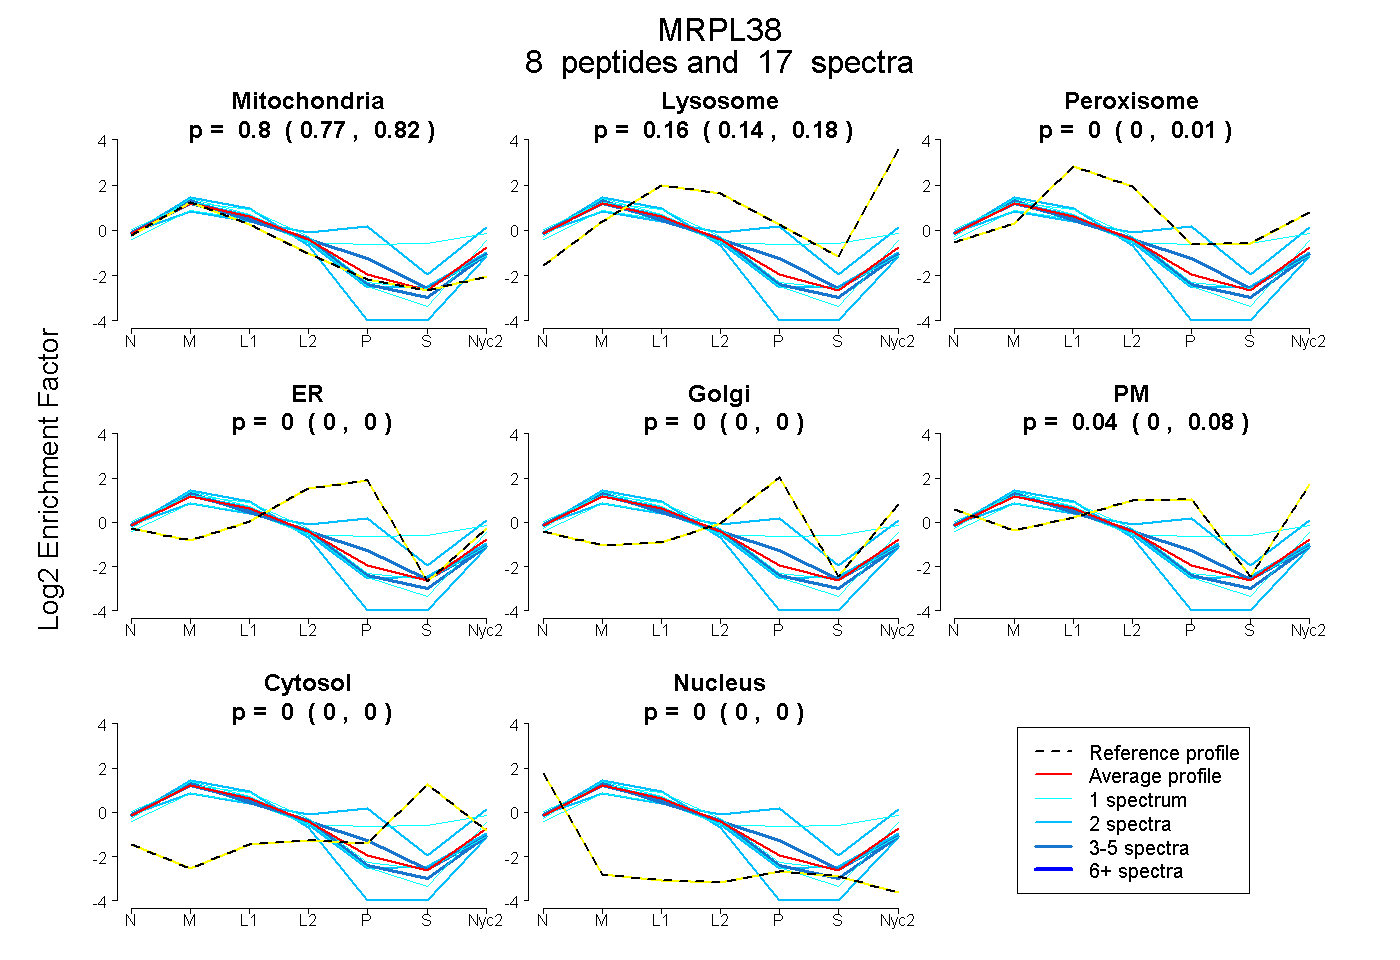
| Plot | Mito | Lyso | Perox | ER | Golgi | PM | Cytosol | Nucleus | |||||
| Expt A |
8 peptides |
17 spectra |
|
0.795 0.769 | 0.816 |
0.165 0.140 | 0.183 |
0.000 0.000 | 0.008 |
0.000 0.000 | 0.000 |
0.000 0.000 | 0.000 |
0.040 0.000 | 0.078 |
0.000 0.000 | 0.000 |
0.000 0.000 | 0.000 |
| 2 spectra, FPHQQPLR | 0.396 | 0.104 | 0.078 | 0.000 | 0.231 | 0.191 | 0.000 | 0.000 | ||
| 2 spectra, AEQEAHAPHWWR | 0.847 | 0.107 | 0.046 | 0.000 | 0.000 | 0.000 | 0.000 | 0.000 | ||
| 1 spectrum, TPPLGPMPNEDIDVSNLER | 0.821 | 0.179 | 0.000 | 0.000 | 0.000 | 0.000 | 0.000 | 0.000 | ||
| 1 spectrum, TFHTLDFYK | 0.796 | 0.029 | 0.175 | 0.000 | 0.000 | 0.000 | 0.000 | 0.000 | ||
| 4 spectra, LAEYYGLYR | 0.742 | 0.043 | 0.034 | 0.018 | 0.000 | 0.163 | 0.000 | 0.000 | ||
| 2 spectra, EPVFEFVRPPPYHPK | 0.995 | 0.005 | 0.000 | 0.000 | 0.000 | 0.000 | 0.000 | 0.000 | ||
| 4 spectra, TASIPLEAVR | 0.882 | 0.116 | 0.000 | 0.000 | 0.000 | 0.002 | 0.000 | 0.000 | ||
| 1 spectrum, HQEAMTPAGLAFFQCR | 0.421 | 0.194 | 0.130 | 0.000 | 0.056 | 0.000 | 0.199 | 0.000 |
| Plot | Mito | Lyso or Perox | ER | Golgi | PM | Cytosol | Nucleus | ||||||
| Expt B |
4 peptides |
6 spectra |
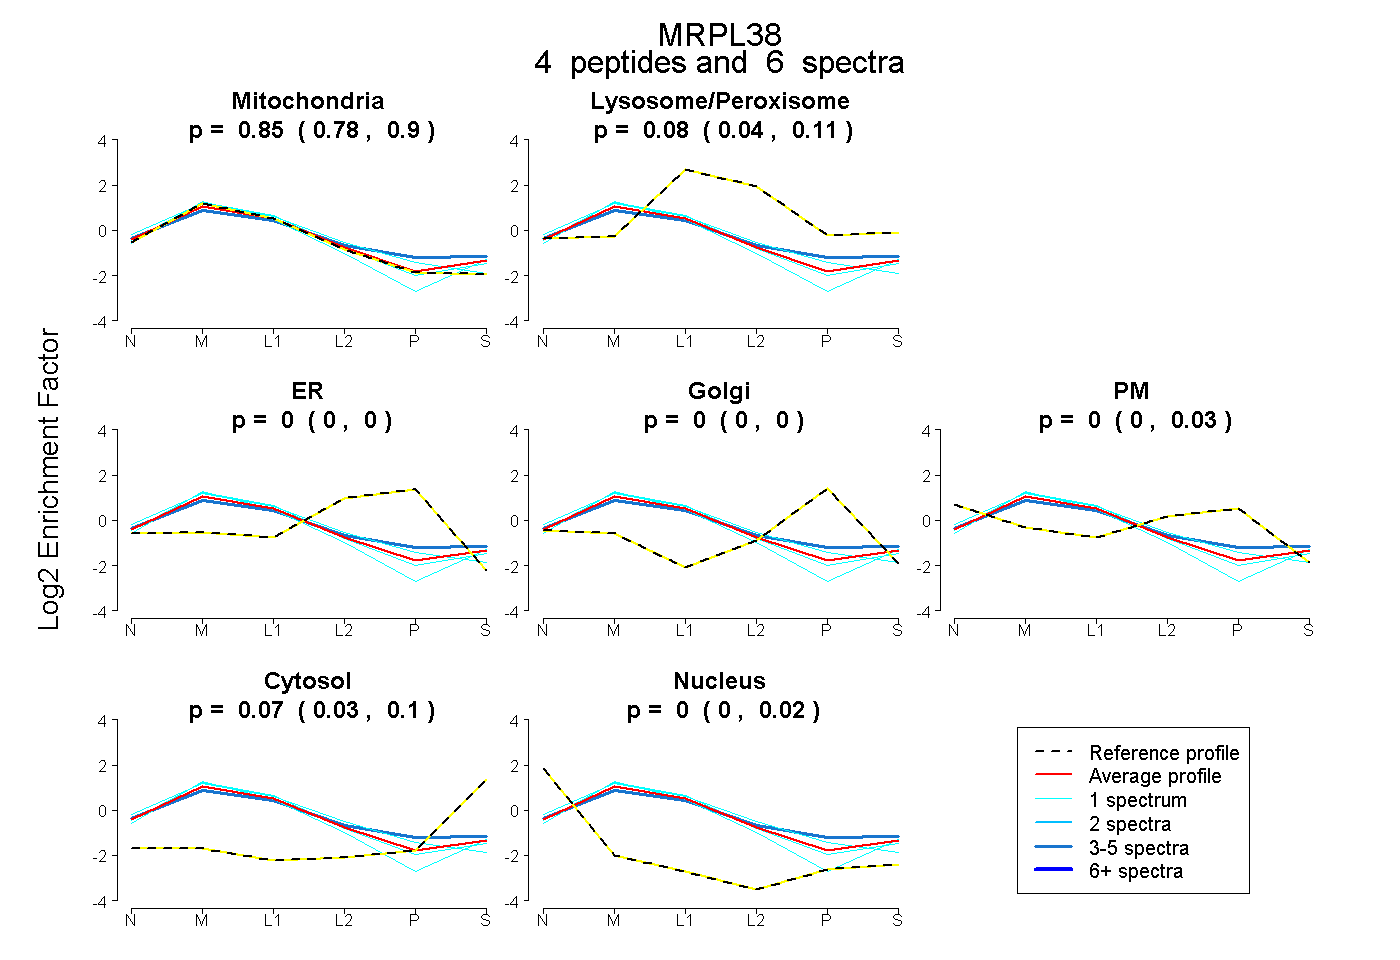 |
0.853 0.781 | 0.902 |
0.076 0.040 | 0.107 |
0.000 0.000 | 0.000 |
0.000 0.000 | 0.000 |
0.000 0.000 | 0.033 |
0.072 0.026 | 0.102 |
0.000 0.000 | 0.019 |
|||
| Plot | Lyso | Other | |||||||||||
| Expt C |
9 peptides |
36 spectra |
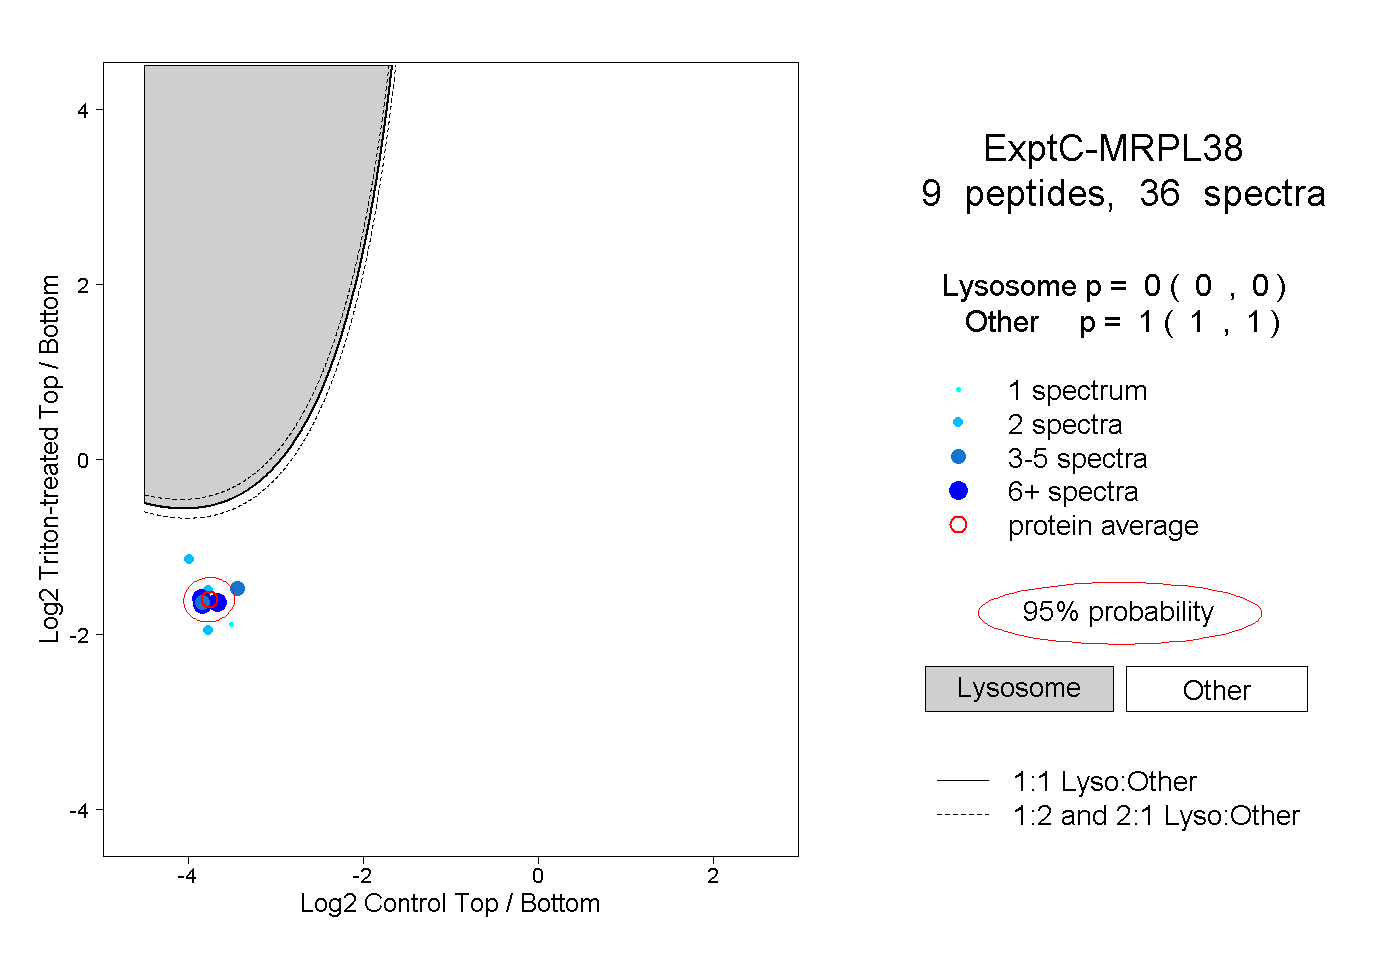 |
0.000 0.000 | 0.000 |
1.000 1.000 | 1.000 |
||||||||
| Plot | Lyso | Other | |||||||||||
| Expt D |
2 peptides |
2 spectra |
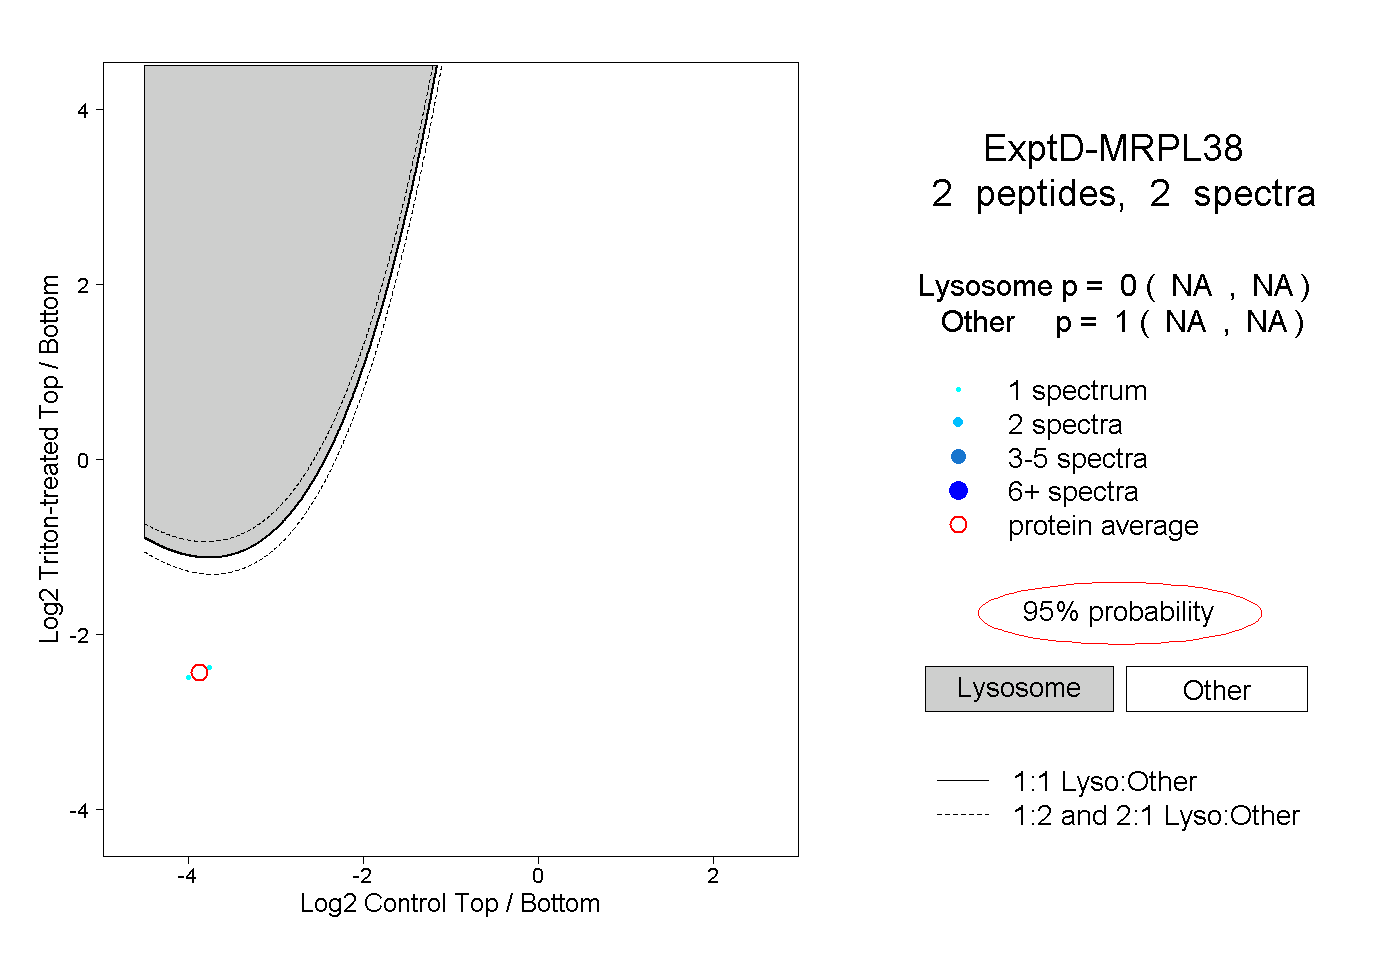 |
0.000 NA | NA |
1.000 NA | NA |