MRPL38
[ENSRNOP00000011328]
Main page
| | | Plot |
Mito |
Lyso |
|
Perox |
ER |
Golgi |
PM |
Cytosol |
Nucleus |
|
| Expt A |
 8
8
peptides |
17
spectra |
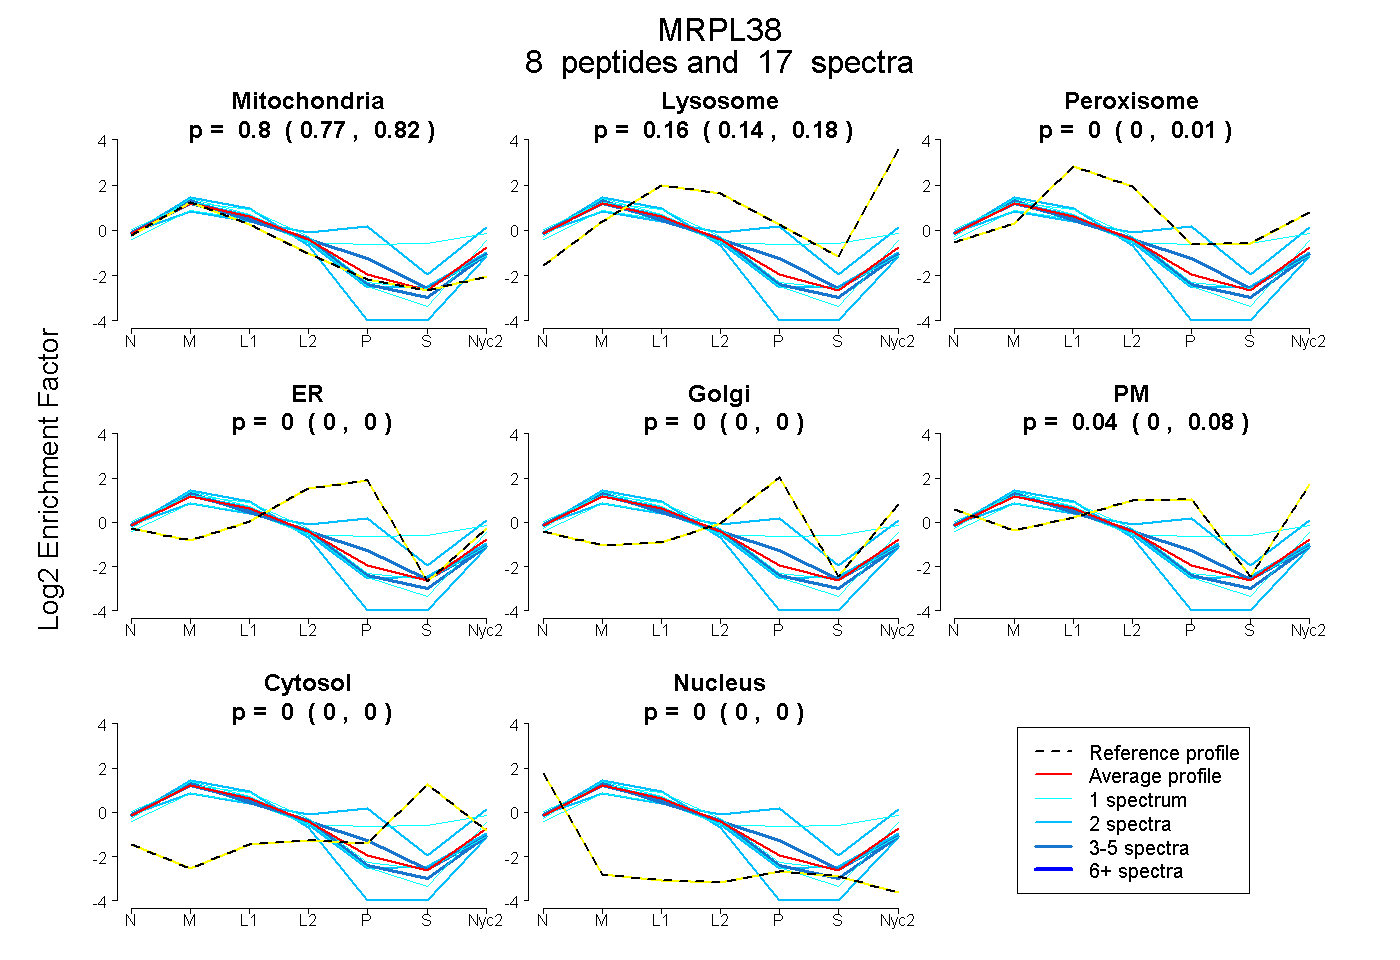 |
0.795
0.769 | 0.816 |
0.165
0.140 | 0.183 |
|
0.000
0.000 | 0.008 |
0.000
0.000 | 0.000 |
0.000
0.000 | 0.000 |
0.040
0.000 | 0.078 |
0.000
0.000 | 0.000 |
0.000
0.000 | 0.000 |
|
| | | Plot |
Mito |
|
Lyso or Perox |
|
ER |
Golgi |
PM |
Cytosol |
Nucleus |
|
| Expt B |
4
peptides |
6
spectra |
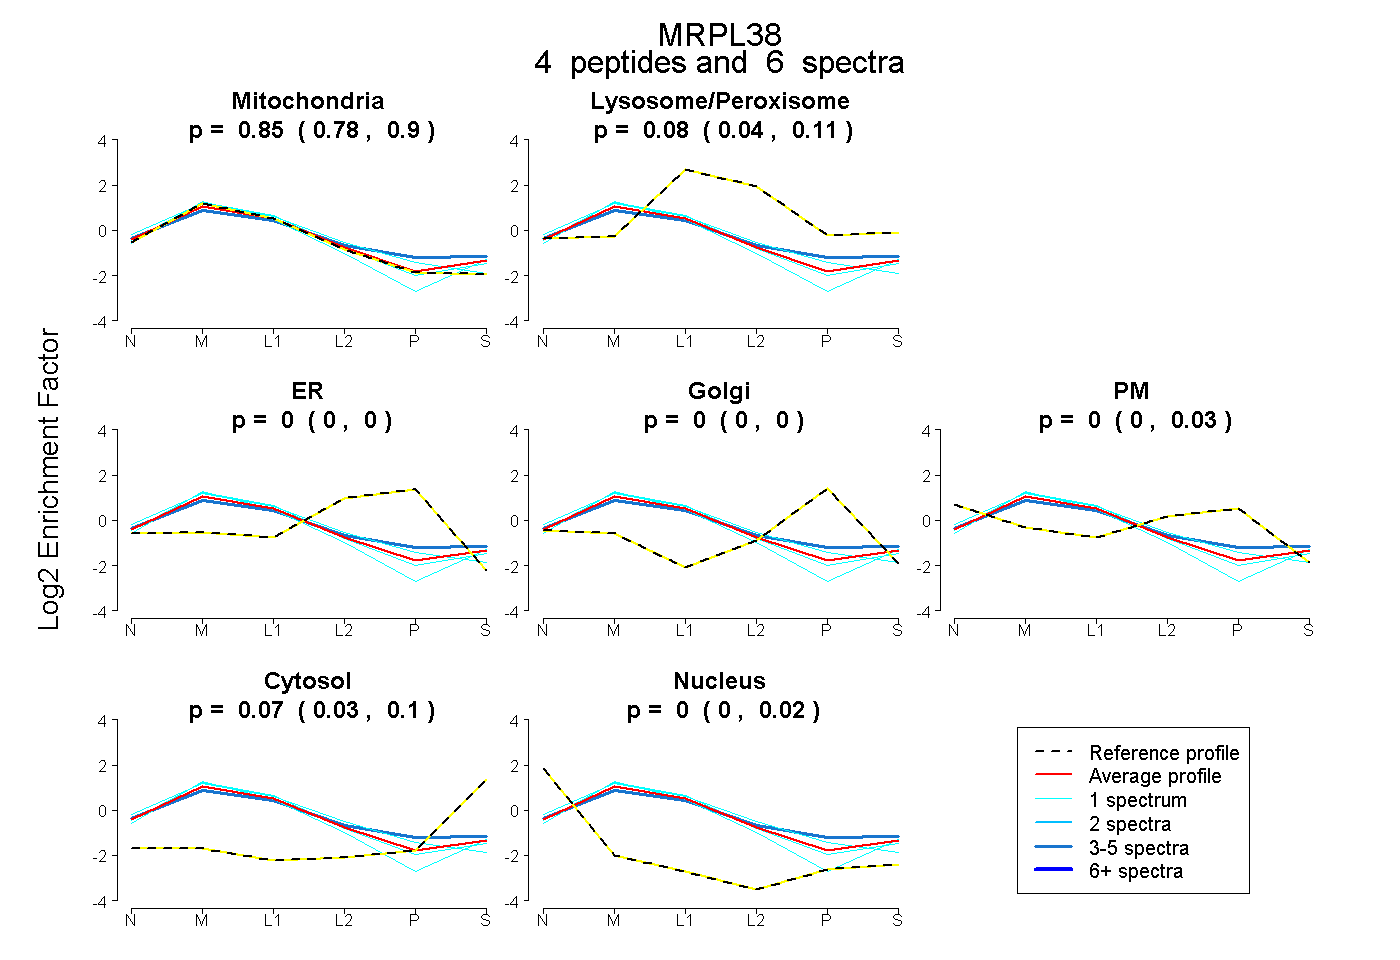 |
0.853
0.781 | 0.902 |
|
0.076
0.040 | 0.107 |
|
0.000
0.000 | 0.000 |
0.000
0.000 | 0.000 |
0.000
0.000 | 0.033 |
0.072
0.026 | 0.102 |
0.000
0.000 | 0.019 |
|
| 1 spectrum, LAEYYGLYR |
0.833 |
|
0.064 |
|
0.000 |
0.000 |
0.104 |
0.000 |
0.000 |
|
| 3 spectra, FPHQQPLR |
0.684 |
|
0.129 |
|
0.000 |
0.038 |
0.061 |
0.087 |
0.000 |
|
| 1 spectrum, TASIPLEAVR |
0.925 |
|
0.000 |
|
0.000 |
0.000 |
0.000 |
0.075 |
0.000 |
|
| 1 spectrum, FLQELR |
0.922 |
|
0.046 |
|
0.000 |
0.000 |
0.000 |
0.032 |
0.000 |
|
| | | Plot |
|
Lyso |
|
|
|
|
|
|
|
Other |
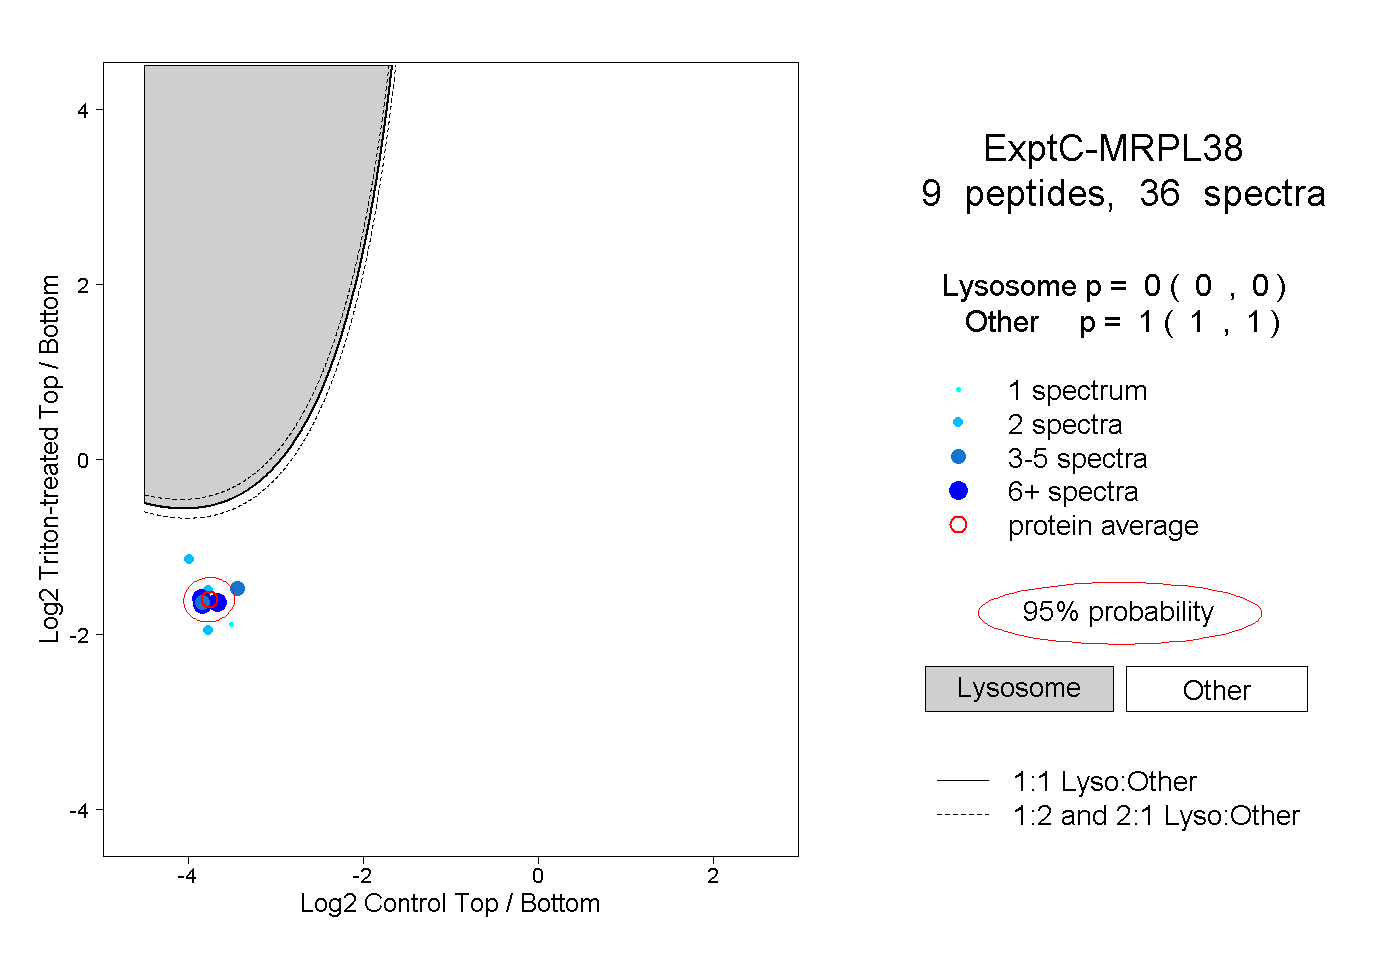
| Expt C |
9
peptides |
36
spectra |
 |
|
0.000
0.000 | 0.000 |
|
|
|
|
|
|
|
1.000
1.000 | 1.000 |
| | | Plot |
|
Lyso |
|
|
|
|
|
|
|
Other |
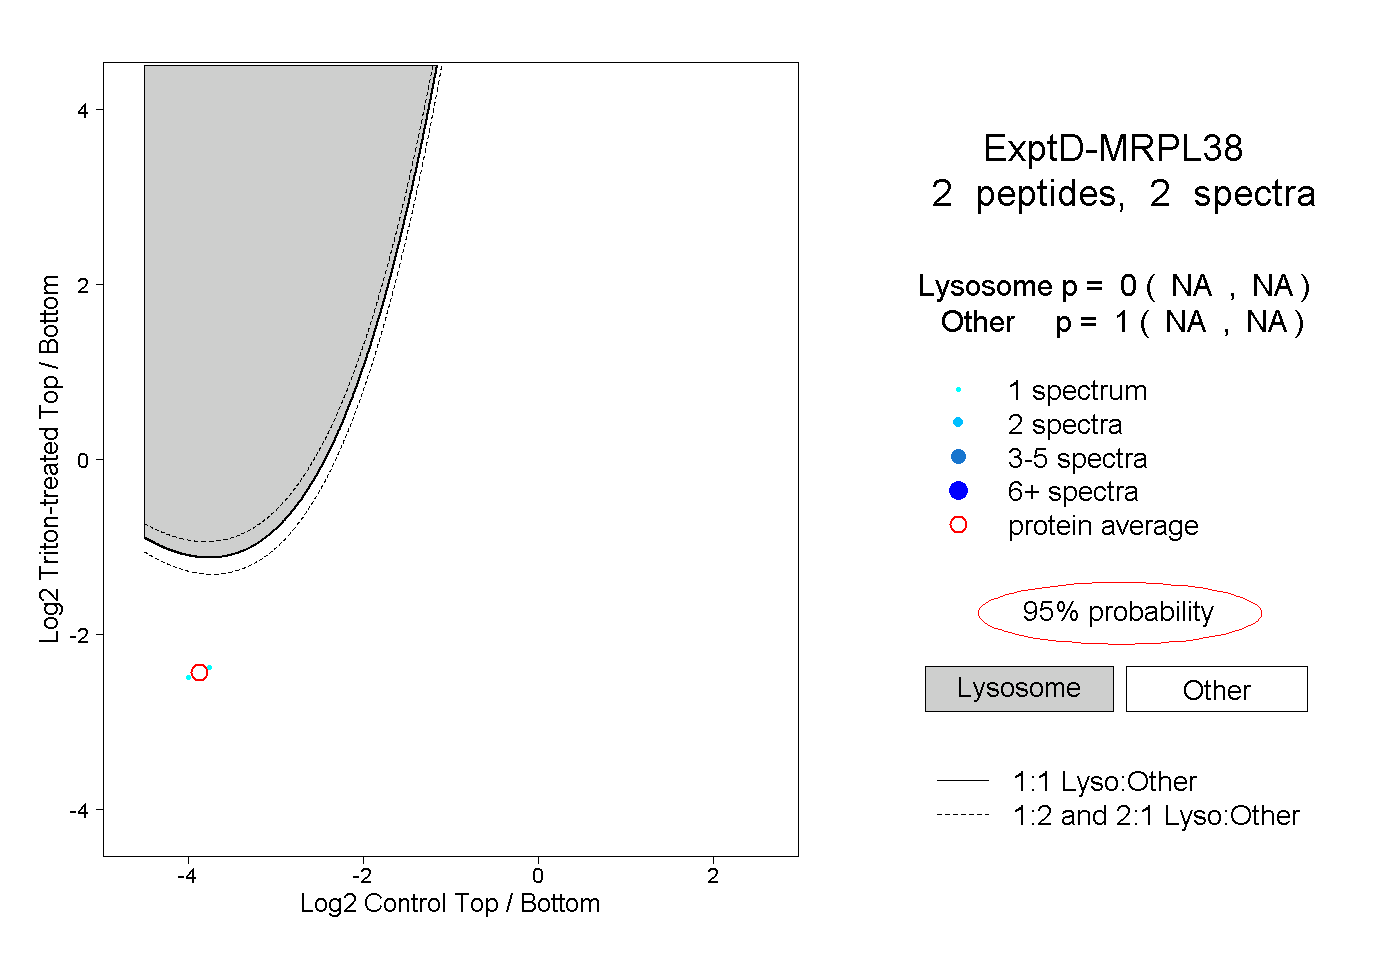
| Expt D |
2
peptides |
2
spectra |
 |
|
0.000
NA | NA |
|
|
|
|
|
|
|
1.000
NA | NA |