 4
4peptides
spectra
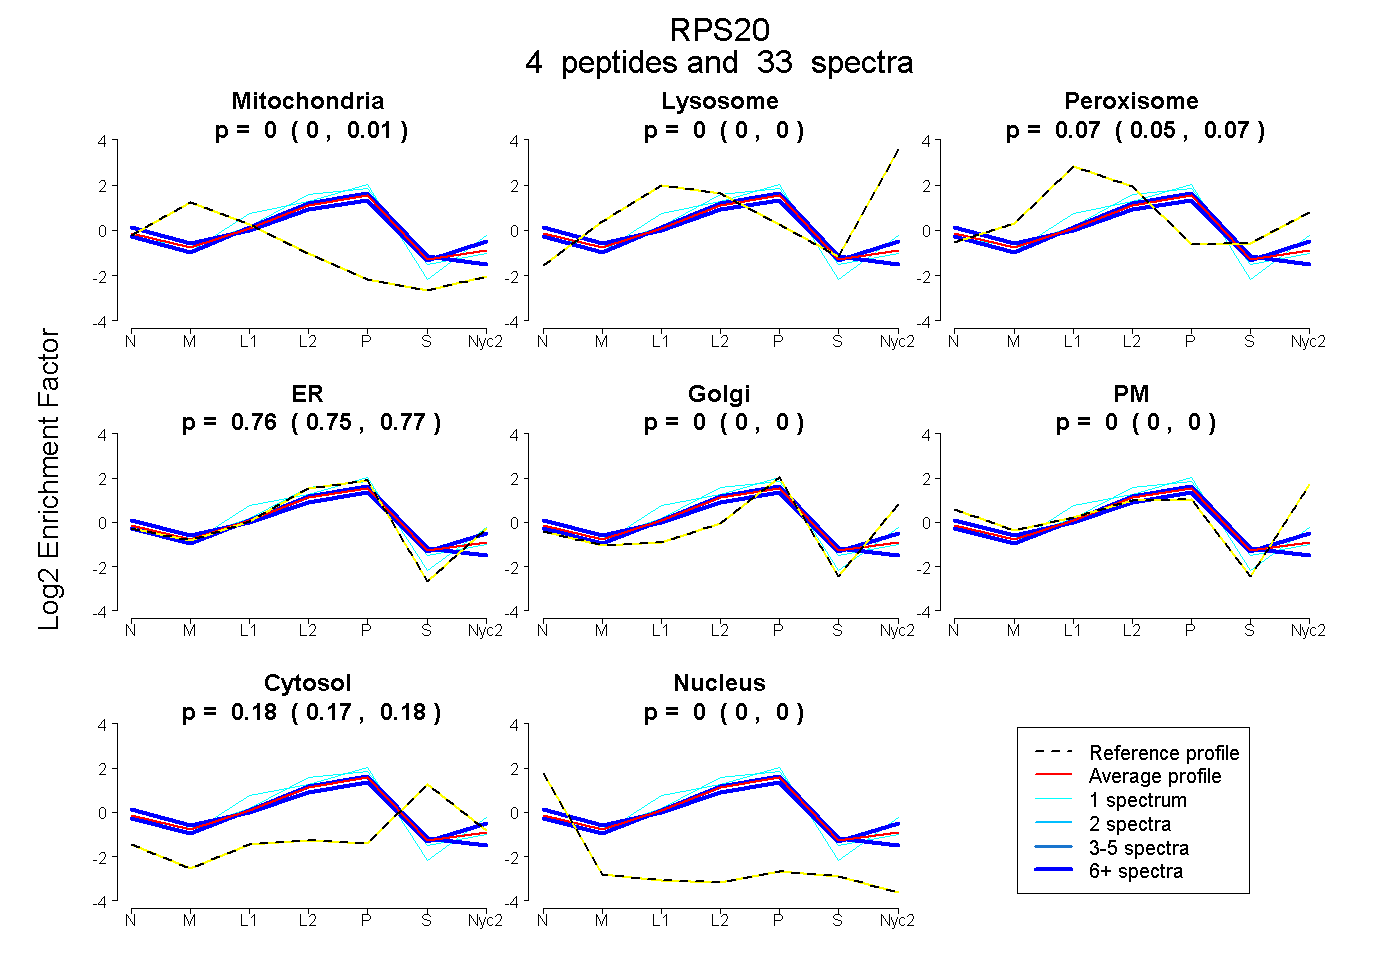
0.000 | 0.010
0.000 | 0.000
0.052 | 0.074
0.746 | 0.766
0.000 | 0.000
0.000 | 0.000
0.169 | 0.184
0.000 | 0.000
3peptides
spectra
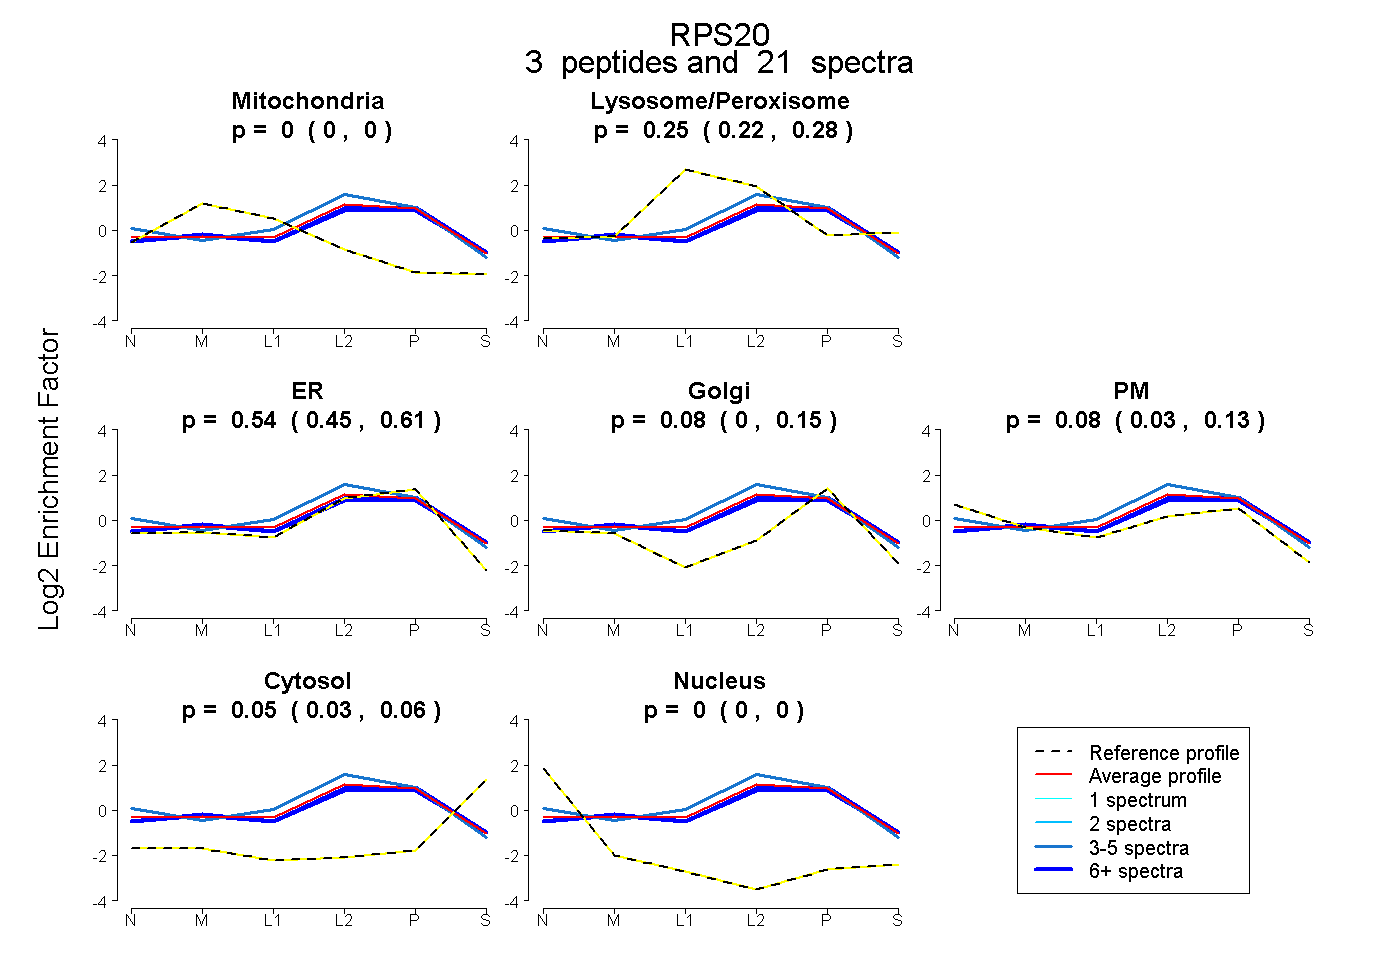
0.000 | 0.000
0.220 | 0.281
0.453 | 0.614
0.000 | 0.153
0.028 | 0.129
0.028 | 0.060
0.000 | 0.000
6peptides
spectra
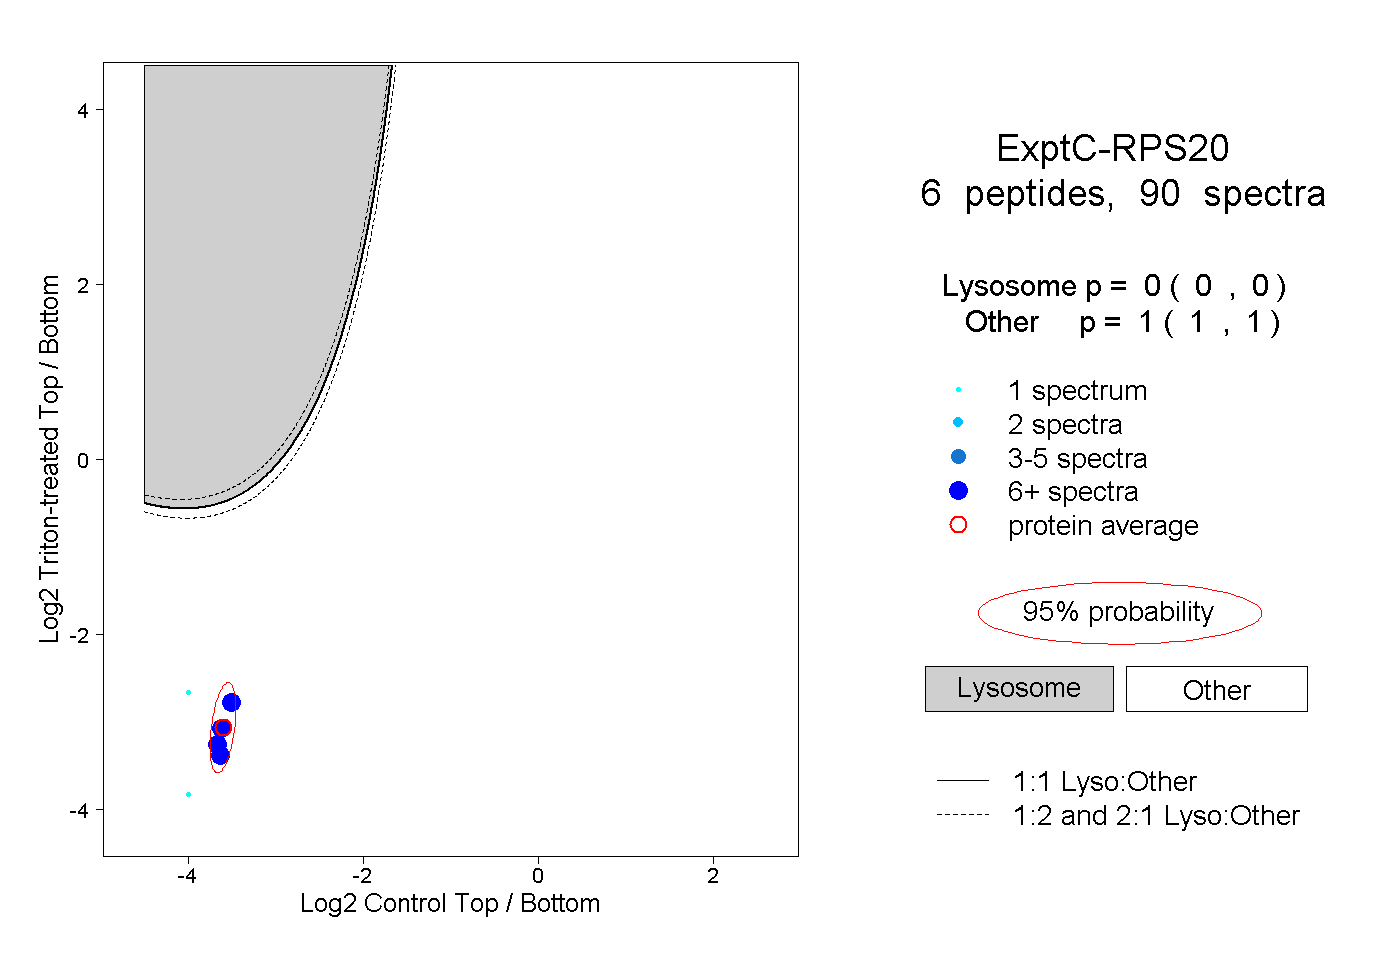
0.000 | 0.000
1.000 | 1.000
3peptides
spectra
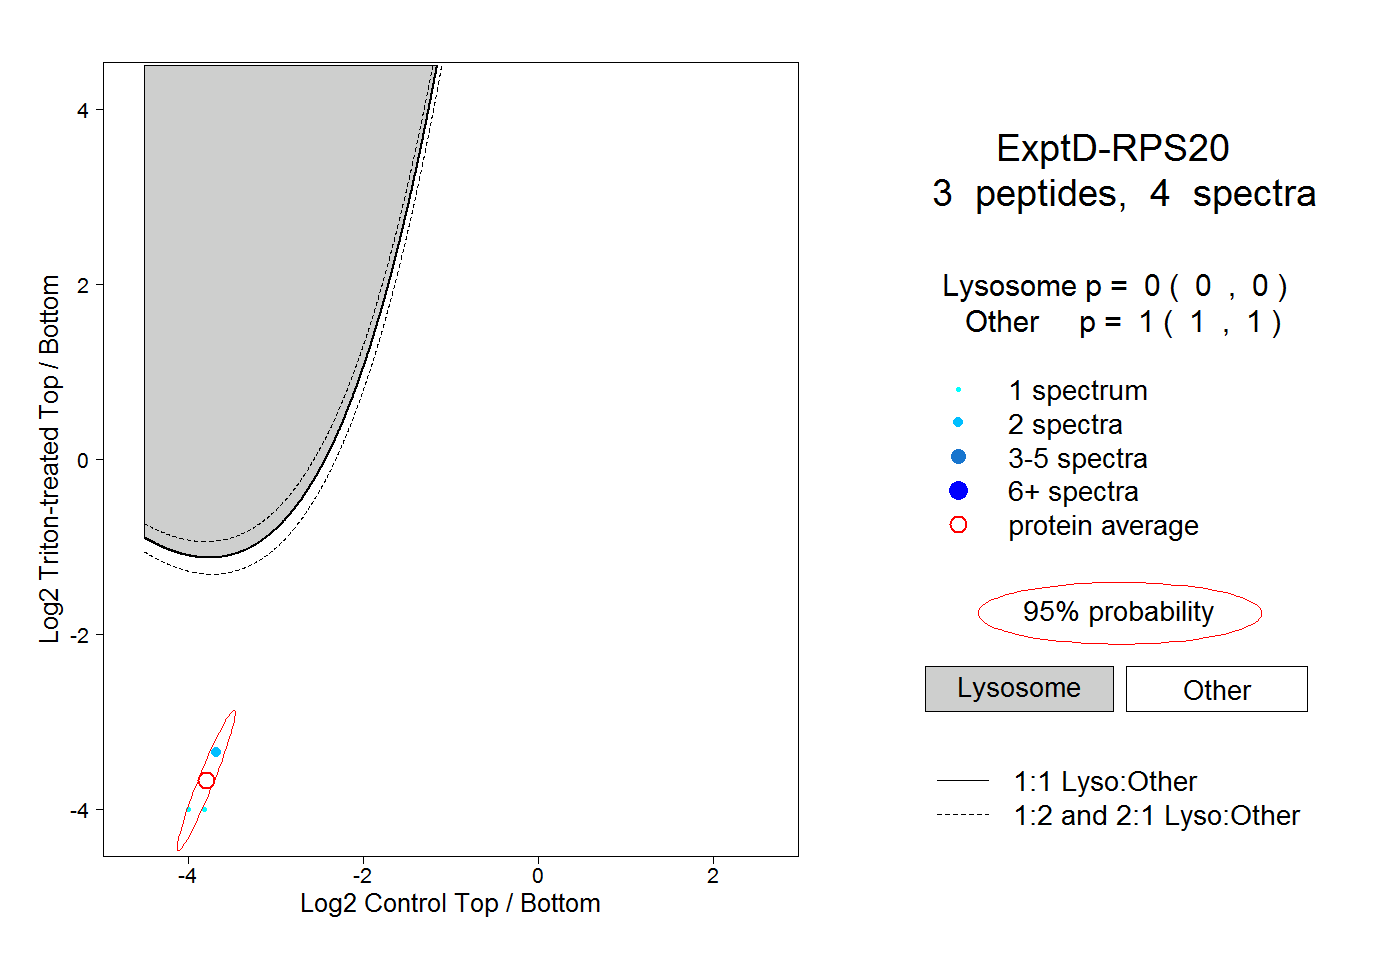
0.000 | 0.000
1.000 | 1.000