RPS20
[ENSRNOP00000011314]
Main page
| | | Plot |
Mito |
Lyso |
|
Perox |
ER |
Golgi |
PM |
Cytosol |
Nucleus |
|
| Expt A |
 4
4
peptides |
33
spectra |
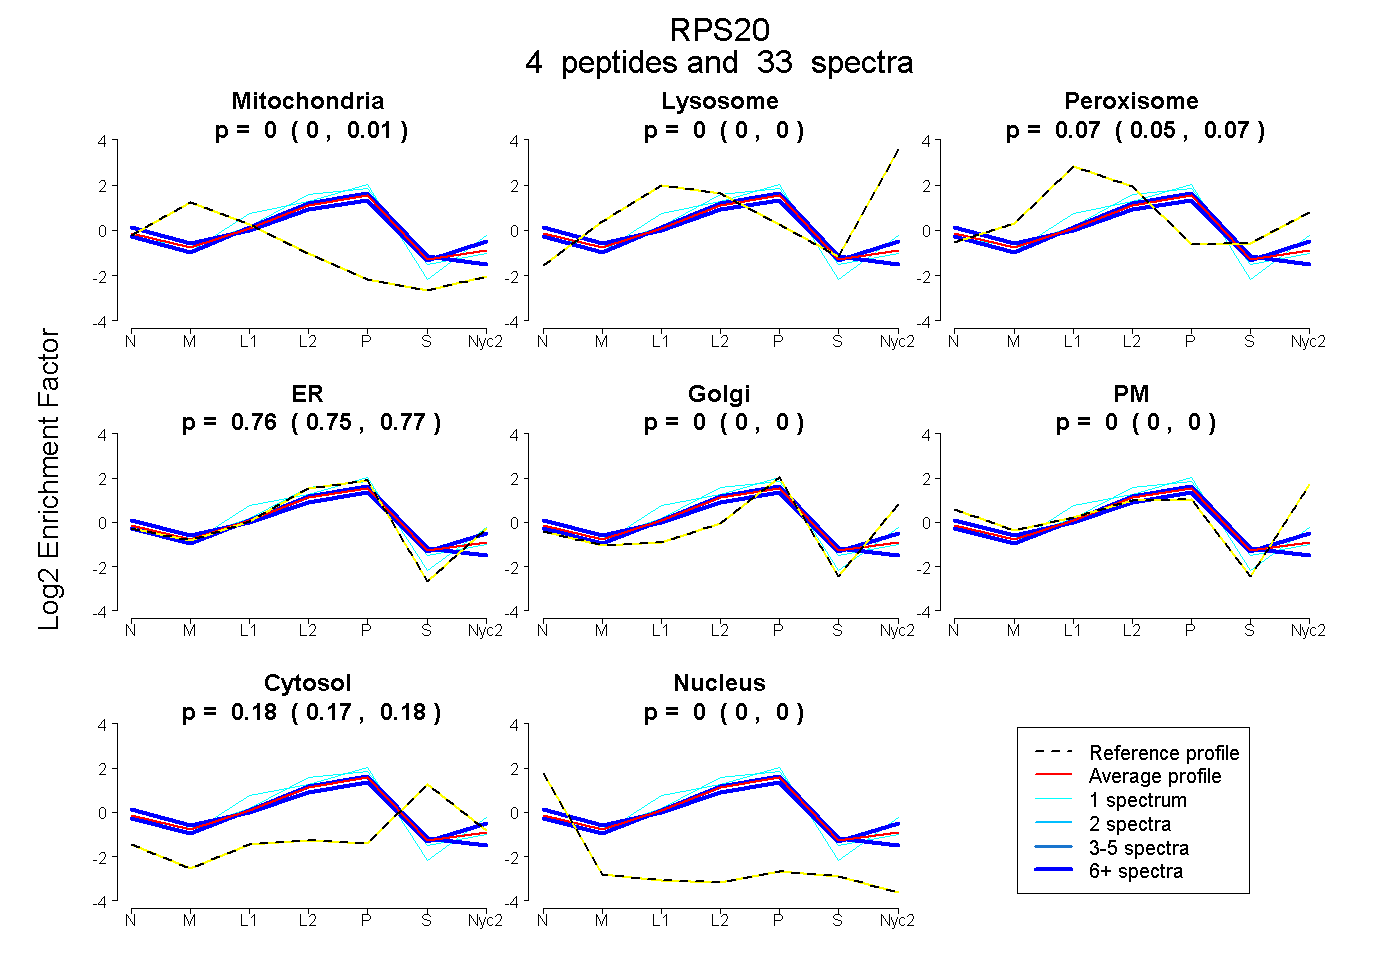 |
0.000
0.000 | 0.010 |
0.000
0.000 | 0.000 |
|
0.065
0.052 | 0.074 |
0.757
0.746 | 0.766 |
0.000
0.000 | 0.000 |
0.000
0.000 | 0.000 |
0.178
0.169 | 0.184 |
0.000
0.000 | 0.000 |
|
| | | Plot |
Mito |
|
Lyso or Perox |
|
ER |
Golgi |
PM |
Cytosol |
Nucleus |
|
| Expt B |
3
peptides |
21
spectra |
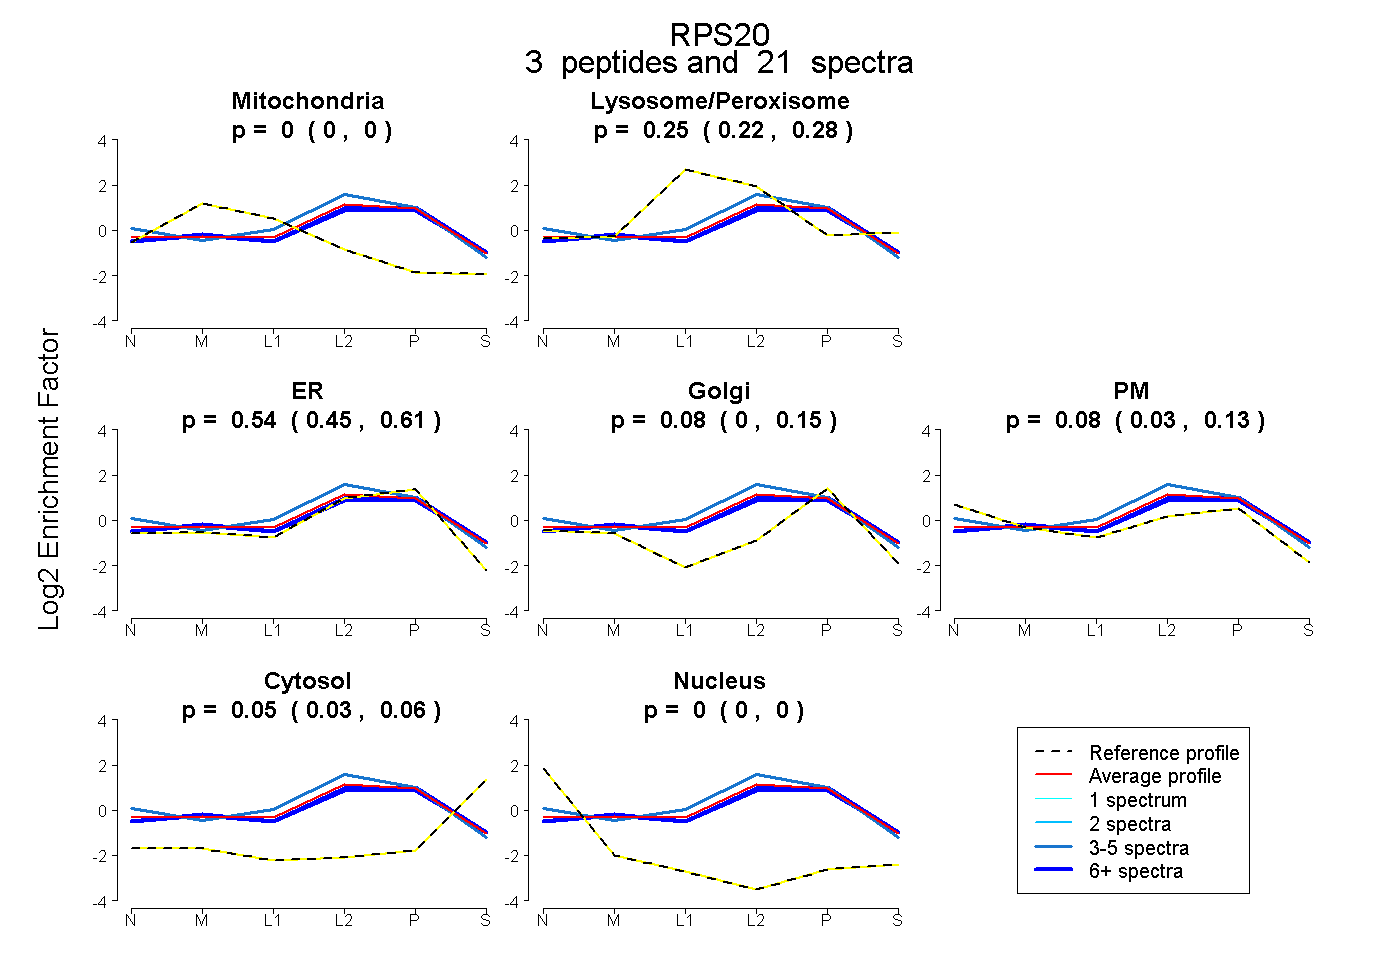 |
0.000
0.000 | 0.000 |
|
0.252
0.220 | 0.281 |
|
0.539
0.453 | 0.614 |
0.080
0.000 | 0.153 |
0.083
0.028 | 0.129 |
0.045
0.028 | 0.060 |
0.000
0.000 | 0.000 |
|
| 6 spectra, LIDLHSPSEIVK |
0.000 |
|
0.264 |
|
0.451 |
0.211 |
0.003 |
0.071 |
0.000 |
|
| 5 spectra, VCADLIR |
0.000 |
|
0.300 |
|
0.533 |
0.000 |
0.166 |
0.000 |
0.000 |
|
| 10 spectra, TPVEPEVAIHR |
0.000 |
|
0.250 |
|
0.513 |
0.180 |
0.000 |
0.057 |
0.000 |
|
| | | Plot |
|
Lyso |
|
|
|
|
|
|
|
Other |
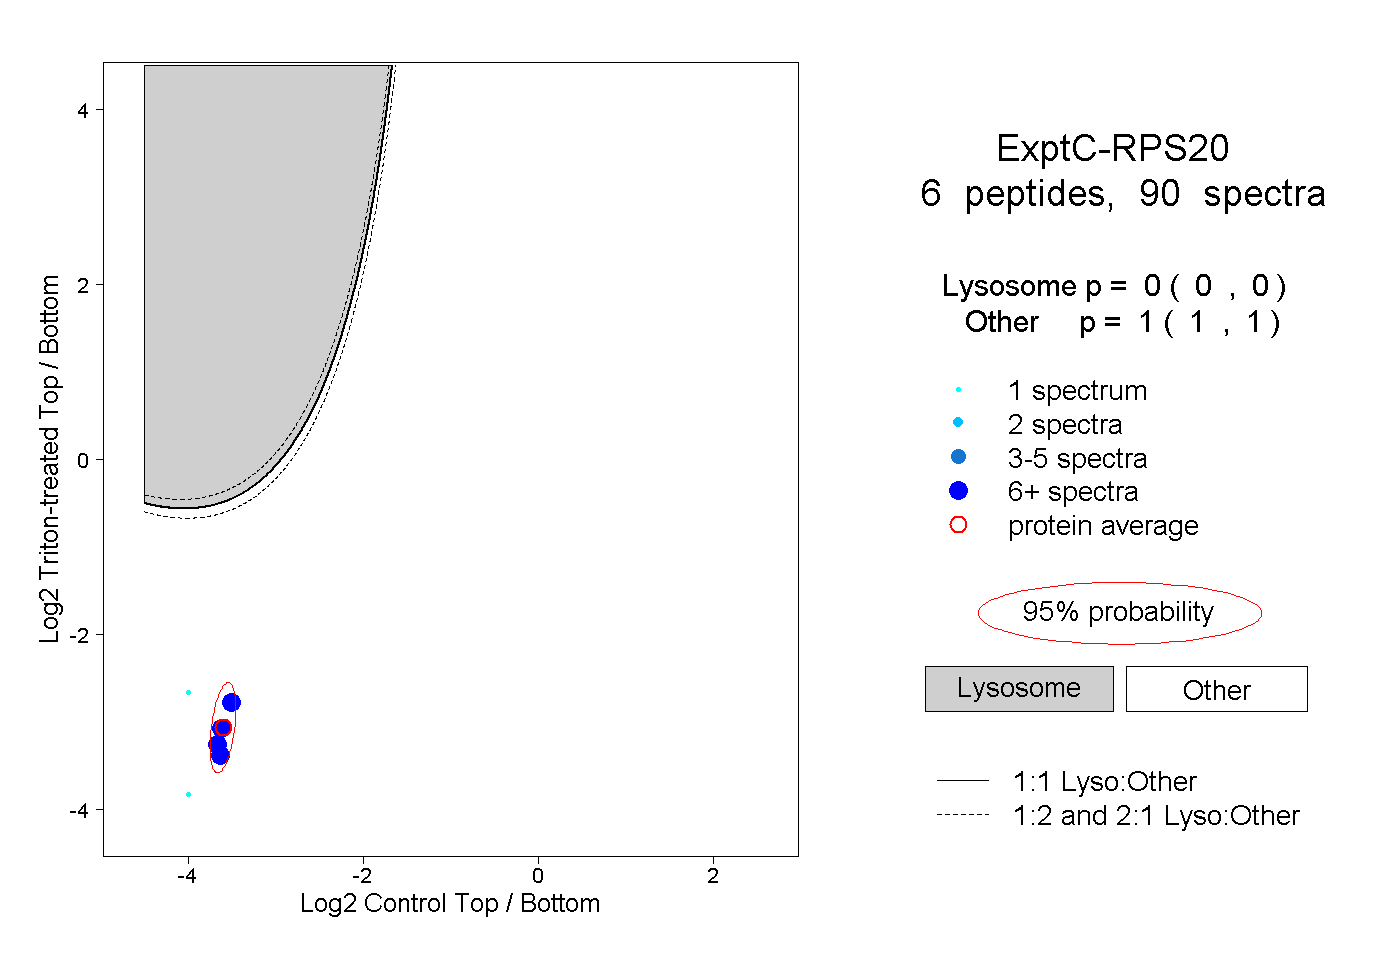
| Expt C |
6
peptides |
90
spectra |
 |
|
0.000
0.000 | 0.000 |
|
|
|
|
|
|
|
1.000
1.000 | 1.000 |
| | | Plot |
|
Lyso |
|
|
|
|
|
|
|
Other |
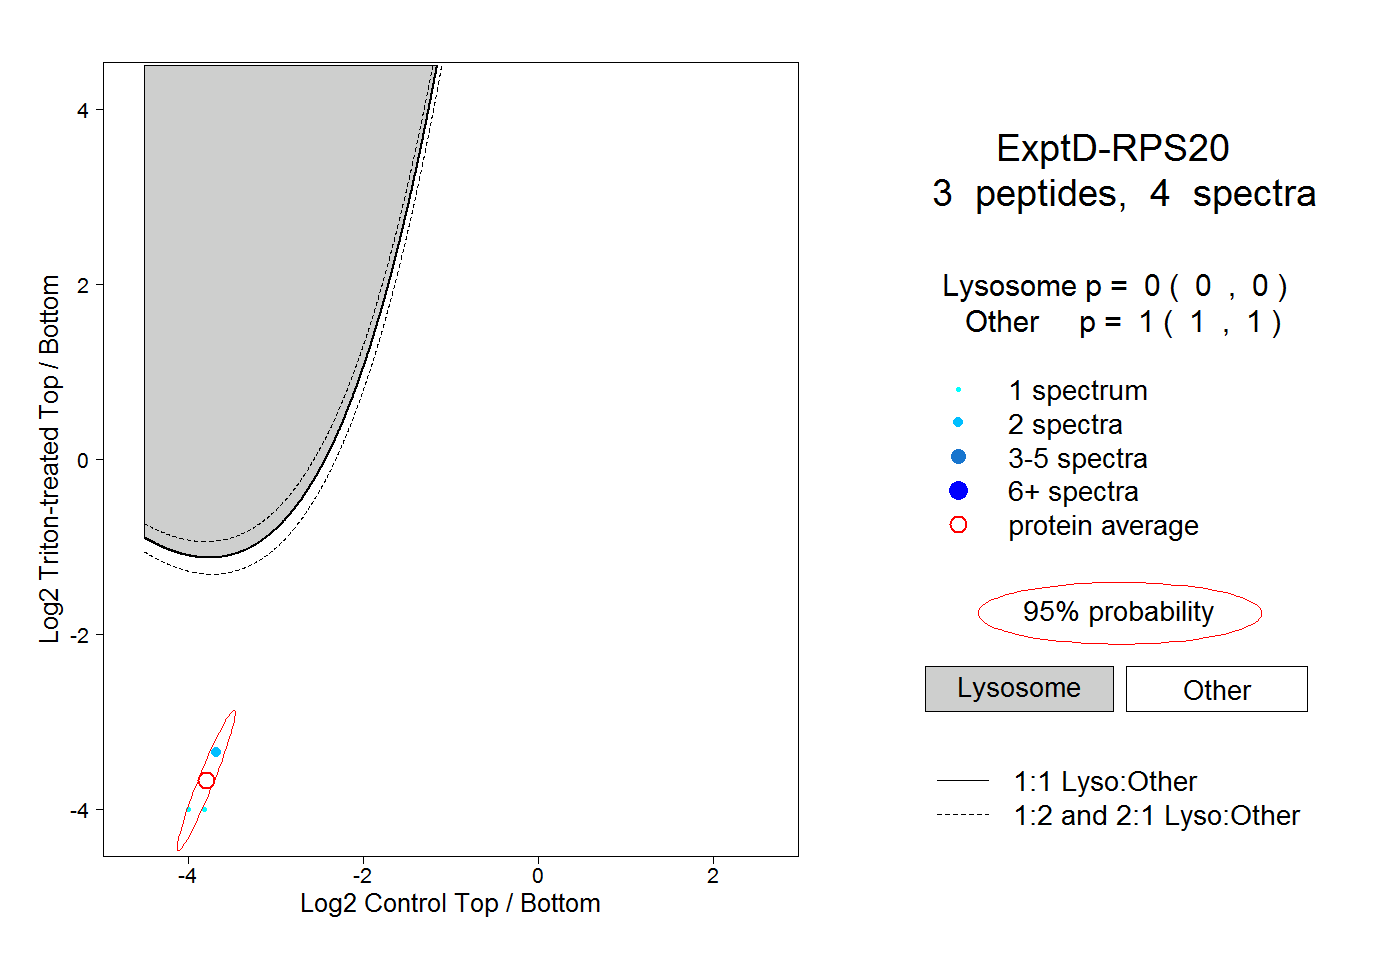
| Expt D |
3
peptides |
4
spectra |
 |
|
0.000
0.000 | 0.000 |
|
|
|
|
|
|
|
1.000
1.000 | 1.000 |