 4
4peptides
spectra
0.000 | 0.010
0.000 | 0.000
0.052 | 0.074
0.746 | 0.766
0.000 | 0.000
0.000 | 0.000
0.169 | 0.184
0.000 | 0.000
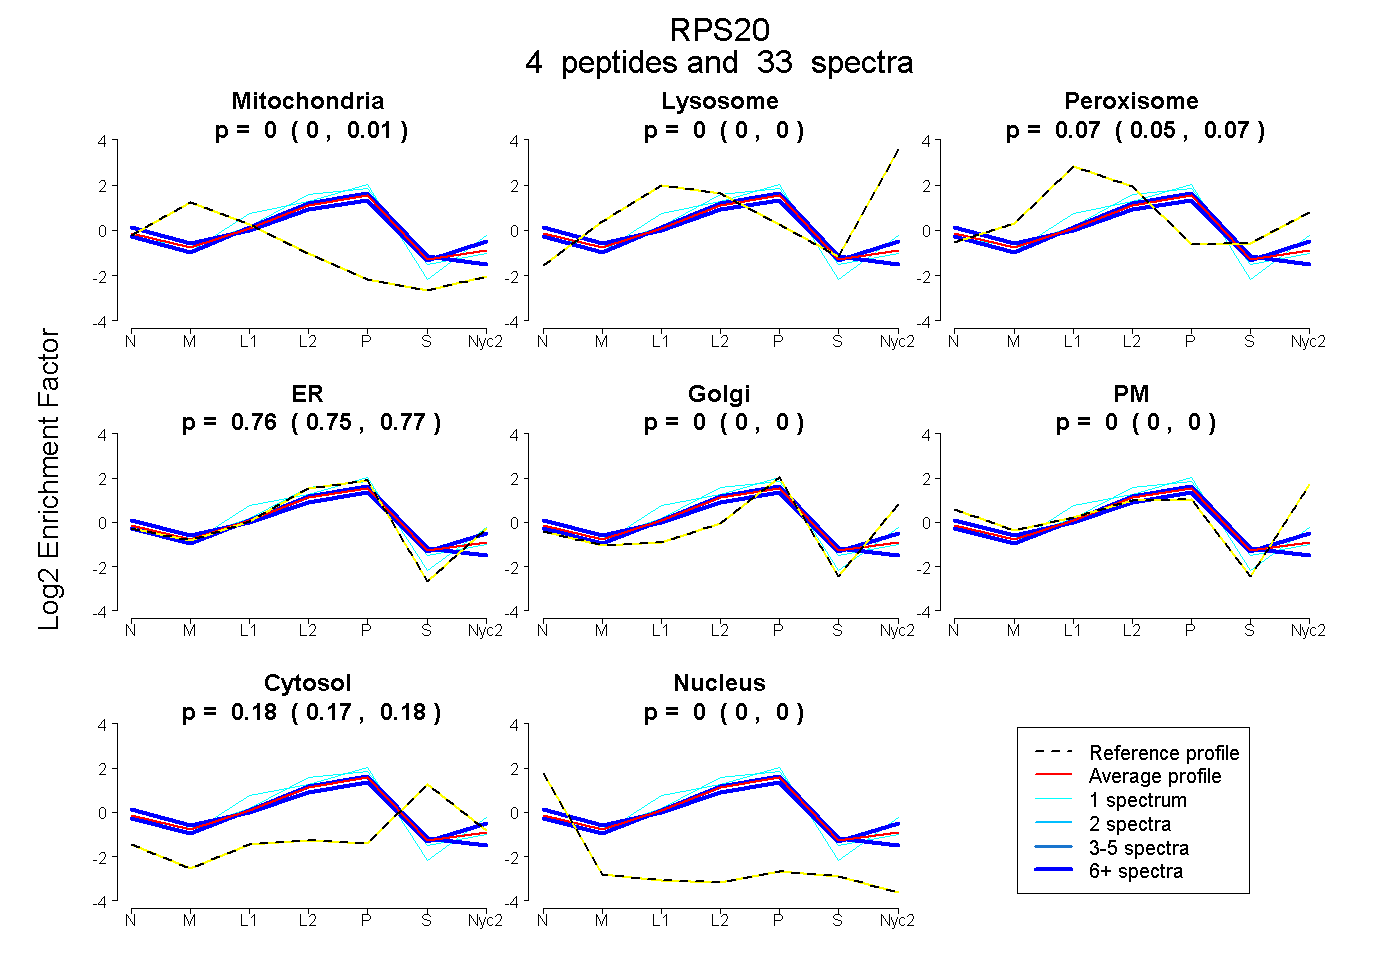
| Plot | Mito | Lyso | Perox | ER | Golgi | PM | Cytosol | Nucleus | |||||
| Expt A |
4 peptides |
33 spectra |
|
0.000 0.000 | 0.010 |
0.000 0.000 | 0.000 |
0.065 0.052 | 0.074 |
0.757 0.746 | 0.766 |
0.000 0.000 | 0.000 |
0.000 0.000 | 0.000 |
0.178 0.169 | 0.184 |
0.000 0.000 | 0.000 |
| 1 spectrum, TPCGEGSK | 0.000 | 0.000 | 0.125 | 0.809 | 0.066 | 0.000 | 0.001 | 0.000 | ||
| 1 spectrum, LIDLHSPSEIVK | 0.000 | 0.000 | 0.062 | 0.837 | 0.000 | 0.000 | 0.101 | 0.000 | ||
| 14 spectra, VCADLIR | 0.005 | 0.000 | 0.020 | 0.769 | 0.000 | 0.000 | 0.206 | 0.000 | ||
| 17 spectra, TPVEPEVAIHR | 0.019 | 0.000 | 0.092 | 0.676 | 0.000 | 0.040 | 0.162 | 0.012 |
| Plot | Mito | Lyso or Perox | ER | Golgi | PM | Cytosol | Nucleus | ||||||
| Expt B |
3 peptides |
21 spectra |
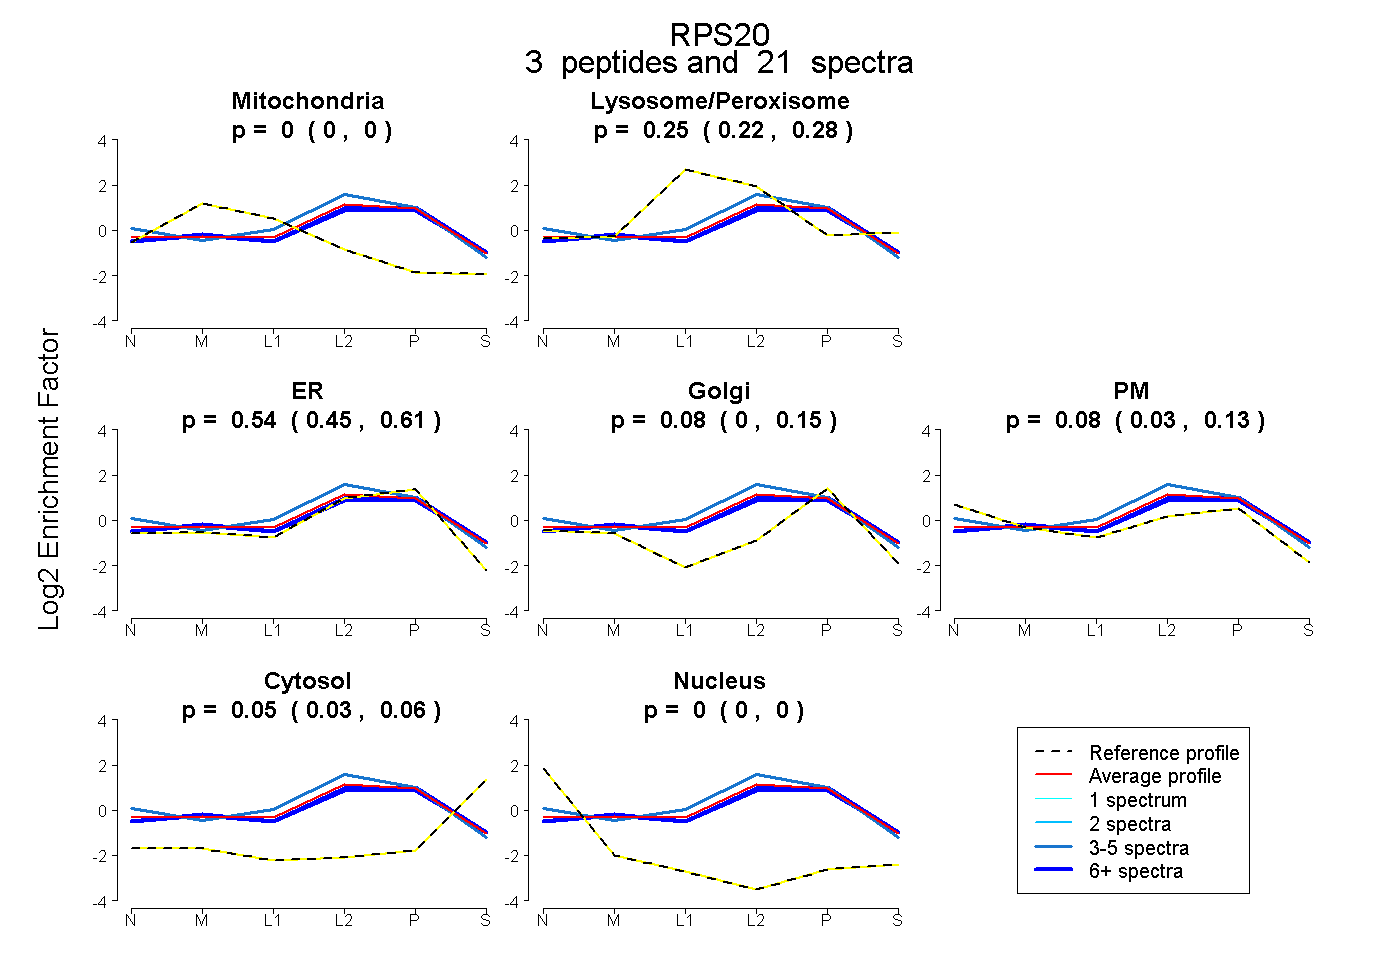 |
0.000 0.000 | 0.000 |
0.252 0.220 | 0.281 |
0.539 0.453 | 0.614 |
0.080 0.000 | 0.153 |
0.083 0.028 | 0.129 |
0.045 0.028 | 0.060 |
0.000 0.000 | 0.000 |
|||
| Plot | Lyso | Other | |||||||||||
| Expt C |
6 peptides |
90 spectra |
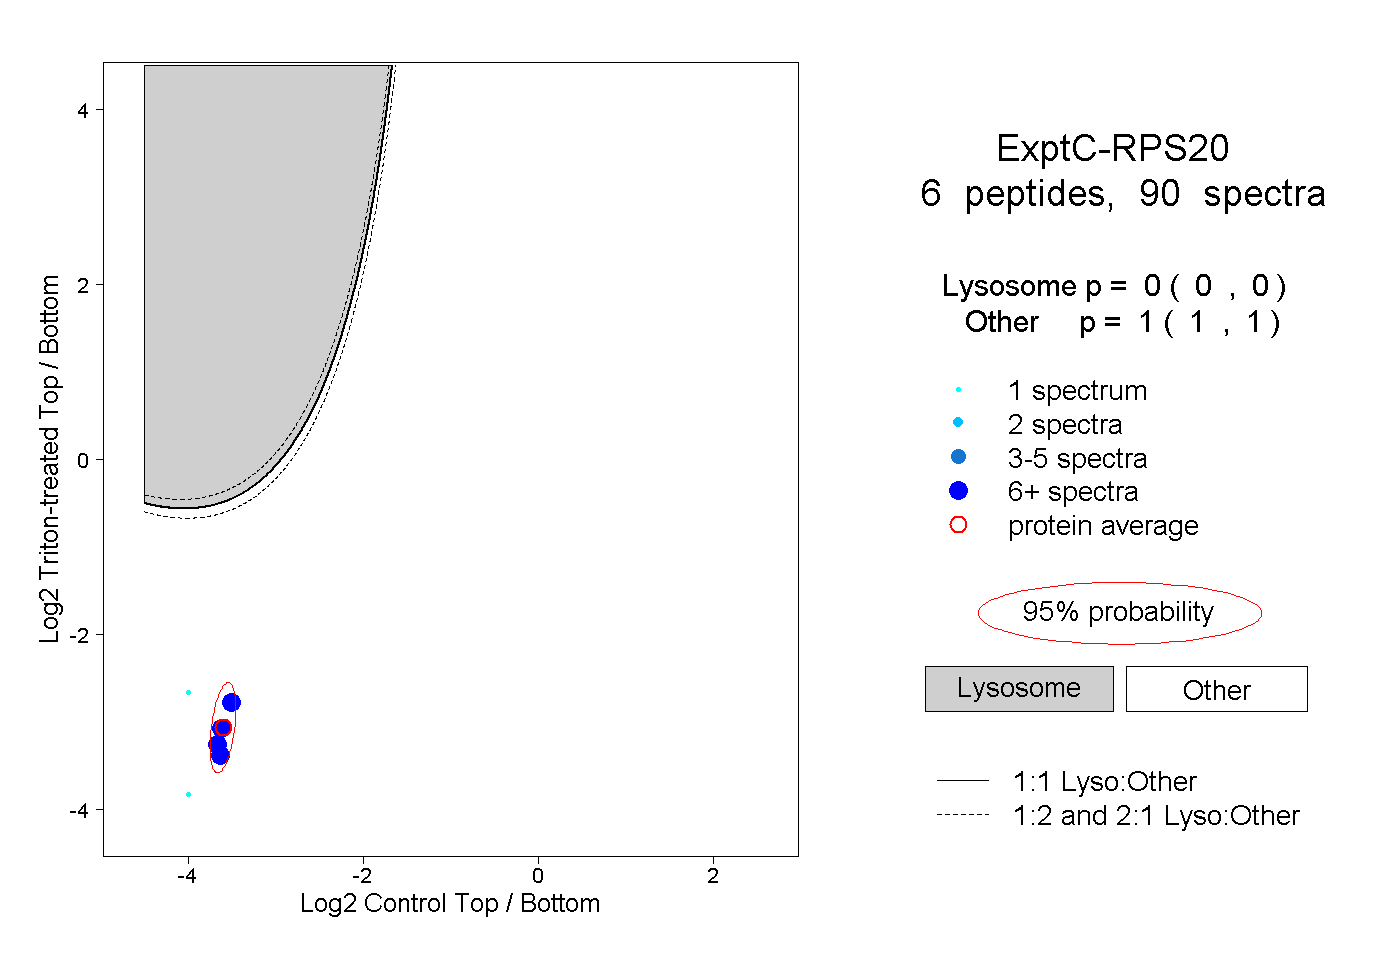 |
0.000 0.000 | 0.000 |
1.000 1.000 | 1.000 |
||||||||
| Plot | Lyso | Other | |||||||||||
| Expt D |
3 peptides |
4 spectra |
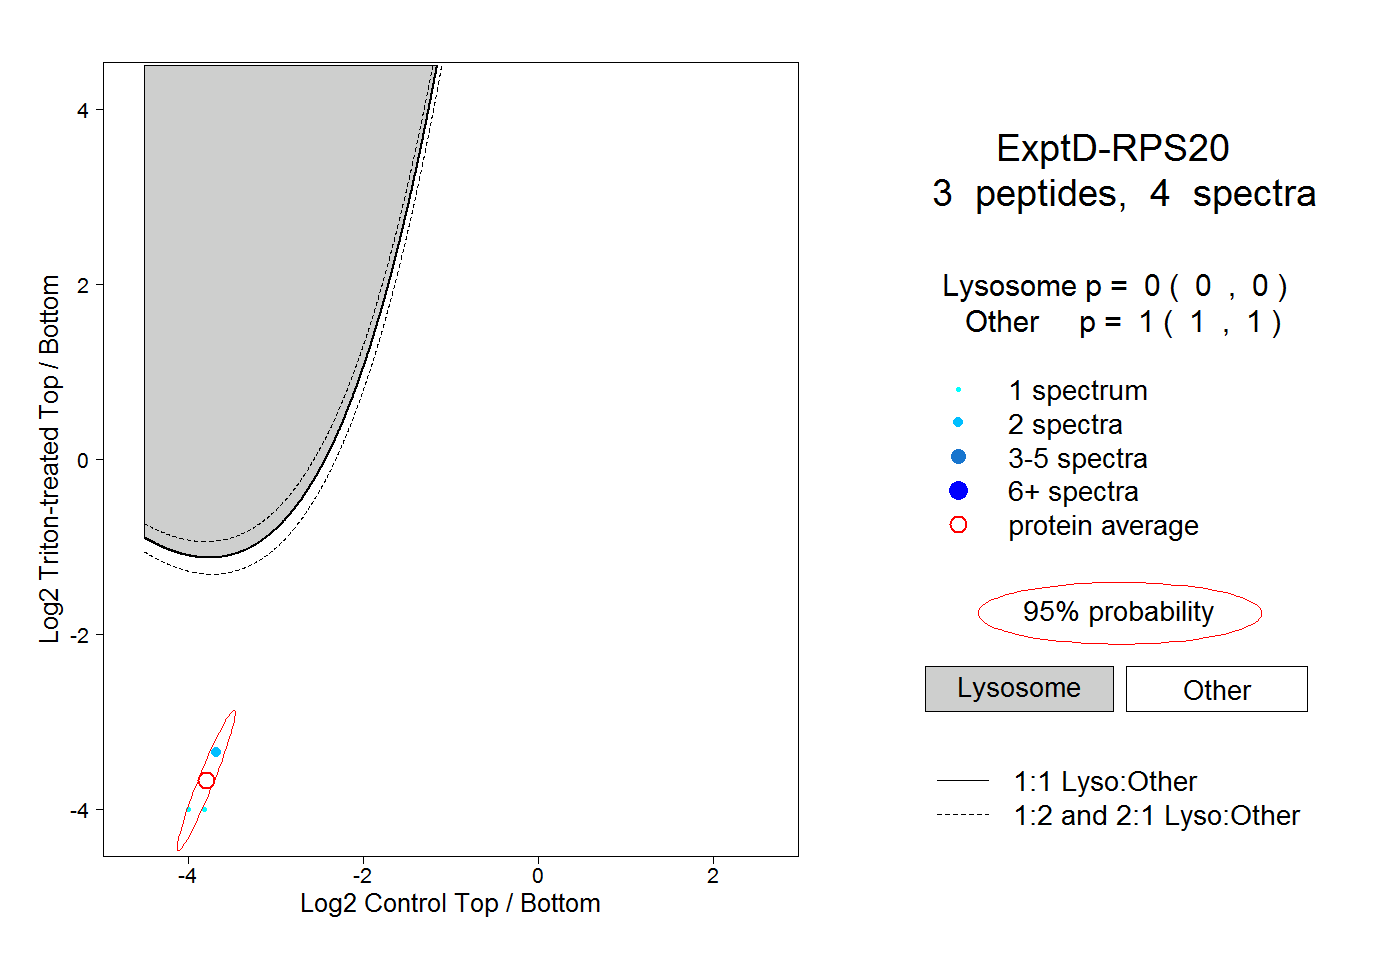 |
0.000 0.000 | 0.000 |
1.000 1.000 | 1.000 |