 29
29peptides
spectra
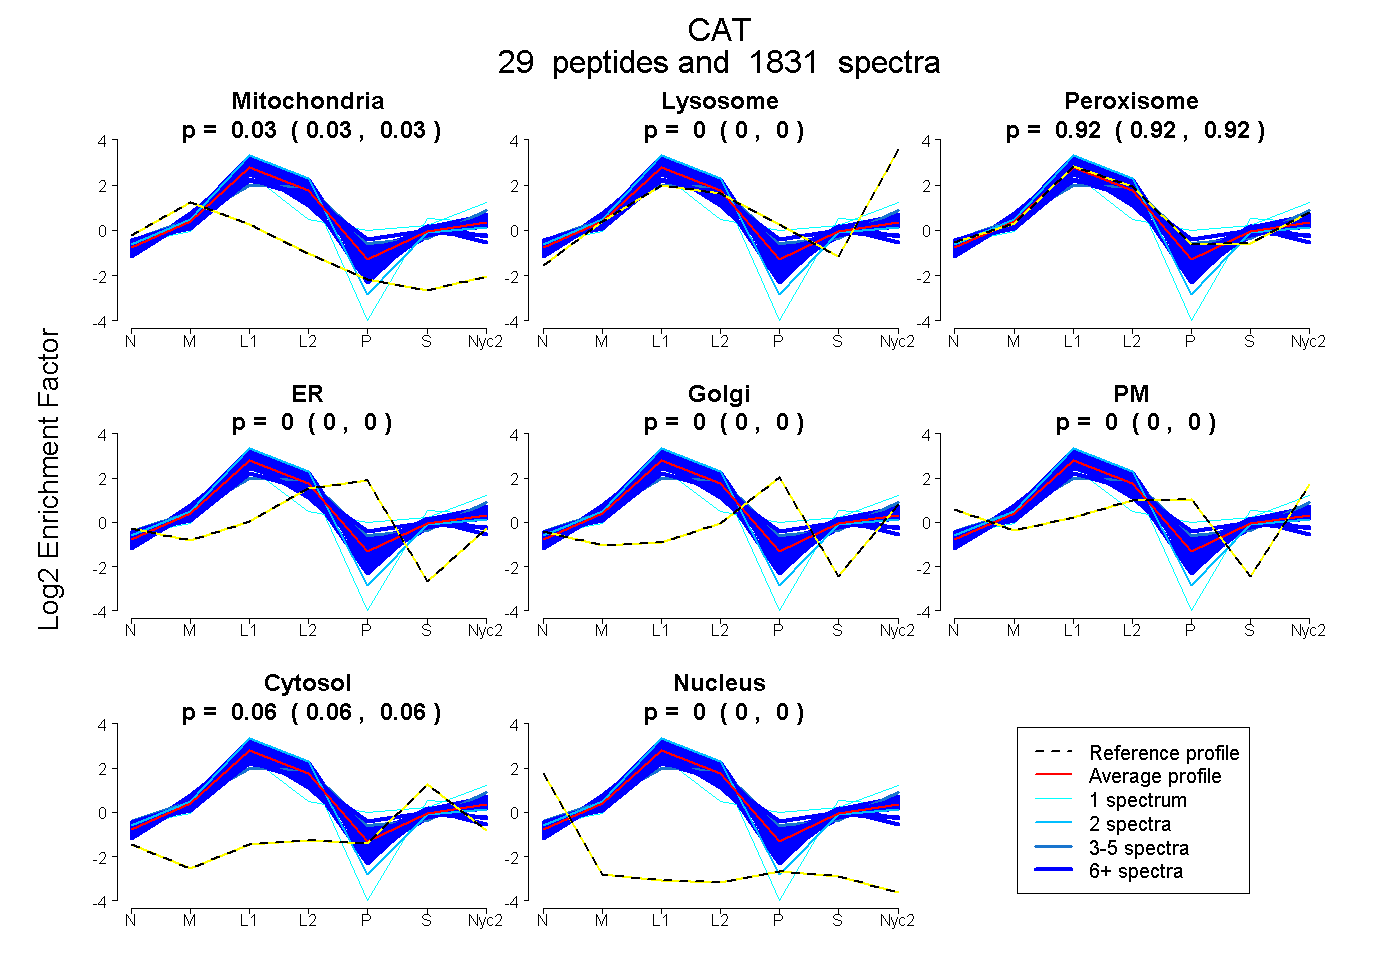
0.025 | 0.026
0.000 | 0.000
0.918 | 0.918
0.000 | 0.000
0.000 | 0.000
0.000 | 0.000
0.056 | 0.057
0.000 | 0.000
28peptides
spectra
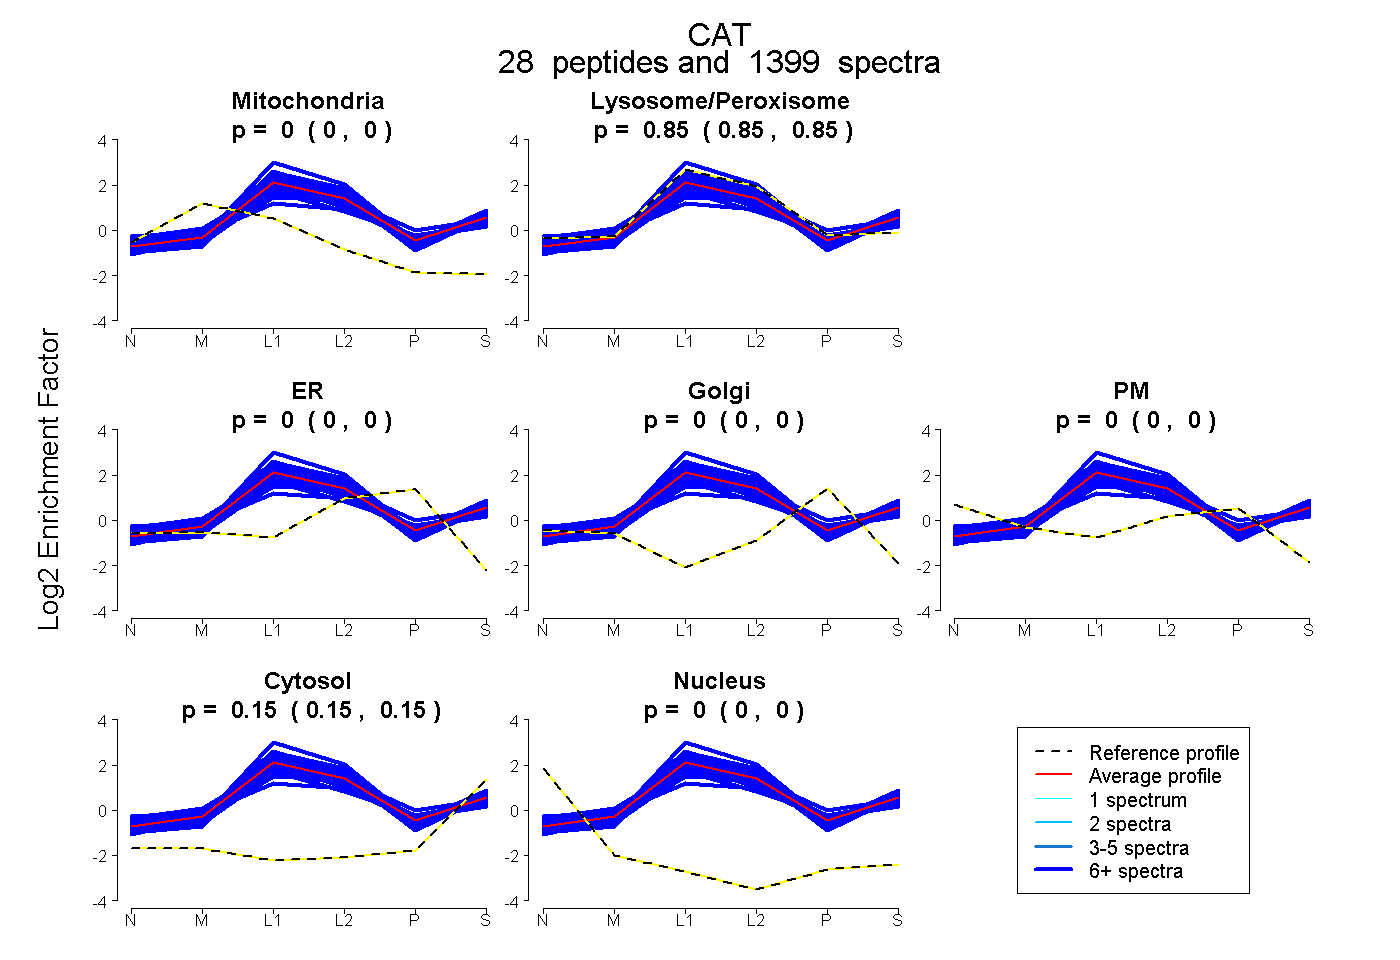
0.000 | 0.000
0.854 | 0.855
0.000 | 0.000
0.000 | 0.000
0.000 | 0.000
0.145 | 0.146
0.000 | 0.000
28peptides
spectra
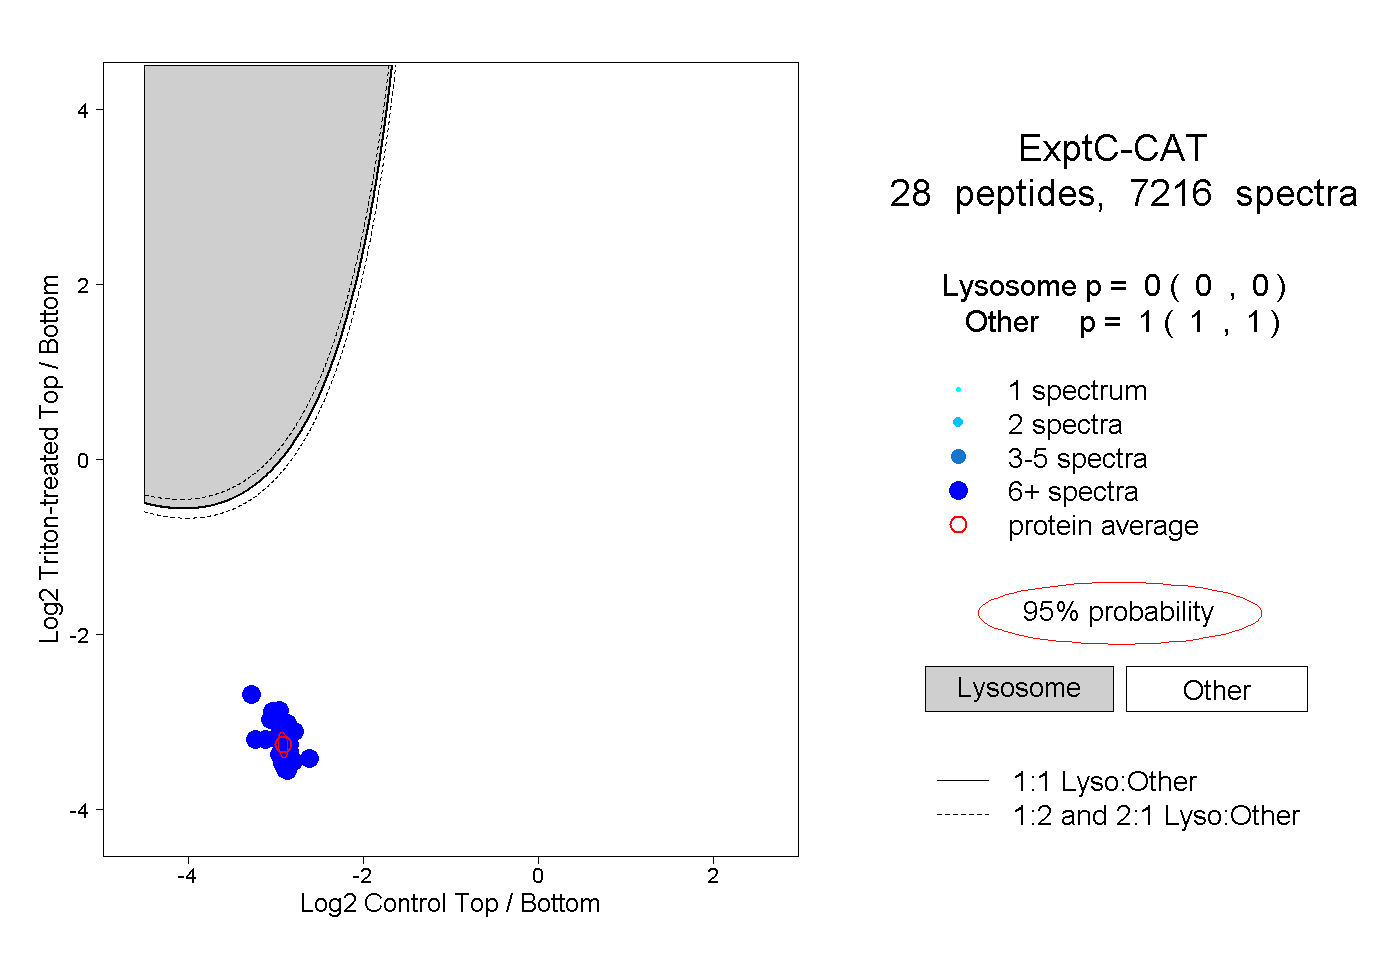
0.000 | 0.000
1.000 | 1.000
27peptides
spectra
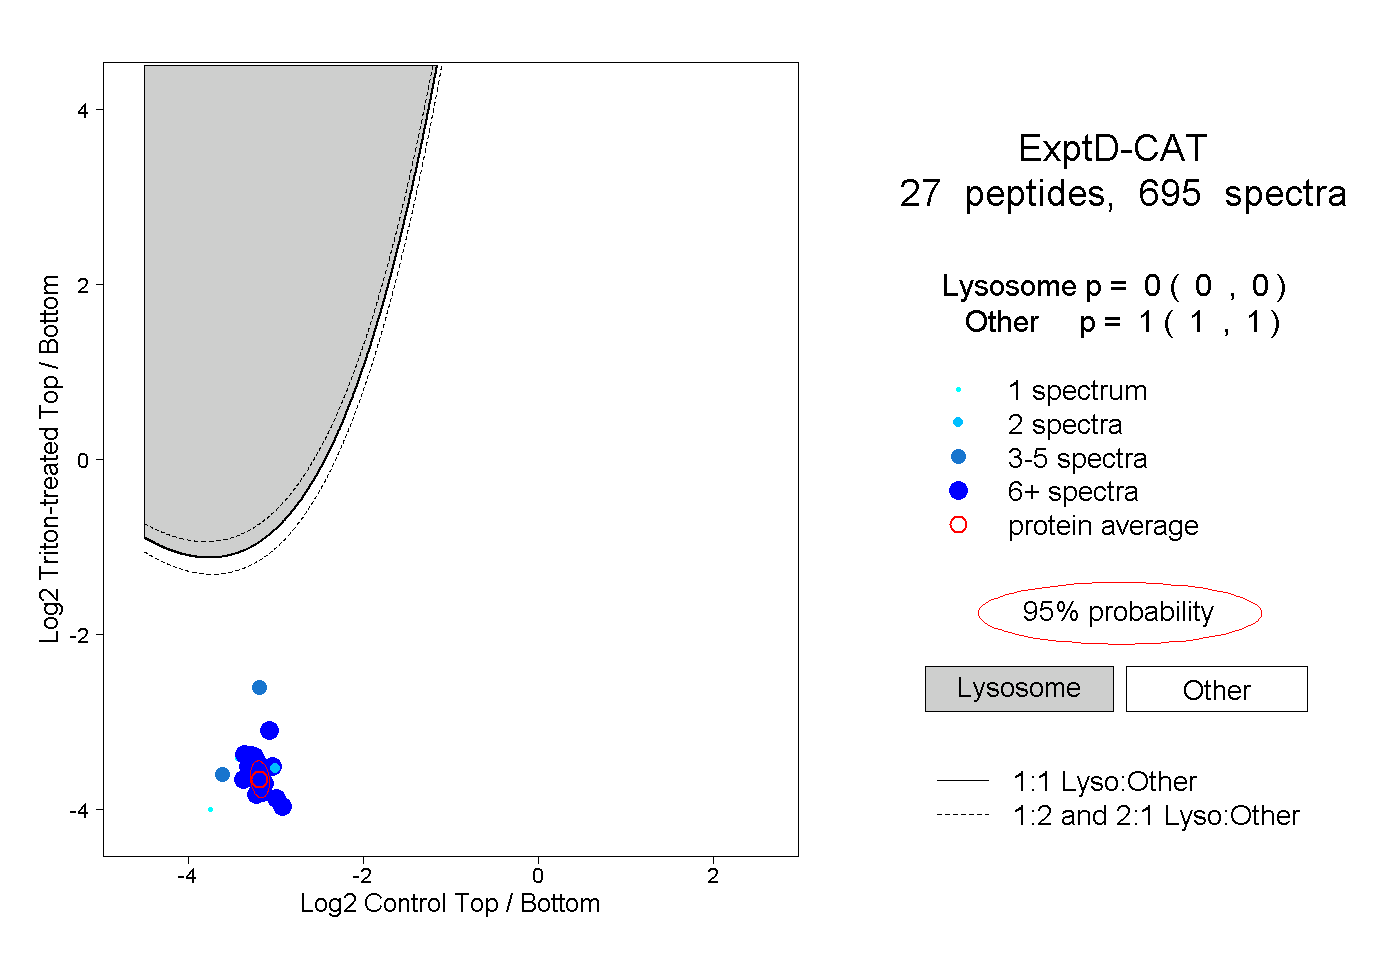
0.000 | 0.000
1.000 | 1.000