 29
29peptides
spectra
0.025 | 0.026
0.000 | 0.000
0.918 | 0.918
0.000 | 0.000
0.000 | 0.000
0.000 | 0.000
0.056 | 0.057
0.000 | 0.000
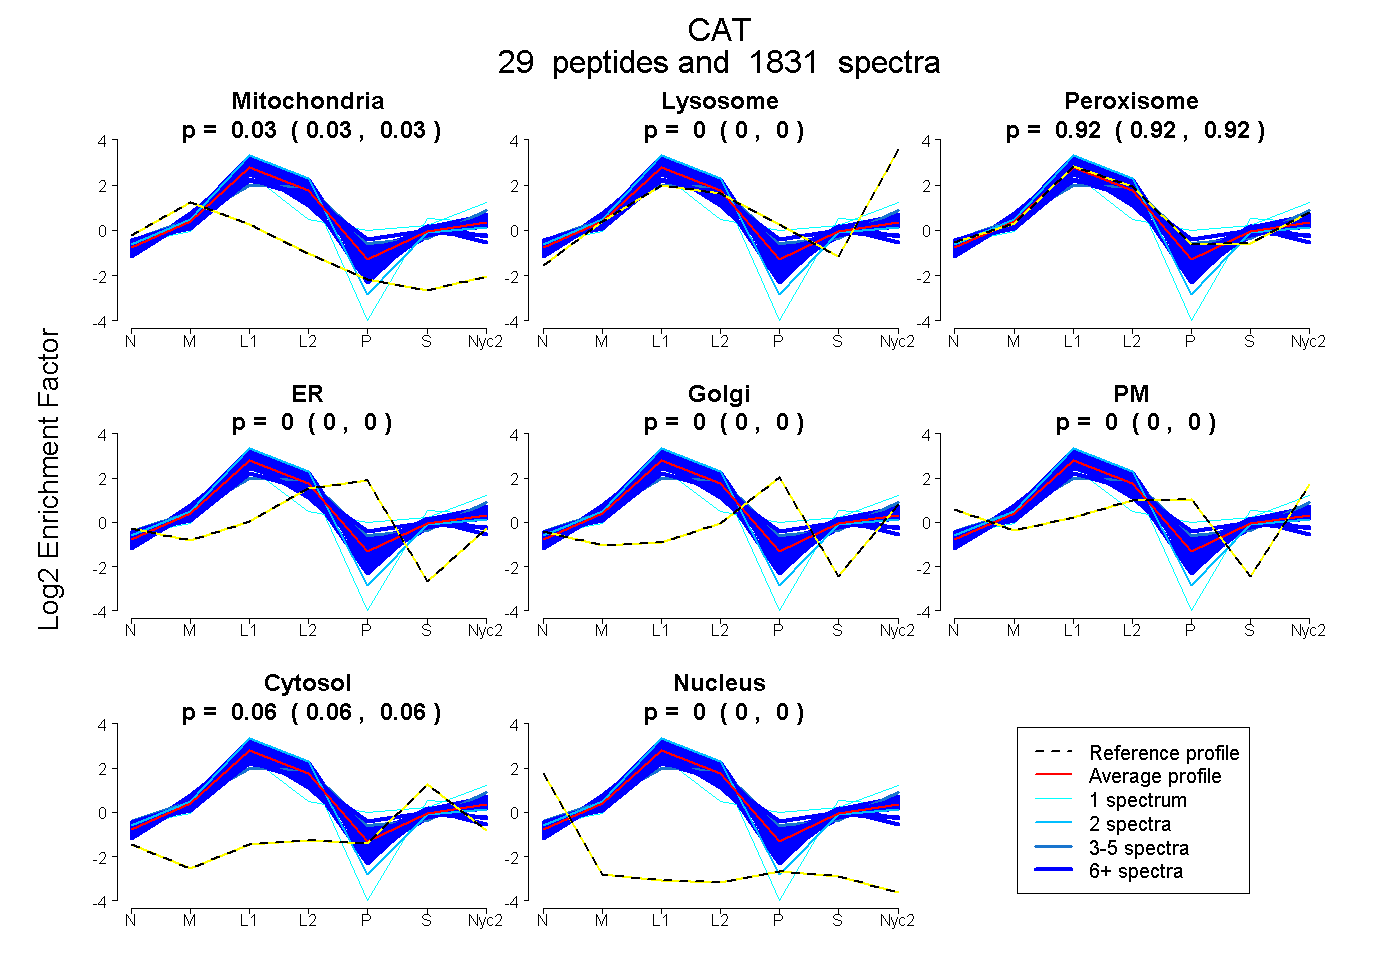
| Plot | Mito | Lyso | Perox | ER | Golgi | PM | Cytosol | Nucleus | |||||
| Expt A |
29 peptides |
1831 spectra |
|
0.026 0.025 | 0.026 |
0.000 0.000 | 0.000 |
0.918 0.918 | 0.918 |
0.000 0.000 | 0.000 |
0.000 0.000 | 0.000 |
0.000 0.000 | 0.000 |
0.056 0.056 | 0.057 |
0.000 0.000 | 0.000 |
| 66 spectra, LCENIANHLK | 0.066 | 0.000 | 0.853 | 0.000 | 0.000 | 0.000 | 0.081 | 0.000 | ||
| 15 spectra, NAIHTYVQAGSHIAAK | 0.080 | 0.000 | 0.792 | 0.000 | 0.000 | 0.000 | 0.128 | 0.000 | ||
| 46 spectra, DAMLFPSFIHSQK | 0.000 | 0.000 | 0.967 | 0.000 | 0.000 | 0.000 | 0.033 | 0.000 | ||
| 12 spectra, DYPLIPVGK | 0.000 | 0.000 | 0.951 | 0.000 | 0.000 | 0.000 | 0.049 | 0.000 | ||
| 16 spectra, DPASDQMK | 0.000 | 0.000 | 0.931 | 0.000 | 0.000 | 0.000 | 0.069 | 0.000 | ||
| 4 spectra, LVNANGEAVYCK | 0.003 | 0.043 | 0.827 | 0.000 | 0.000 | 0.067 | 0.060 | 0.000 | ||
| 12 spectra, HMNGYGSHTFK | 0.018 | 0.000 | 0.918 | 0.000 | 0.000 | 0.000 | 0.065 | 0.000 | ||
| 93 spectra, GAGAFGYFEVTHDITR | 0.037 | 0.000 | 0.912 | 0.000 | 0.000 | 0.000 | 0.051 | 0.000 | ||
| 122 spectra, VANYQR | 0.040 | 0.000 | 0.907 | 0.000 | 0.000 | 0.000 | 0.054 | 0.000 | ||
| 88 spectra, GPLLVQDVVFTDEMAHFDR | 0.032 | 0.000 | 0.879 | 0.000 | 0.000 | 0.000 | 0.089 | 0.000 | ||
| 1 spectrum, FYTEDGNWDLVGNNTPIFFIR | 0.000 | 0.203 | 0.628 | 0.000 | 0.000 | 0.000 | 0.169 | 0.000 | ||
| 1 spectrum, APQKPDVLTTGGGNPIGDK | 0.046 | 0.000 | 0.868 | 0.000 | 0.000 | 0.000 | 0.086 | 0.000 | ||
| 86 spectra, LFAYPDTHR | 0.030 | 0.000 | 0.860 | 0.000 | 0.000 | 0.000 | 0.110 | 0.000 | ||
| 2 spectra, VQALLDQYNSQKPK | 0.071 | 0.000 | 0.929 | 0.000 | 0.000 | 0.000 | 0.000 | 0.000 | ||
| 8 spectra, LGPNYLQIPVNCPYR | 0.086 | 0.000 | 0.914 | 0.000 | 0.000 | 0.000 | 0.000 | 0.000 | ||
| 75 spectra, TPIAVR | 0.041 | 0.000 | 0.941 | 0.000 | 0.000 | 0.000 | 0.018 | 0.000 | ||
| 70 spectra, GIPDGHR | 0.042 | 0.000 | 0.864 | 0.000 | 0.000 | 0.000 | 0.094 | 0.000 | ||
| 39 spectra, VFEHIGK | 0.012 | 0.000 | 0.959 | 0.000 | 0.000 | 0.000 | 0.029 | 0.000 | ||
| 48 spectra, FSTVAGESGSADTVR | 0.069 | 0.000 | 0.931 | 0.000 | 0.000 | 0.000 | 0.000 | 0.000 | ||
| 40 spectra, NPQTHLK | 0.007 | 0.000 | 0.955 | 0.000 | 0.000 | 0.000 | 0.038 | 0.000 | ||
| 117 spectra, LAQEDPDYGLR | 0.038 | 0.000 | 0.919 | 0.000 | 0.000 | 0.000 | 0.043 | 0.000 | ||
| 69 spectra, FNSANEDNVTQVR | 0.023 | 0.000 | 0.977 | 0.000 | 0.000 | 0.000 | 0.000 | 0.000 | ||
| 29 spectra, TDQGIK | 0.025 | 0.000 | 0.969 | 0.000 | 0.000 | 0.000 | 0.005 | 0.000 | ||
| 261 spectra, VLNEEER | 0.005 | 0.000 | 0.957 | 0.000 | 0.000 | 0.000 | 0.038 | 0.000 | ||
| 111 spectra, NFTDVHPDYGAR | 0.000 | 0.000 | 0.849 | 0.018 | 0.000 | 0.000 | 0.134 | 0.000 | ||
| 101 spectra, NLPVEEAGR | 0.002 | 0.000 | 0.943 | 0.000 | 0.000 | 0.000 | 0.056 | 0.000 | ||
| 175 spectra, LNIMTAGPR | 0.000 | 0.000 | 0.937 | 0.000 | 0.000 | 0.000 | 0.063 | 0.000 | ||
| 22 spectra, EAETFPFNPFDLTK | 0.074 | 0.000 | 0.831 | 0.000 | 0.000 | 0.000 | 0.095 | 0.000 | ||
| 102 spectra, DAQLFIQR | 0.006 | 0.000 | 0.931 | 0.000 | 0.000 | 0.000 | 0.064 | 0.000 |
| Plot | Mito | Lyso or Perox | ER | Golgi | PM | Cytosol | Nucleus | ||||||
| Expt B |
28 peptides |
1399 spectra |
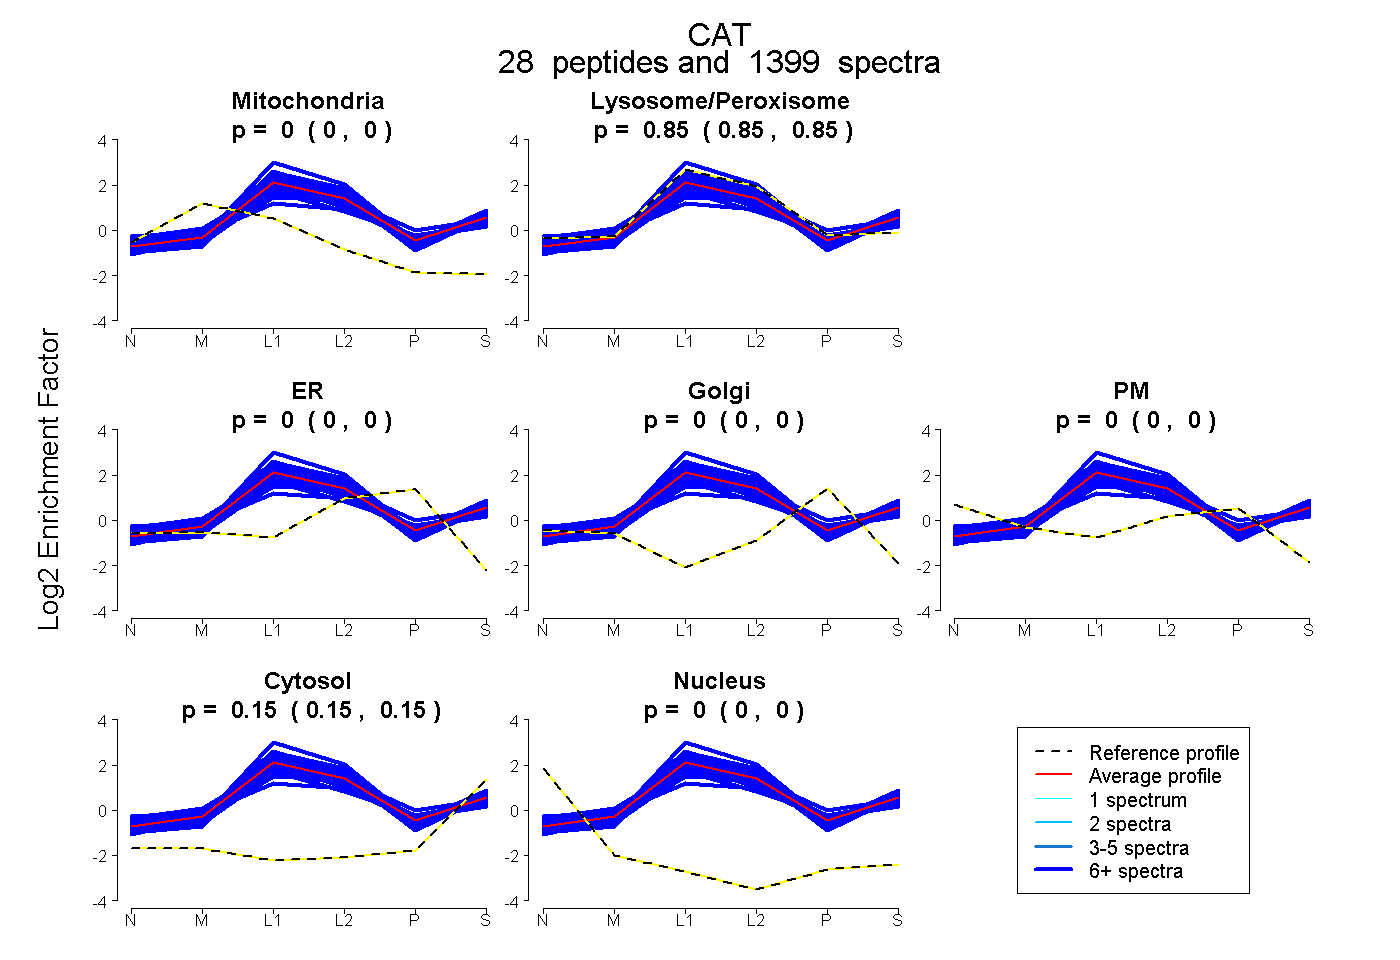 |
0.000 0.000 | 0.000 |
0.854 0.854 | 0.855 |
0.000 0.000 | 0.000 |
0.000 0.000 | 0.000 |
0.000 0.000 | 0.000 |
0.146 0.145 | 0.146 |
0.000 0.000 | 0.000 |
|||
| Plot | Lyso | Other | |||||||||||
| Expt C |
28 peptides |
7216 spectra |
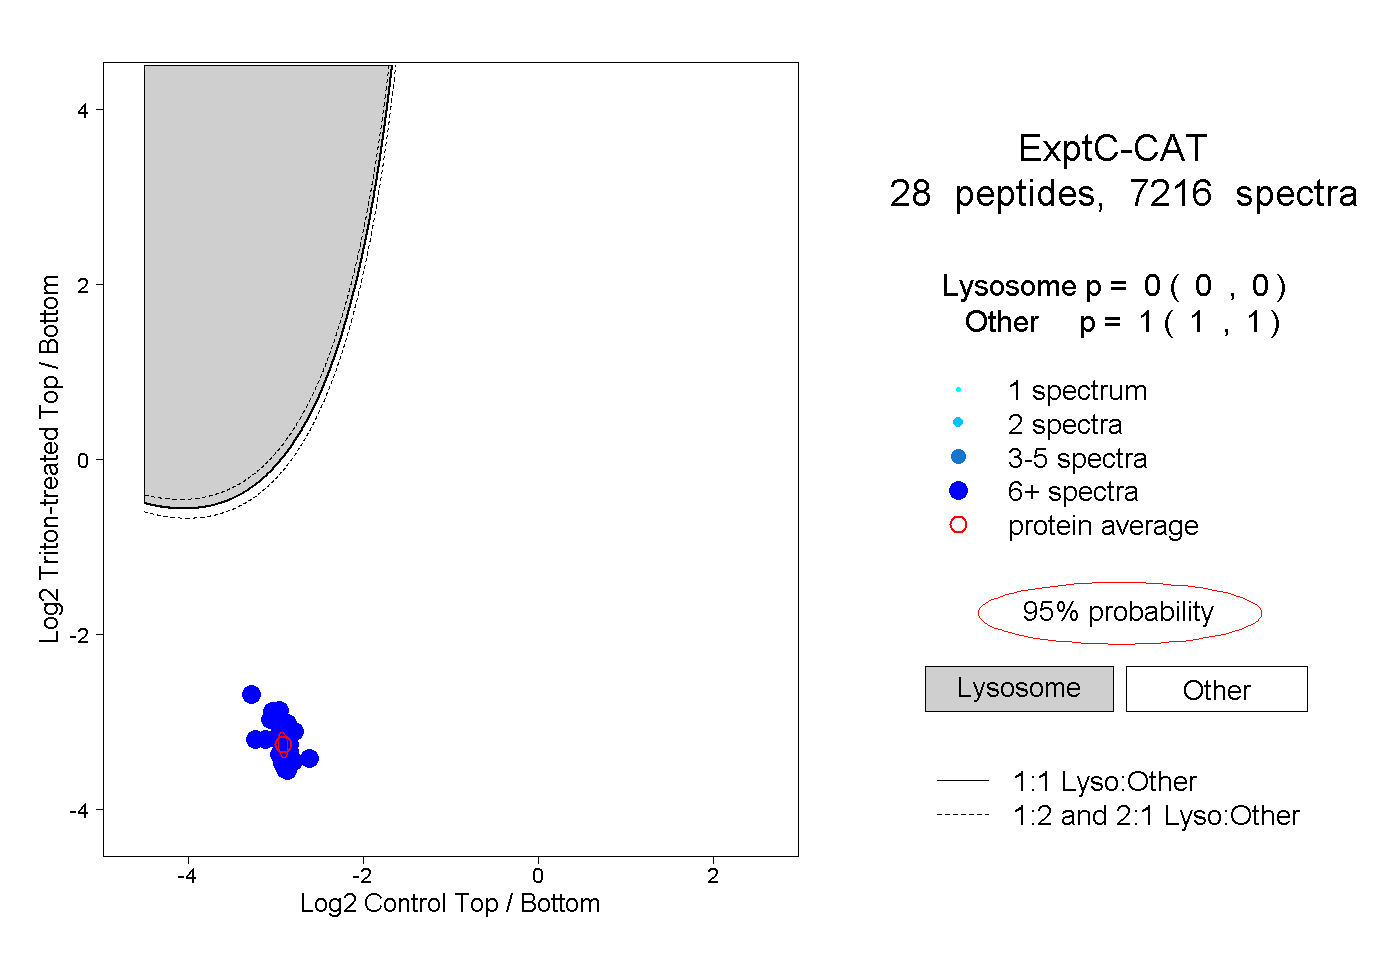 |
0.000 0.000 | 0.000 |
1.000 1.000 | 1.000 |
||||||||
| Plot | Lyso | Other | |||||||||||
| Expt D |
27 peptides |
695 spectra |
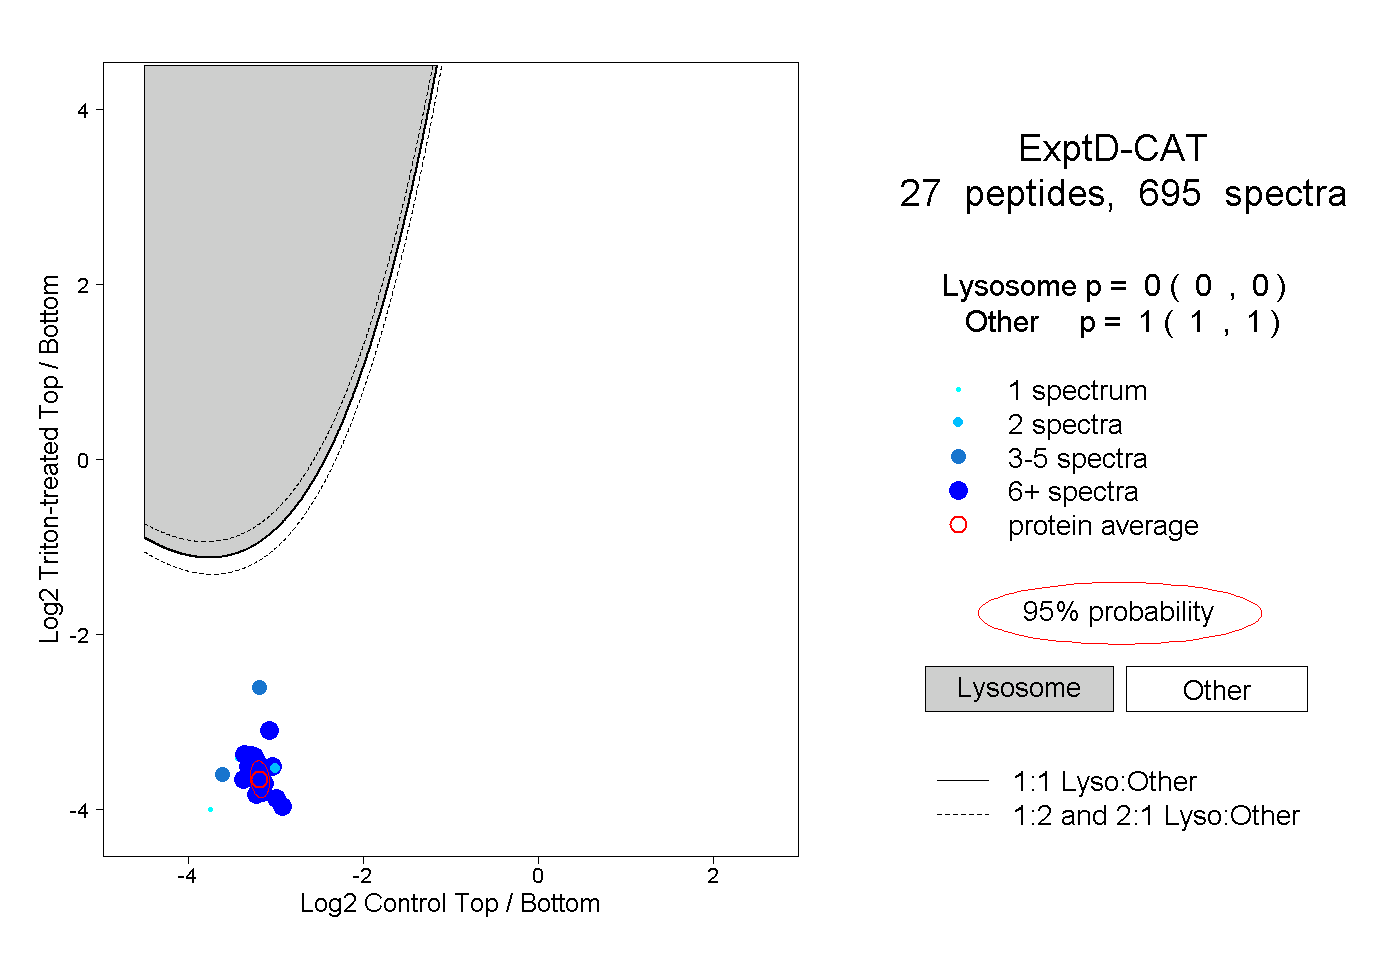 |
0.000 0.000 | 0.000 |
1.000 1.000 | 1.000 |