 12
12peptides
spectra
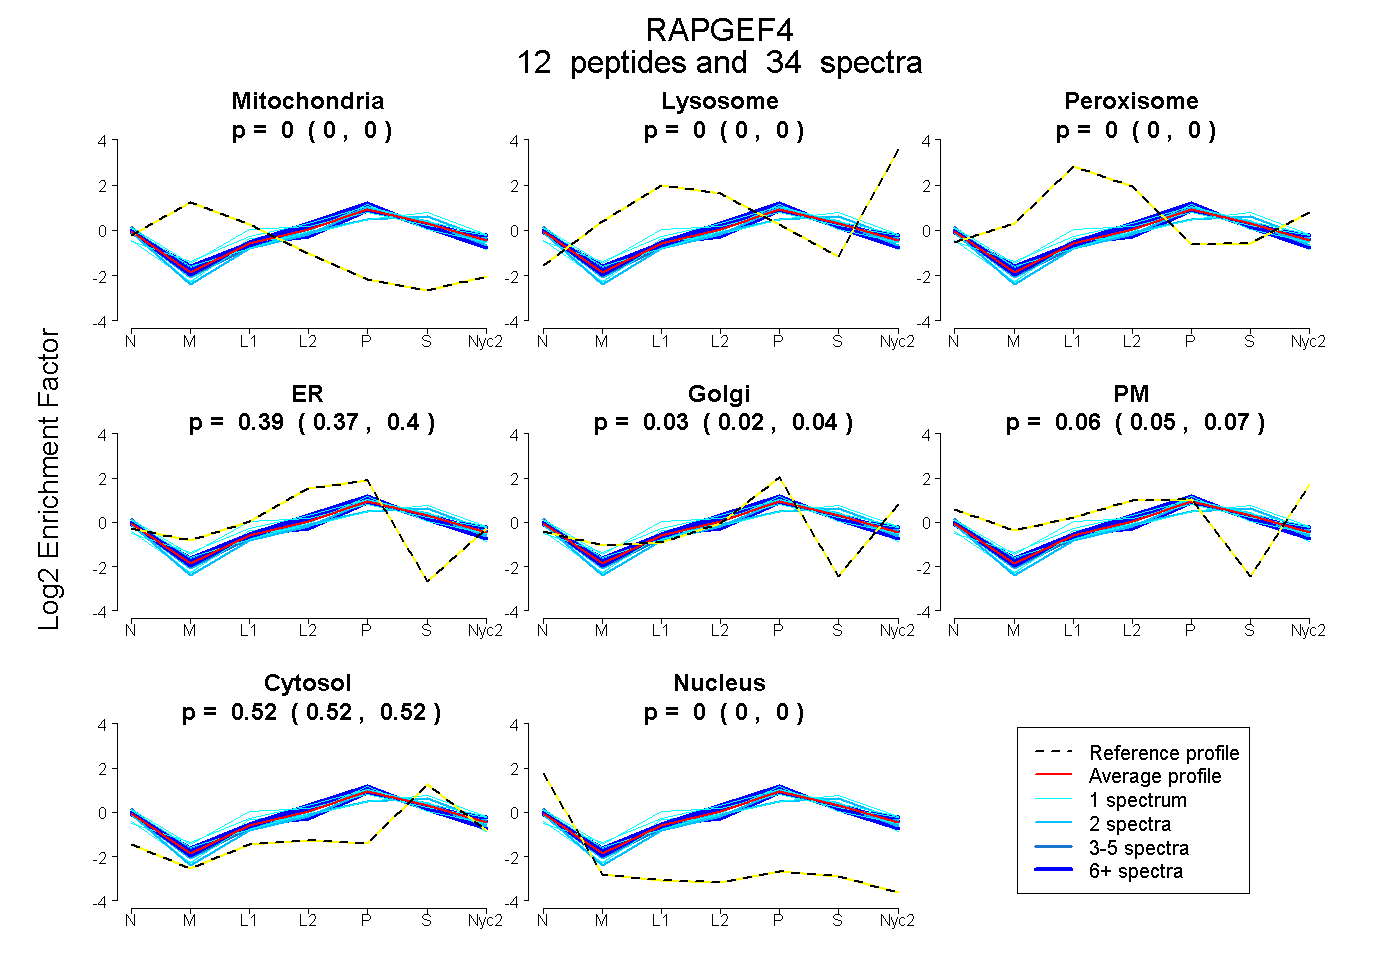
0.000 | 0.000
0.000 | 0.000
0.000 | 0.000
0.373 | 0.399
0.018 | 0.041
0.051 | 0.073
0.515 | 0.523
0.000 | 0.000
3peptides
spectra
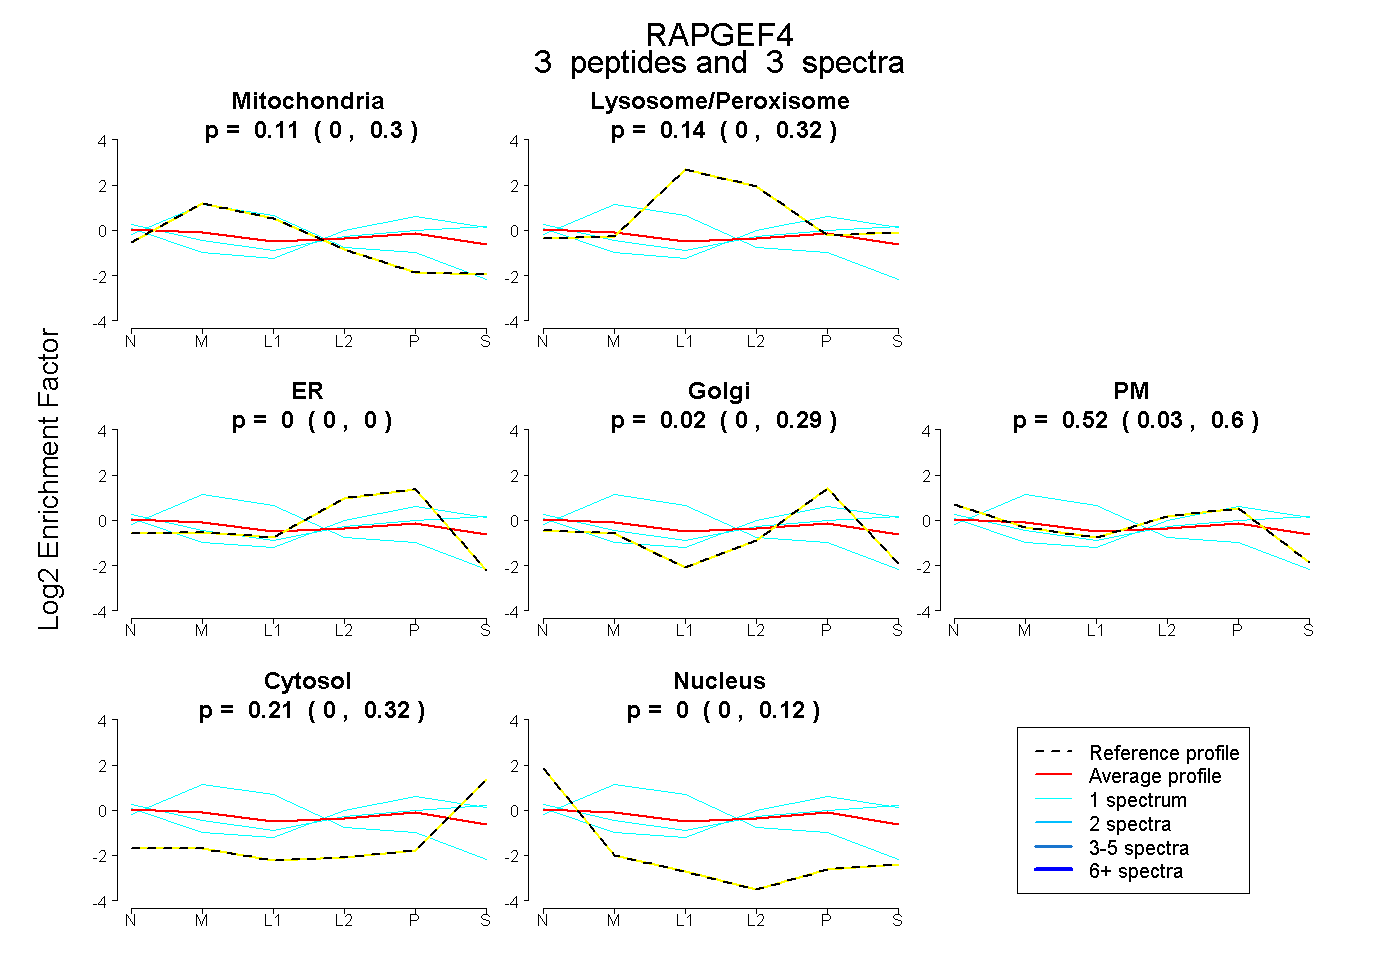
0.000 | 0.296
0.000 | 0.319
0.000 | 0.000
0.000 | 0.291
0.031 | 0.597
0.000 | 0.320
0.000 | 0.120
10peptides
spectra
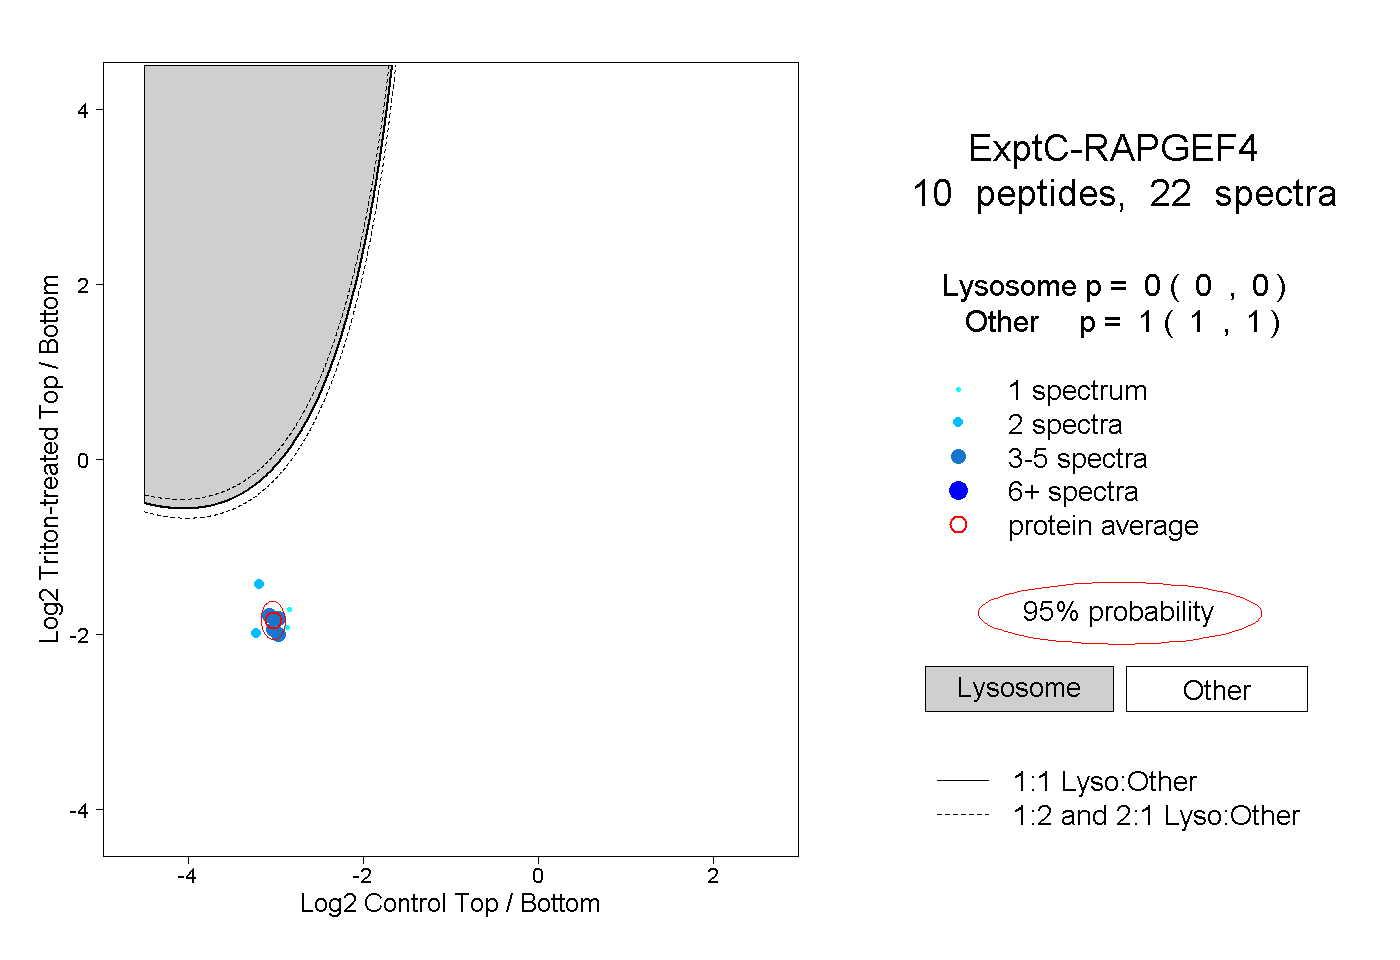
0.000 | 0.000
1.000 | 1.000