RAPGEF4
[ENSRNOP00000010630]
Main page
| | | Plot |
Mito |
Lyso |
|
Perox |
ER |
Golgi |
PM |
Cytosol |
Nucleus |
|
| Expt A |
 12
12
peptides |
34
spectra |
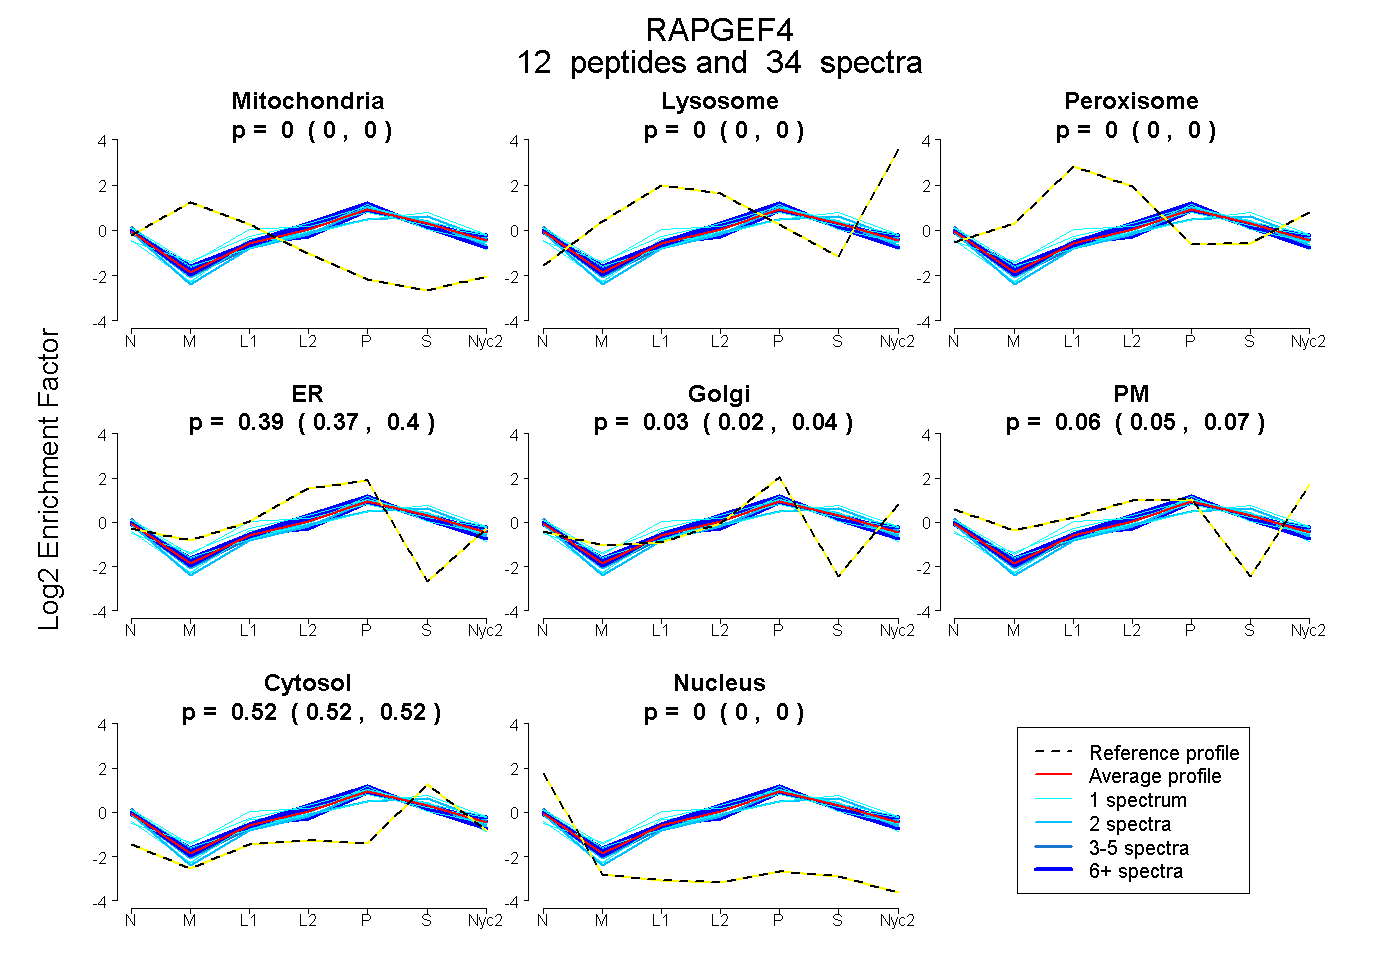 |
0.000
0.000 | 0.000 |
0.000
0.000 | 0.000 |
|
0.000
0.000 | 0.000 |
0.387
0.373 | 0.399 |
0.030
0.018 | 0.041 |
0.063
0.051 | 0.073 |
0.519
0.515 | 0.523 |
0.000
0.000 | 0.000 |
|
| | | Plot |
Mito |
|
Lyso or Perox |
|
ER |
Golgi |
PM |
Cytosol |
Nucleus |
|
| Expt B |
3
peptides |
3
spectra |
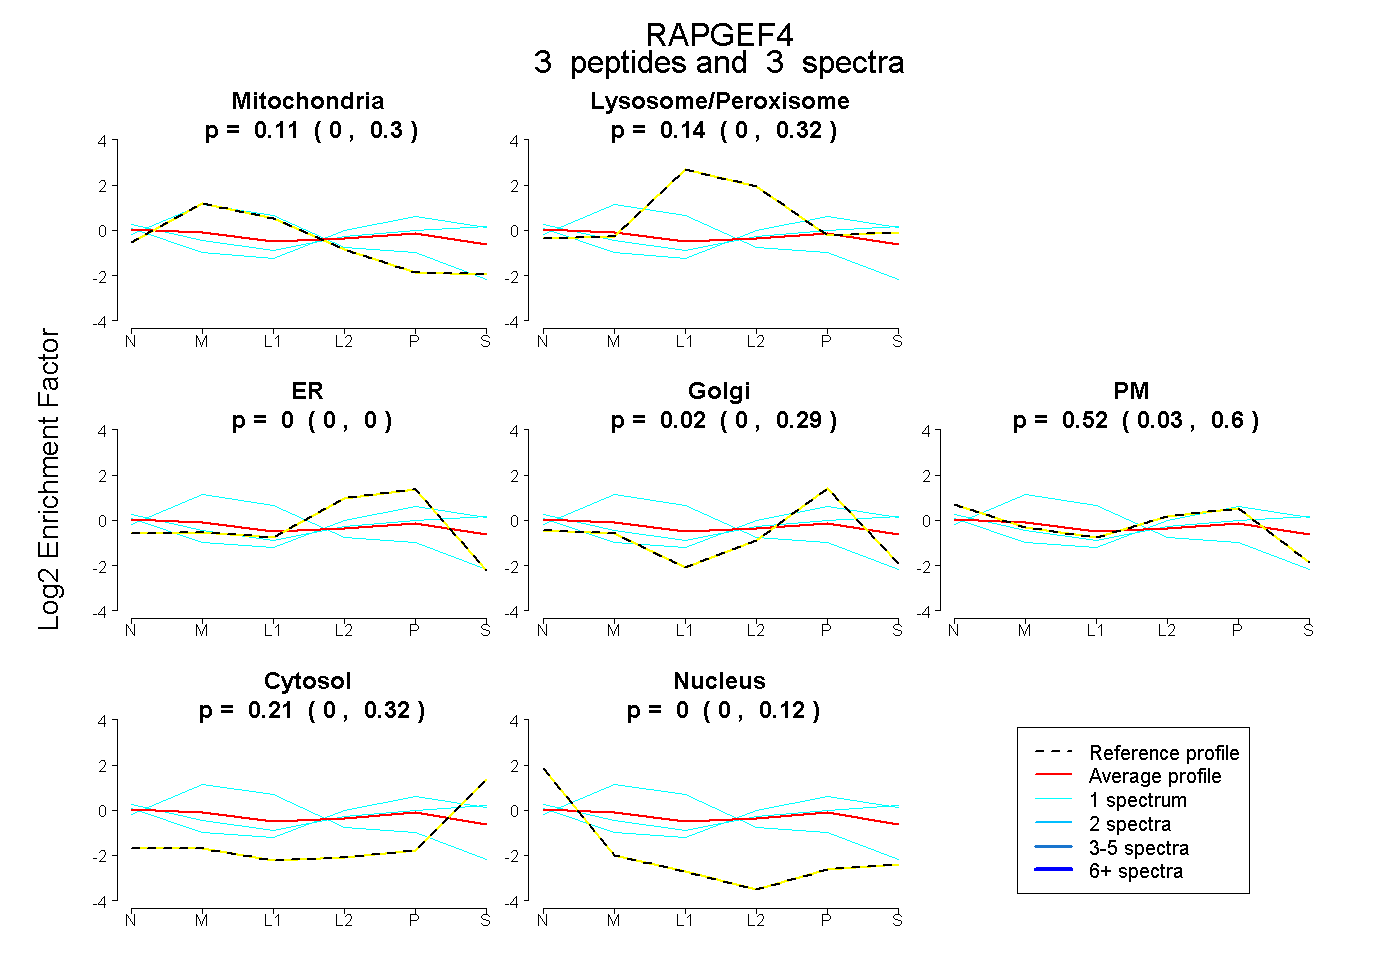 |
0.107
0.000 | 0.296 |
|
0.141
0.000 | 0.319 |
|
0.000
0.000 | 0.000 |
0.022
0.000 | 0.291 |
0.516
0.031 | 0.597 |
0.215
0.000 | 0.320 |
0.000
0.000 | 0.120 |
|
| | | Plot |
|
Lyso |
|
|
|
|
|
|
|
Other |
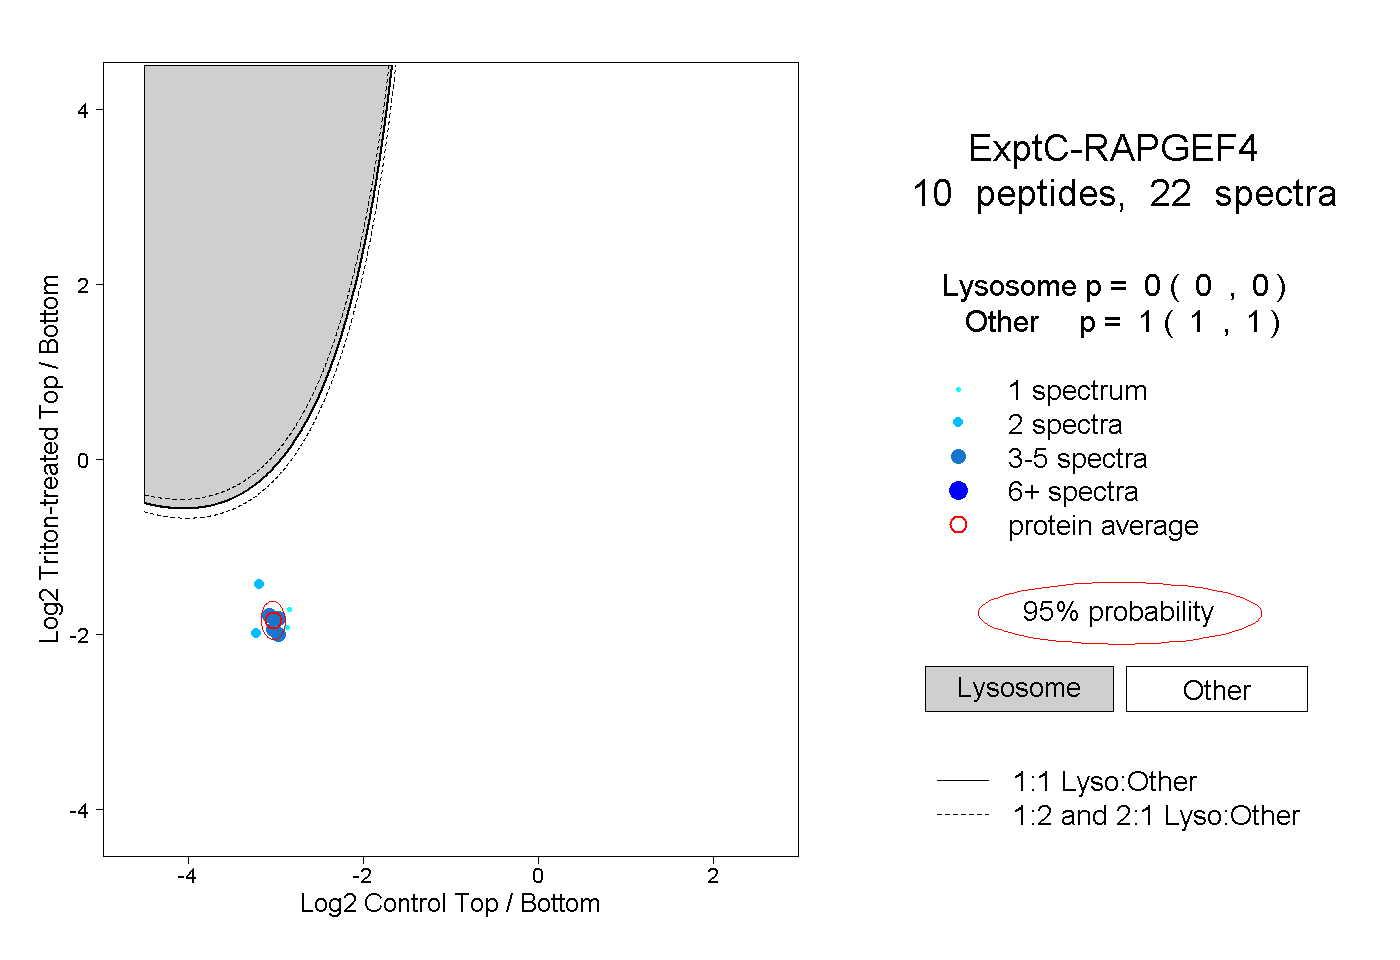
| Expt C |
10
peptides |
22
spectra |
 |
|
0.000
0.000 | 0.000 |
|
|
|
|
|
|
|
1.000
1.000 | 1.000 |
| 1 spectrum, YTVMSGTPEK |
|
0.000 |
|
|
|
|
|
|
|
1.000 |
| 2 spectra, VPAGNR |
|
0.000 |
|
|
|
|
|
|
|
1.000 |
| 1 spectrum, TFLDNLVNFEK |
|
0.000 |
|
|
|
|
|
|
|
1.000 |
| 4 spectra, VPVAASVK |
|
0.000 |
|
|
|
|
|
|
|
1.000 |
| 3 spectra, ILEHFLETIR |
|
0.000 |
|
|
|
|
|
|
|
1.000 |
| 1 spectrum, GSDEVLFK |
|
0.000 |
|
|
|
|
|
|
|
1.000 |
| 4 spectra, QLNVIDNQR |
|
0.000 |
|
|
|
|
|
|
|
1.000 |
| 3 spectra, DVEANTVR |
|
0.000 |
|
|
|
|
|
|
|
1.000 |
| 1 spectrum, ASNQGNSQPQQK |
|
0.000 |
|
|
|
|
|
|
|
1.000 |
| 2 spectra, SQPFNPDAAQANK |
|
0.000 |
|
|
|
|
|
|
|
1.000 |