 13
13peptides
spectra
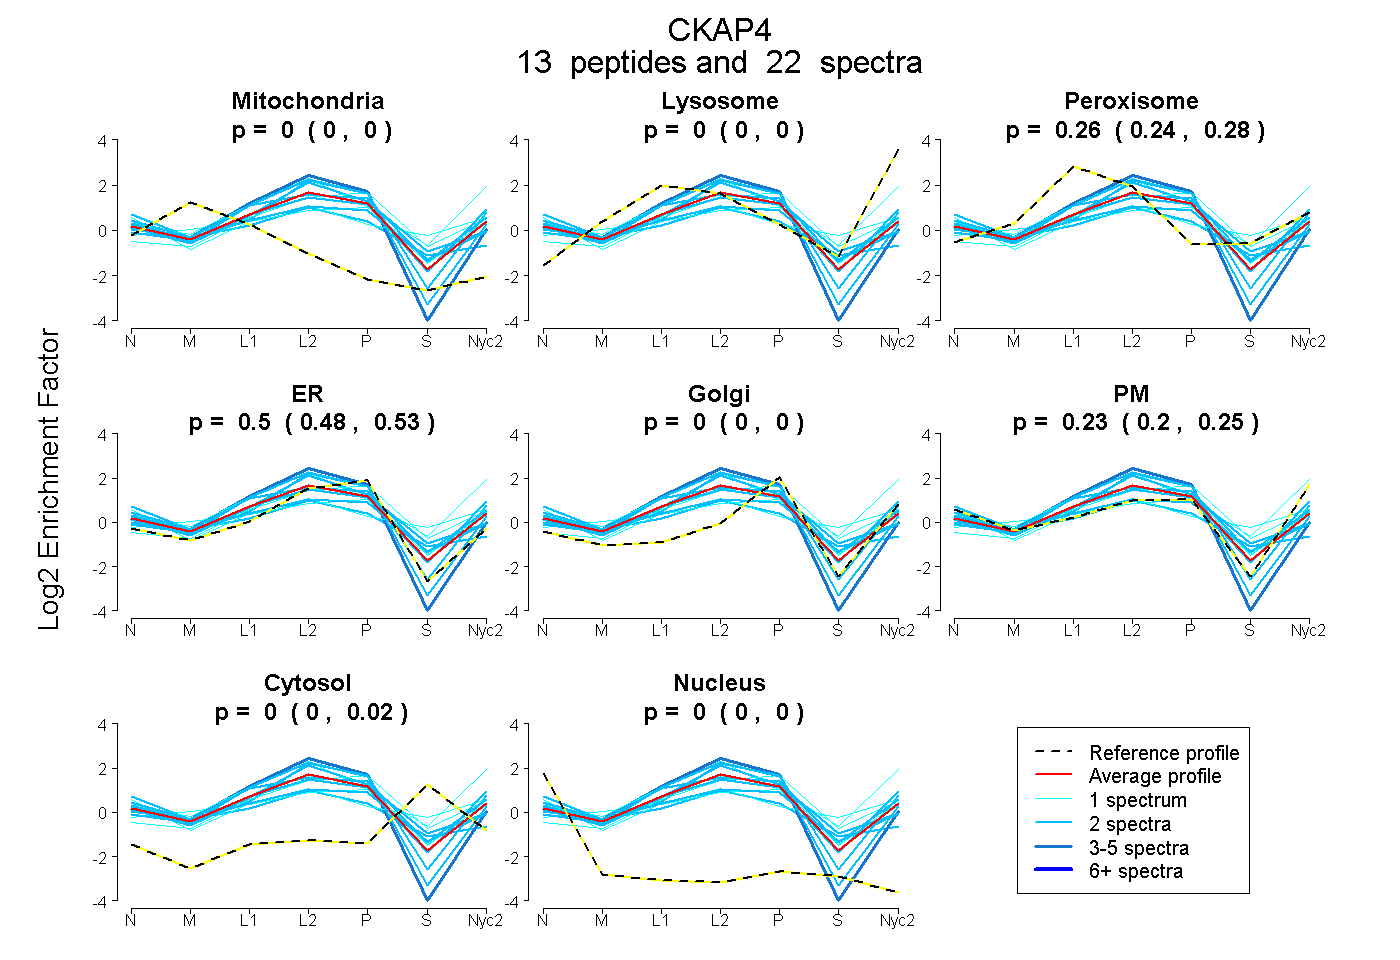
0.000 | 0.000
0.000 | 0.000
0.245 | 0.276
0.475 | 0.526
0.000 | 0.000
0.201 | 0.253
0.000 | 0.016
0.000 | 0.000
5peptides
spectra
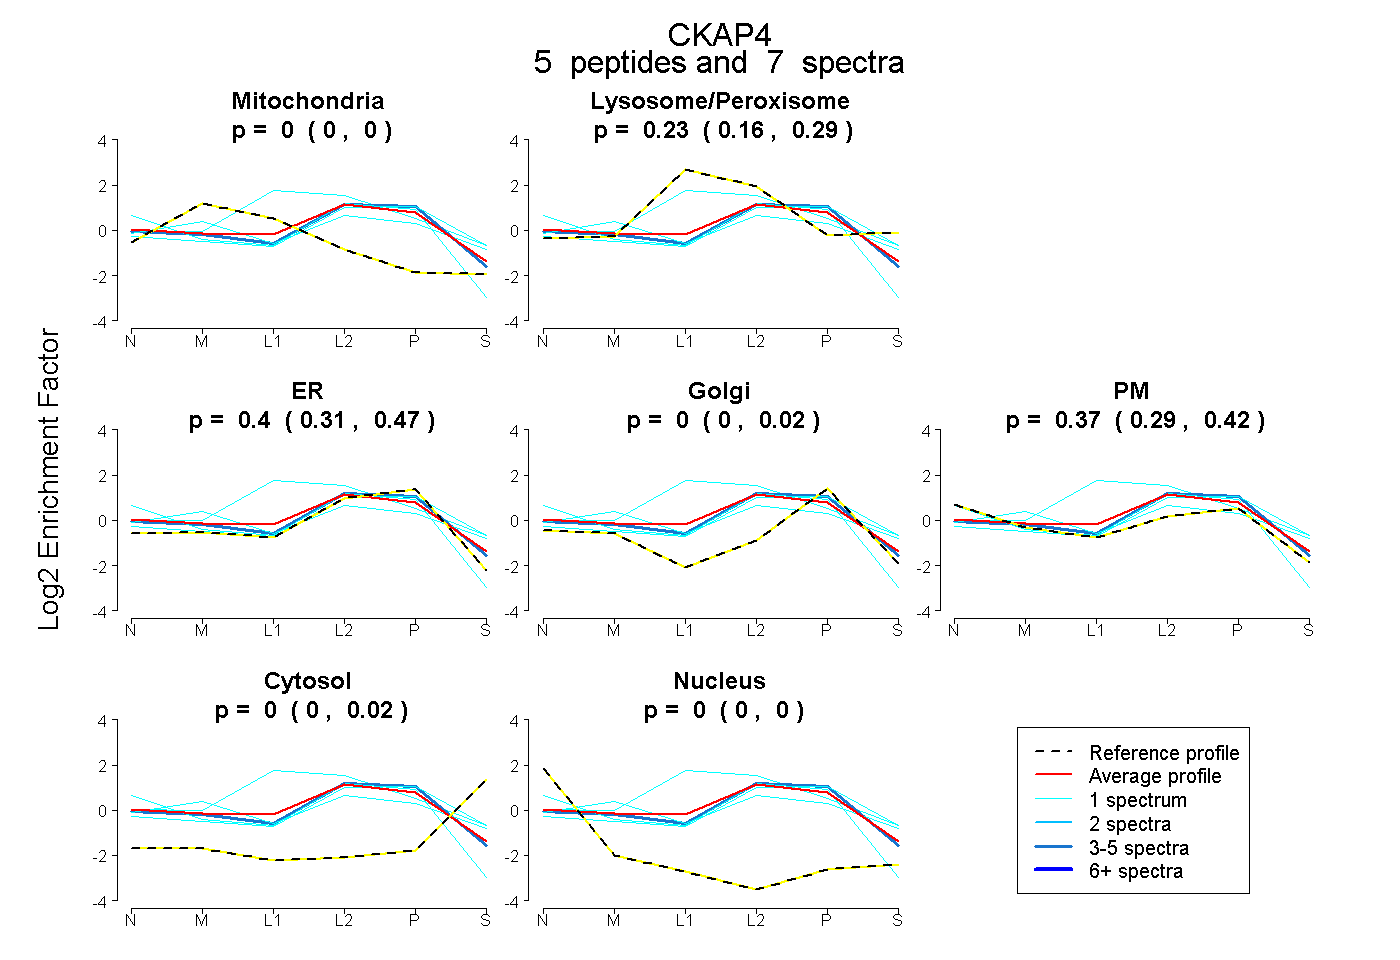
0.000 | 0.000
0.160 | 0.295
0.311 | 0.467
0.000 | 0.015
0.292 | 0.422
0.000 | 0.025
0.000 | 0.000
9peptides
spectra
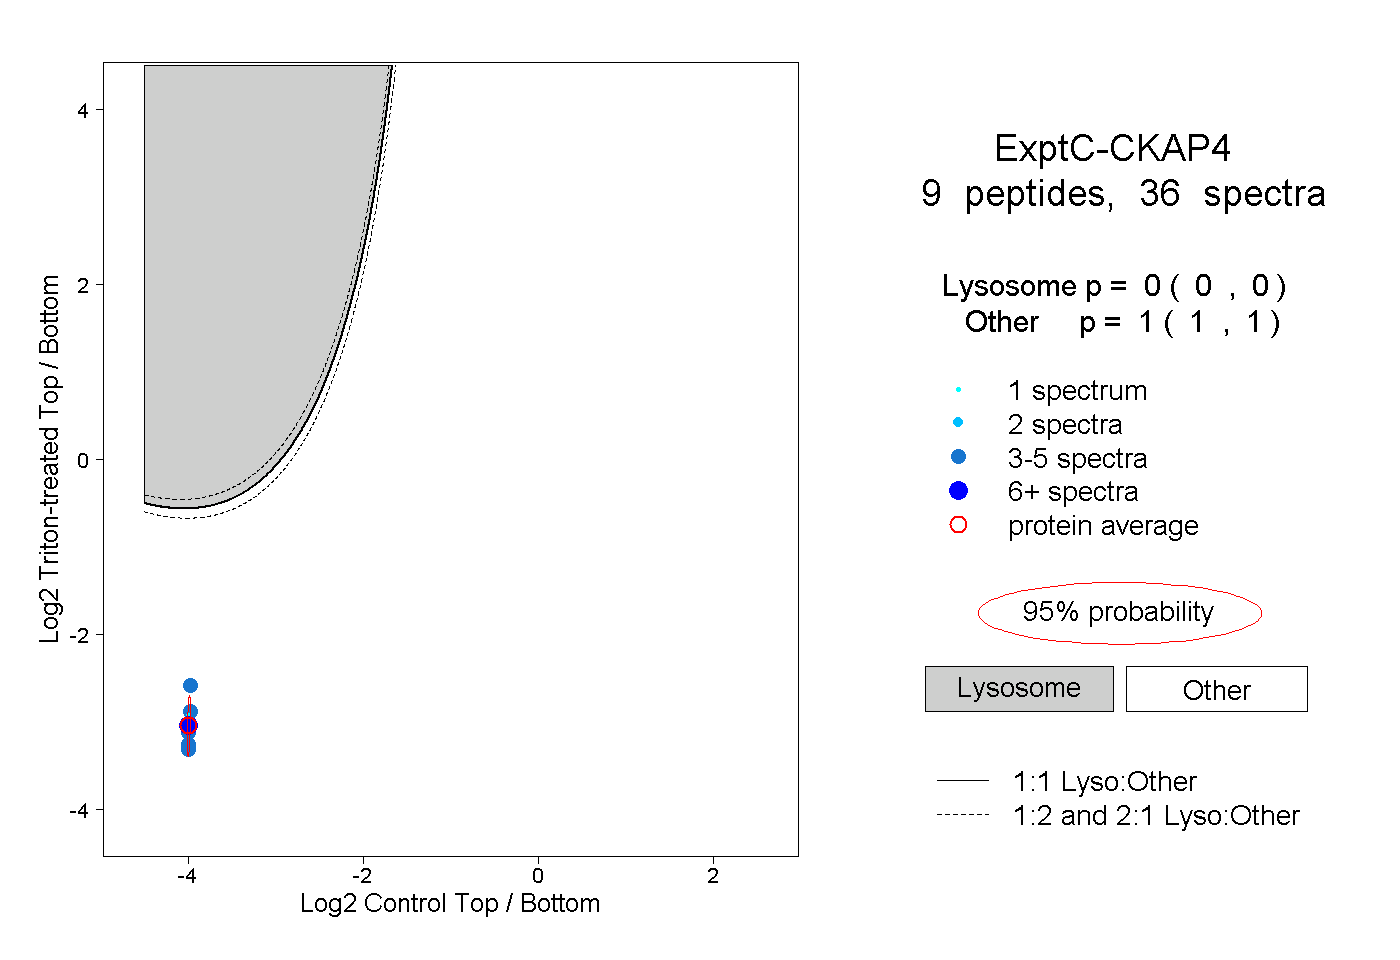
0.000 | 0.000
1.000 | 1.000
3peptides
spectra
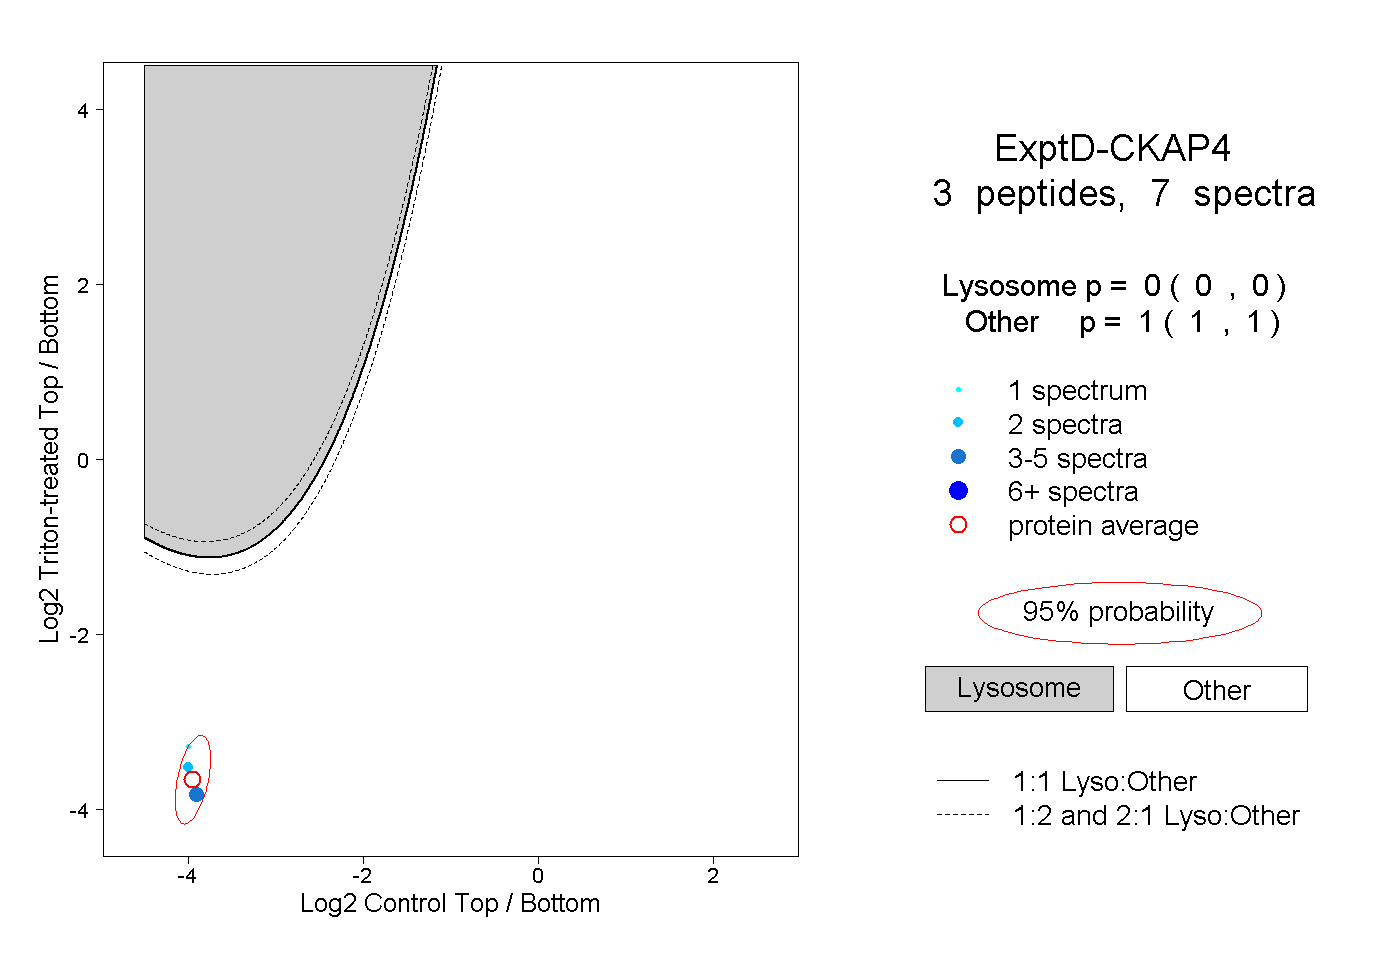
0.000 | 0.000
1.000 | 1.000