 13
13peptides
spectra
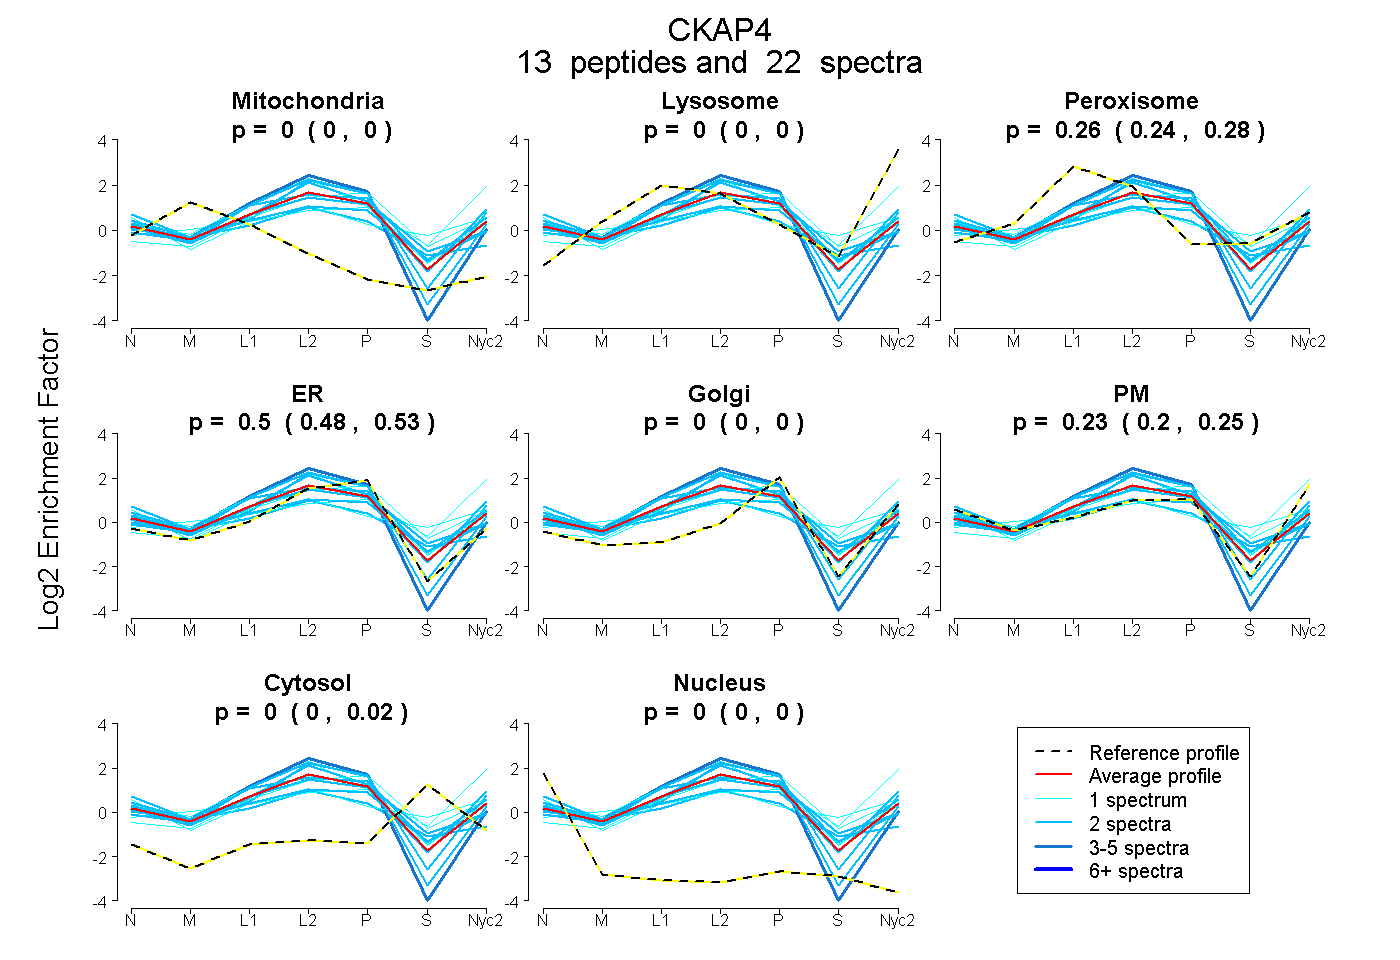
0.000 | 0.000
0.000 | 0.000
0.245 | 0.276
0.475 | 0.526
0.000 | 0.000
0.201 | 0.253
0.000 | 0.016
0.000 | 0.000
| Plot | Mito | Lyso | Perox | ER | Golgi | PM | Cytosol | Nucleus | |||||
| Expt A |
13 peptides |
22 spectra |
|
0.000 0.000 | 0.000 |
0.000 0.000 | 0.000 |
0.262 0.245 | 0.276 |
0.504 0.475 | 0.526 |
0.000 0.000 | 0.000 |
0.229 0.201 | 0.253 |
0.005 0.000 | 0.016 |
0.000 0.000 | 0.000 |
| 2 spectra, TAVDSLVAYSVK | 0.000 | 0.000 | 0.265 | 0.398 | 0.000 | 0.208 | 0.066 | 0.063 | ||
| 3 spectra, GLLDDLR | 0.000 | 0.000 | 0.078 | 0.873 | 0.000 | 0.048 | 0.000 | 0.000 | ||
| 2 spectra, SQEYEQR | 0.000 | 0.000 | 0.123 | 0.721 | 0.000 | 0.157 | 0.000 | 0.000 | ||
| 1 spectrum, LAMLQEHVESLGPISDLASTVR | 0.000 | 0.000 | 0.409 | 0.462 | 0.000 | 0.130 | 0.000 | 0.000 | ||
| 1 spectrum, QMEGLGAR | 0.000 | 0.181 | 0.122 | 0.566 | 0.000 | 0.000 | 0.131 | 0.000 | ||
| 2 spectra, SSLQTMESDVYTEVR | 0.000 | 0.000 | 0.215 | 0.289 | 0.000 | 0.495 | 0.001 | 0.000 | ||
| 1 spectrum, EVQASMK | 0.000 | 0.362 | 0.029 | 0.000 | 0.113 | 0.364 | 0.132 | 0.000 | ||
| 1 spectrum, ELVSLK | 0.000 | 0.000 | 0.274 | 0.482 | 0.000 | 0.215 | 0.028 | 0.000 | ||
| 2 spectra, AFDELQK | 0.000 | 0.000 | 0.355 | 0.393 | 0.000 | 0.051 | 0.042 | 0.160 | ||
| 2 spectra, LALQALTEK | 0.000 | 0.164 | 0.001 | 0.692 | 0.000 | 0.143 | 0.000 | 0.000 | ||
| 2 spectra, SSVSQVESDLK | 0.000 | 0.005 | 0.353 | 0.428 | 0.059 | 0.155 | 0.000 | 0.000 | ||
| 1 spectrum, LEEELQQLK | 0.000 | 0.000 | 0.291 | 0.020 | 0.000 | 0.427 | 0.262 | 0.000 | ||
| 2 spectra, LSSLDNLK | 0.000 | 0.000 | 0.335 | 0.607 | 0.000 | 0.000 | 0.058 | 0.000 |
| Plot | Mito | Lyso or Perox | ER | Golgi | PM | Cytosol | Nucleus | ||||||
| Expt B |
5 peptides |
7 spectra |
 |
0.000 0.000 | 0.000 |
0.230 0.160 | 0.295 |
0.397 0.311 | 0.467 |
0.000 0.000 | 0.015 |
0.373 0.292 | 0.422 |
0.000 0.000 | 0.025 |
0.000 0.000 | 0.000 |
|||
| Plot | Lyso | Other | |||||||||||
| Expt C |
9 peptides |
36 spectra |
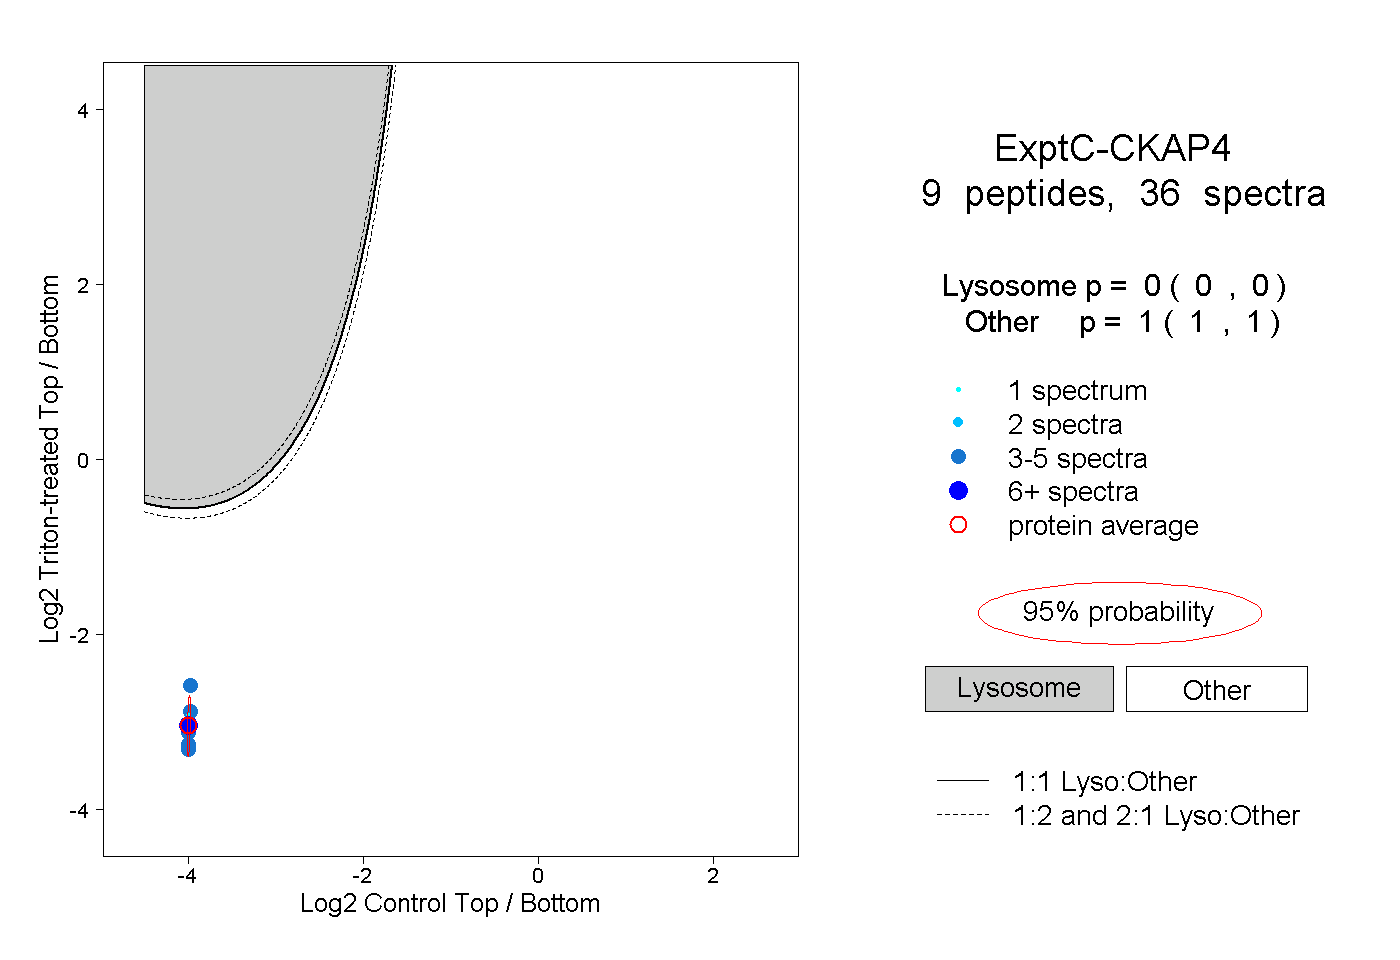 |
0.000 0.000 | 0.000 |
1.000 1.000 | 1.000 |
||||||||
| Plot | Lyso | Other | |||||||||||
| Expt D |
3 peptides |
7 spectra |
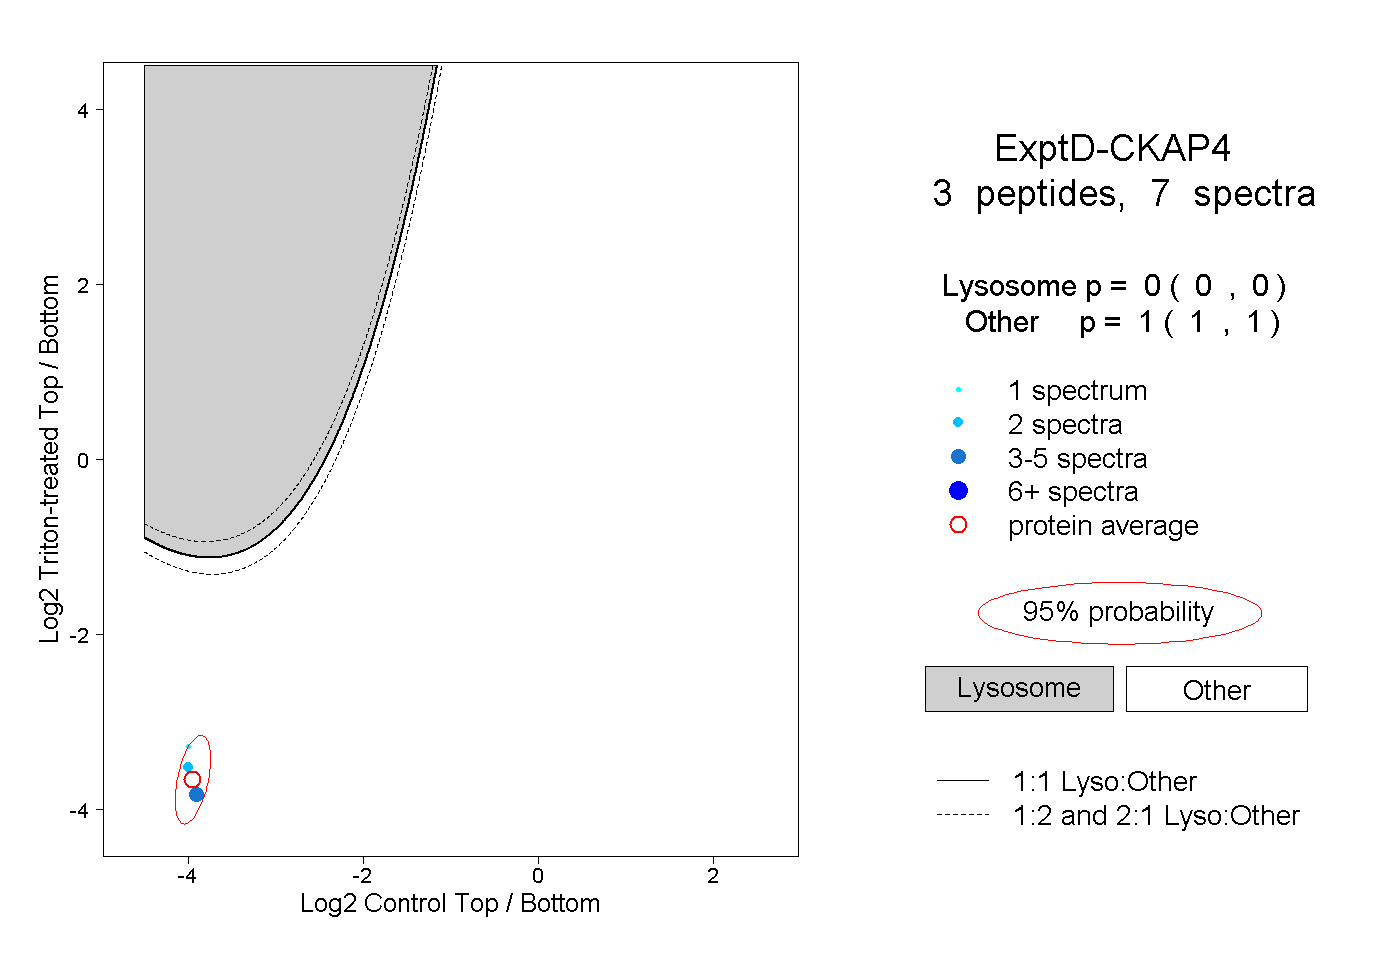 |
0.000 0.000 | 0.000 |
1.000 1.000 | 1.000 |