CKAP4
[ENSRNOP00000010601]
Main page
| | | Plot |
Mito |
Lyso |
|
Perox |
ER |
Golgi |
PM |
Cytosol |
Nucleus |
|
| Expt A |
 13
13
peptides |
22
spectra |
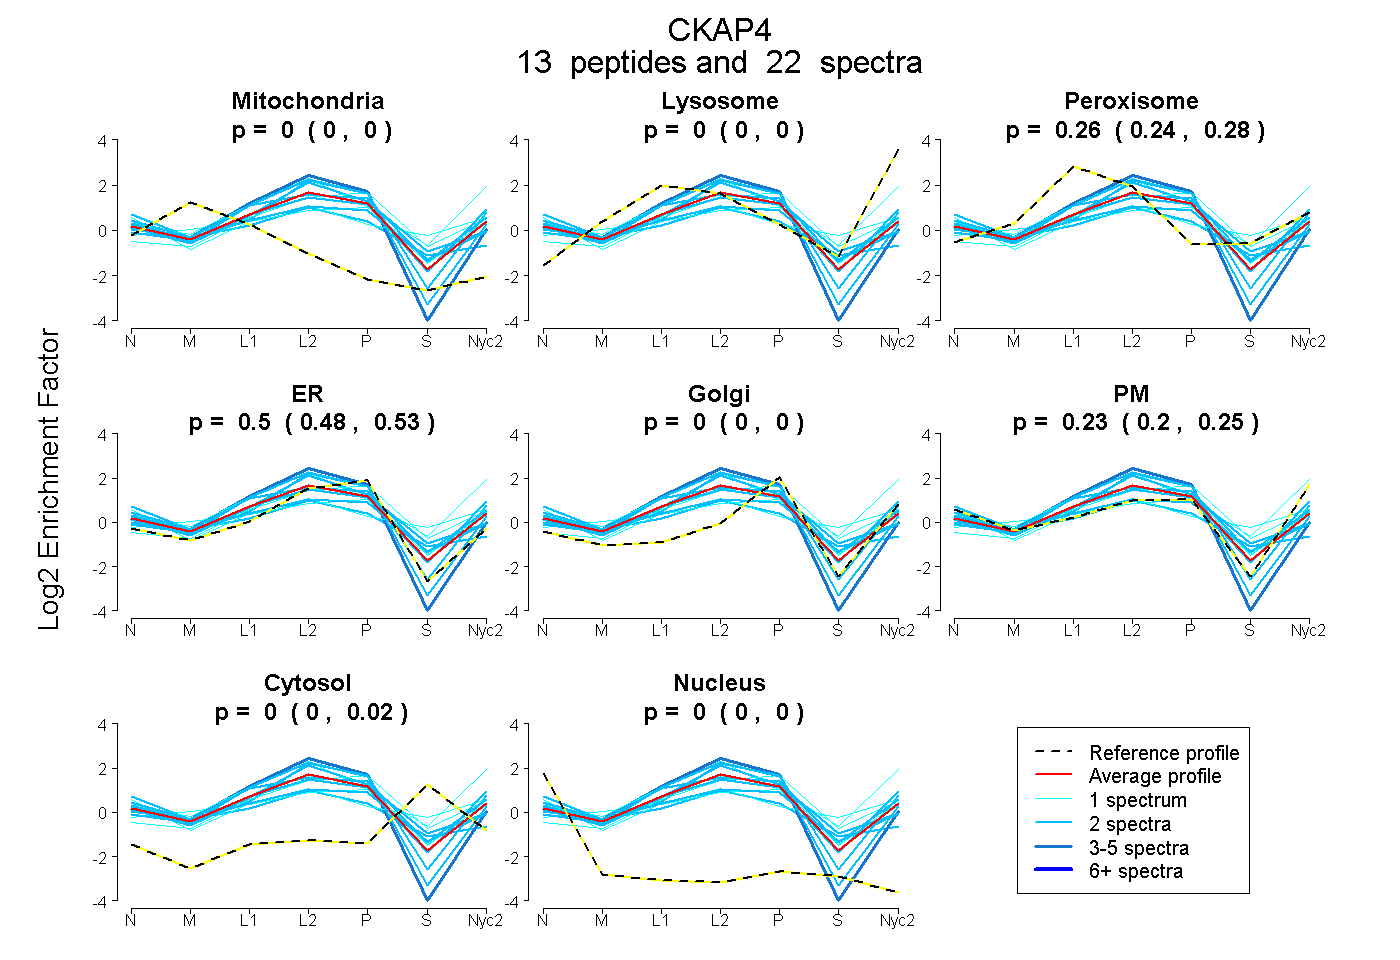 |
0.000
0.000 | 0.000 |
0.000
0.000 | 0.000 |
|
0.262
0.245 | 0.276 |
0.504
0.475 | 0.526 |
0.000
0.000 | 0.000 |
0.229
0.201 | 0.253 |
0.005
0.000 | 0.016 |
0.000
0.000 | 0.000 |
|
| | | Plot |
Mito |
|
Lyso or Perox |
|
ER |
Golgi |
PM |
Cytosol |
Nucleus |
|
| Expt B |
5
peptides |
7
spectra |
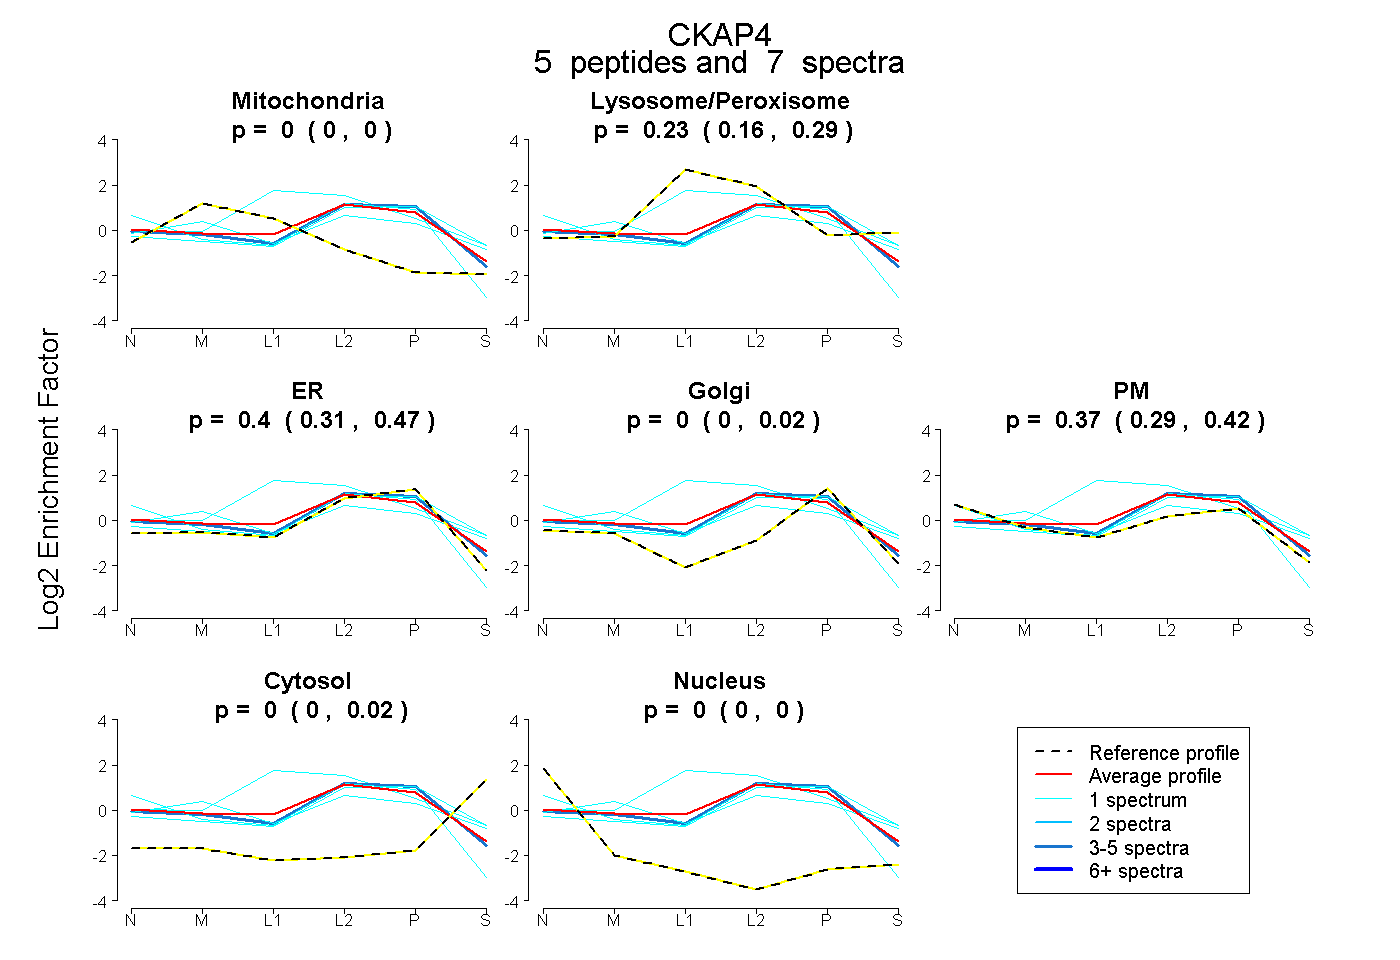 |
0.000
0.000 | 0.000 |
|
0.230
0.160 | 0.295 |
|
0.397
0.311 | 0.467 |
0.000
0.000 | 0.015 |
0.373
0.292 | 0.422 |
0.000
0.000 | 0.025 |
0.000
0.000 | 0.000 |
|
| 1 spectrum, AFDELQK |
0.000 |
|
0.694 |
|
0.144 |
0.000 |
0.162 |
0.000 |
0.000 |
|
| 1 spectrum, SQEYEQR |
0.000 |
|
0.192 |
|
0.555 |
0.074 |
0.060 |
0.119 |
0.000 |
|
| 1 spectrum, LSSLDNLK |
0.075 |
|
0.192 |
|
0.211 |
0.039 |
0.386 |
0.097 |
0.000 |
|
| 1 spectrum, LPEDIR |
0.000 |
|
0.000 |
|
0.506 |
0.000 |
0.494 |
0.000 |
0.000 |
|
| 3 spectra, LLQSEESSSR |
0.000 |
|
0.122 |
|
0.590 |
0.000 |
0.288 |
0.000 |
0.000 |
|
| | | Plot |
|
Lyso |
|
|
|
|
|
|
|
Other |
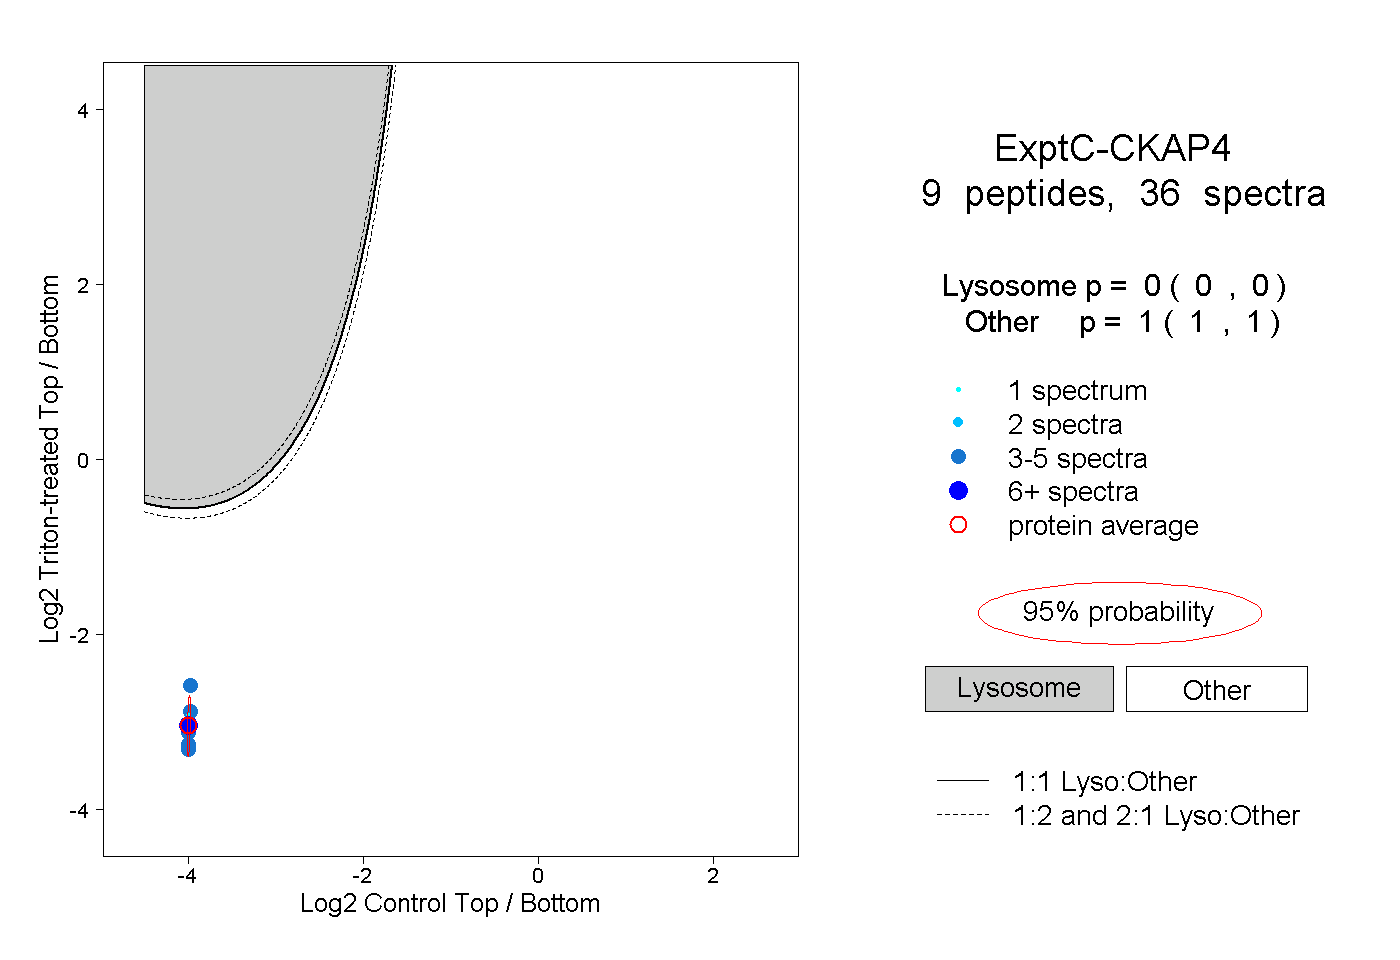
| Expt C |
9
peptides |
36
spectra |
 |
|
0.000
0.000 | 0.000 |
|
|
|
|
|
|
|
1.000
1.000 | 1.000 |
| | | Plot |
|
Lyso |
|
|
|
|
|
|
|
Other |
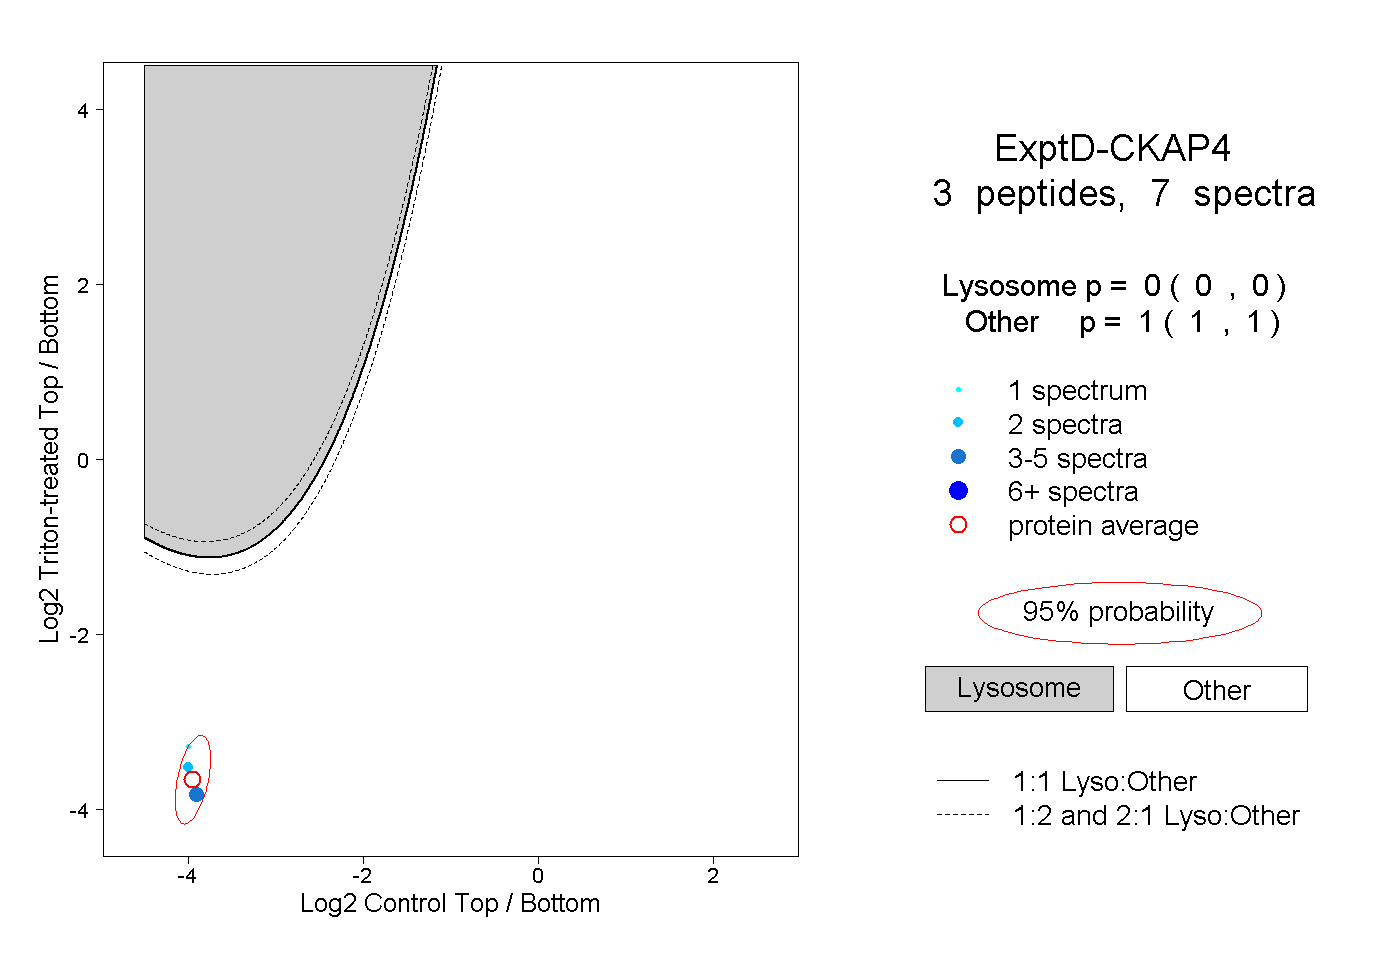
| Expt D |
3
peptides |
7
spectra |
 |
|
0.000
0.000 | 0.000 |
|
|
|
|
|
|
|
1.000
1.000 | 1.000 |