 6
6peptides
spectra
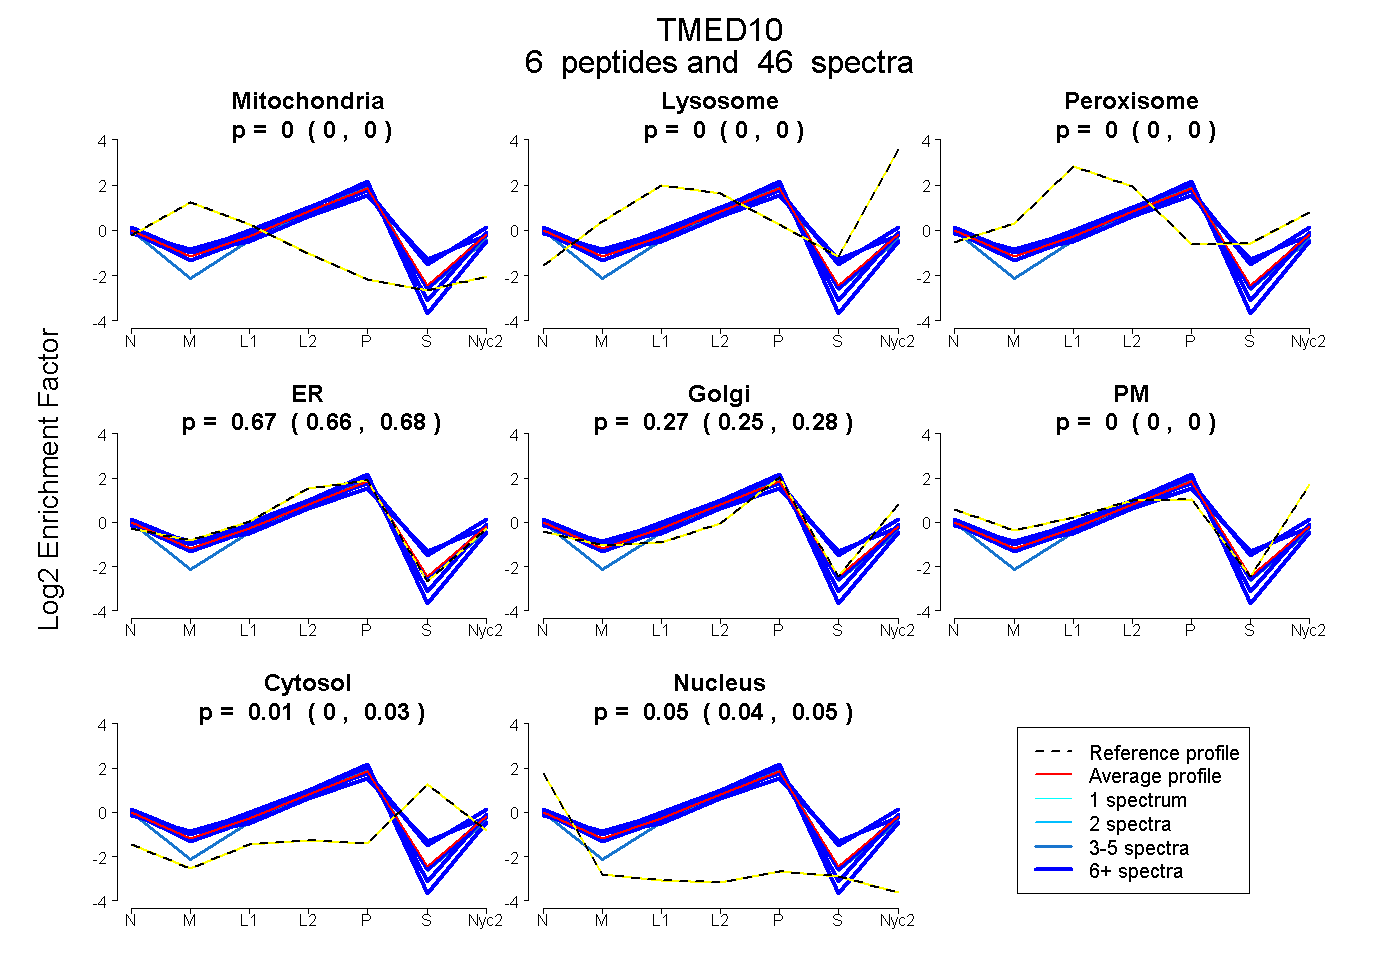
0.000 | 0.000
0.000 | 0.000
0.000 | 0.000
0.663 | 0.683
0.252 | 0.276
0.000 | 0.004
0.000 | 0.026
0.039 | 0.055
5peptides
spectra
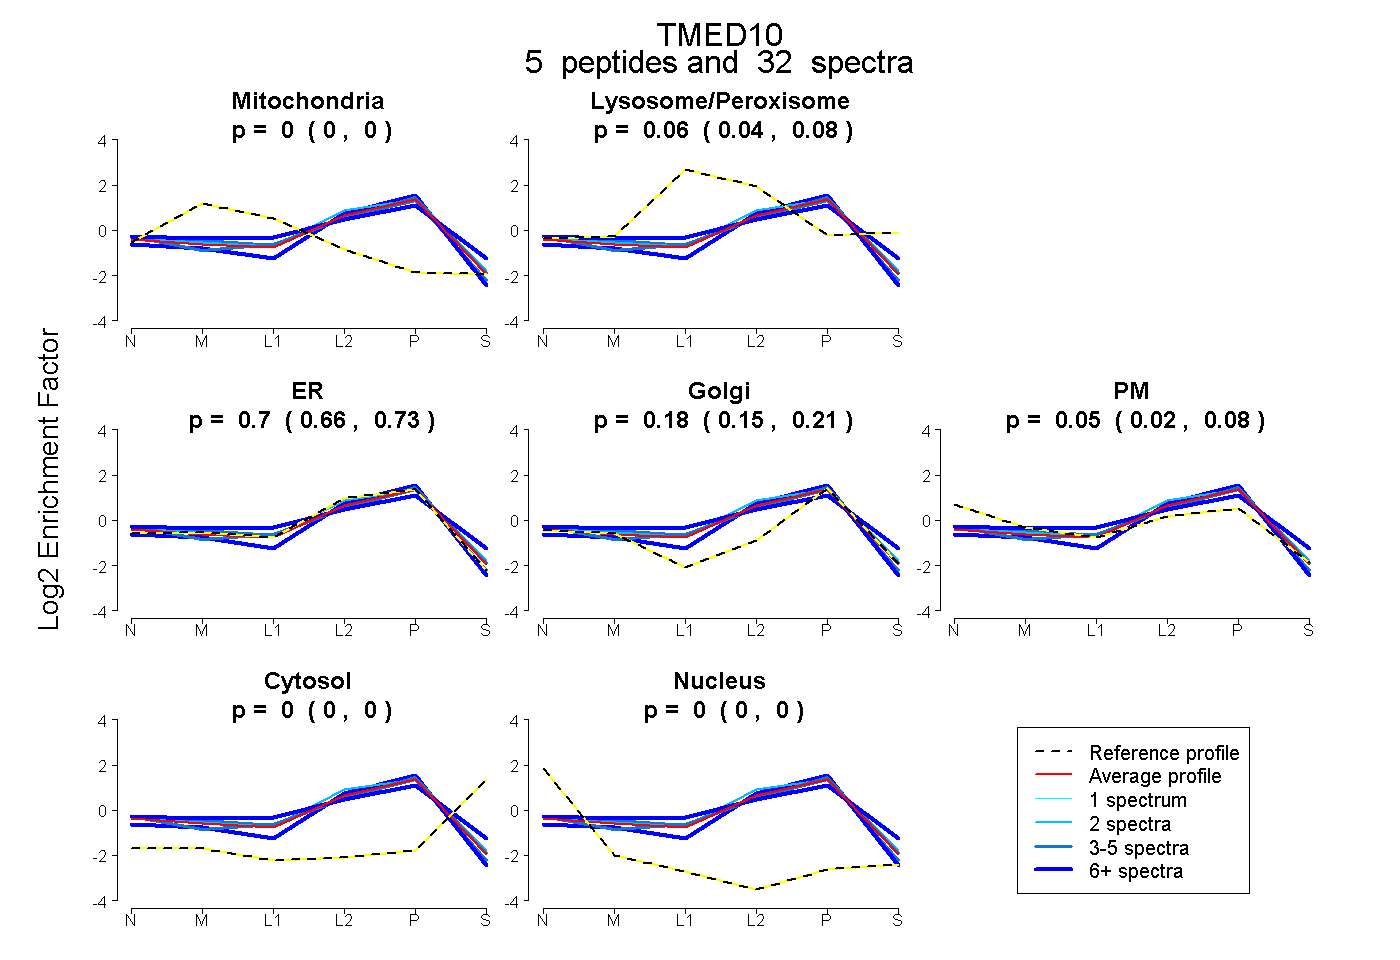
0.000 | 0.000
0.042 | 0.082
0.662 | 0.729
0.150 | 0.213
0.024 | 0.077
0.000 | 0.000
0.000 | 0.000
5peptides
spectra
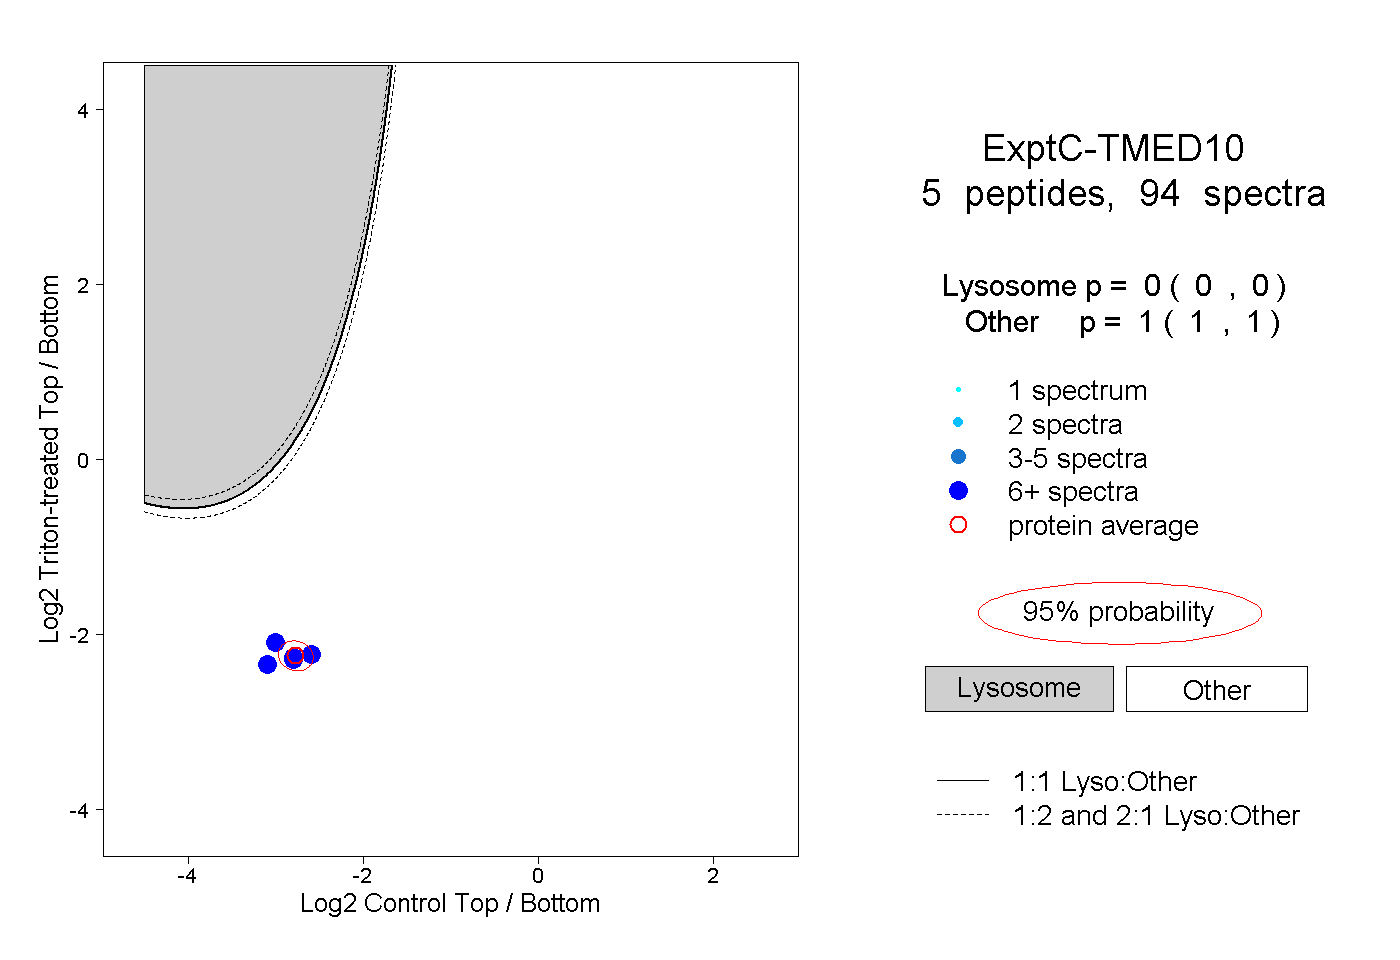
0.000 | 0.000
1.000 | 1.000
3peptides
spectra
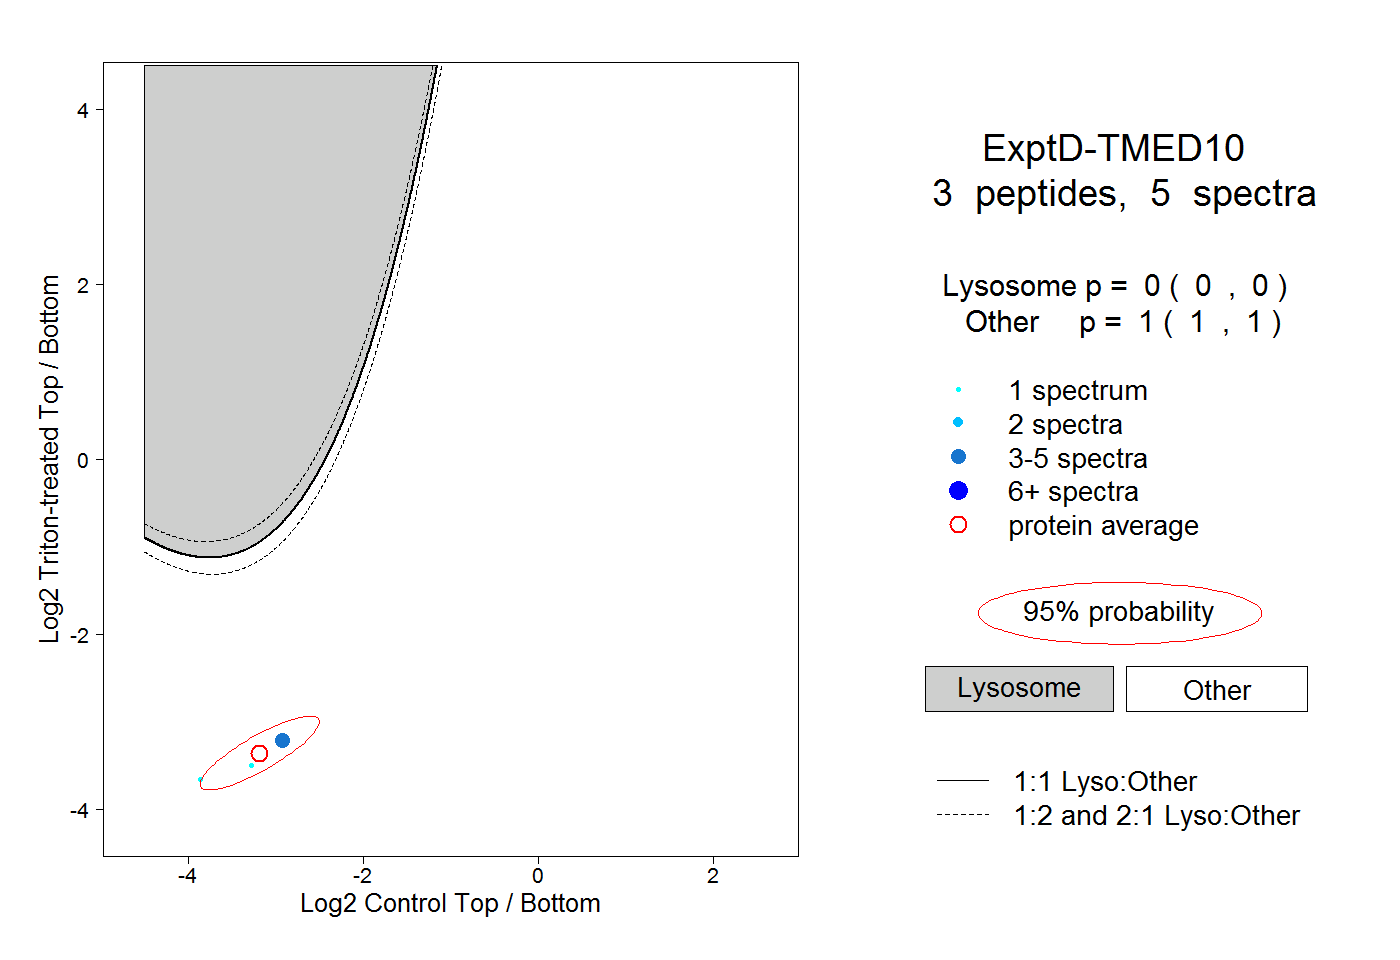
0.000 | 0.000
1.000 | 1.000