TMED10
[ENSRNOP00000010512]
Main page
| | | Plot |
Mito |
Lyso |
|
Perox |
ER |
Golgi |
PM |
Cytosol |
Nucleus |
|
| Expt A |
 6
6
peptides |
46
spectra |
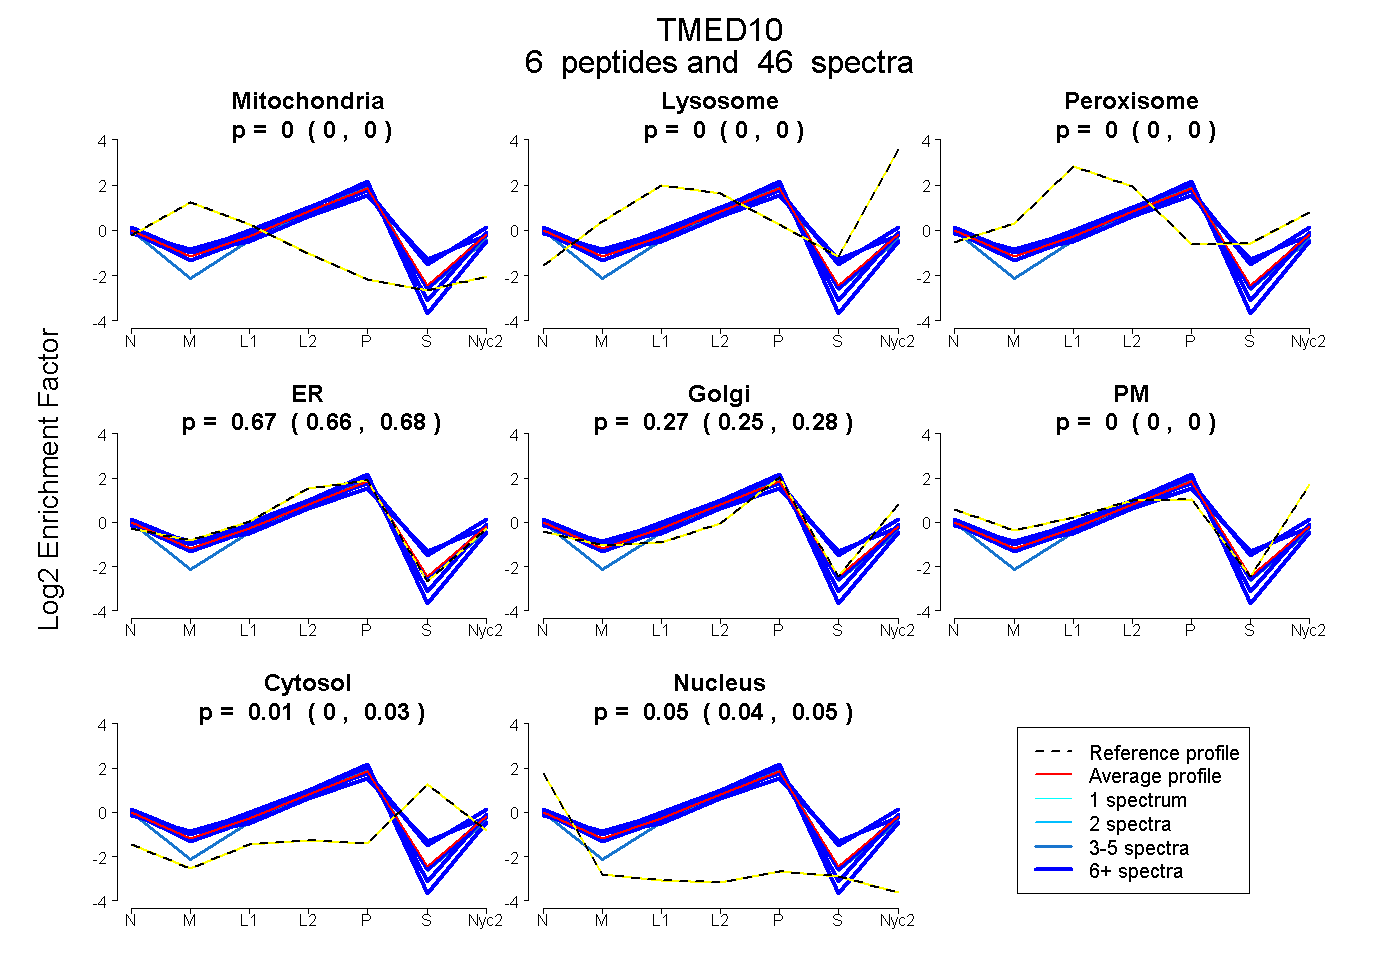 |
0.000
0.000 | 0.000 |
0.000
0.000 | 0.000 |
|
0.000
0.000 | 0.000 |
0.674
0.663 | 0.683 |
0.266
0.252 | 0.276 |
0.000
0.000 | 0.004 |
0.011
0.000 | 0.026 |
0.049
0.039 | 0.055 |
|
| | | Plot |
Mito |
|
Lyso or Perox |
|
ER |
Golgi |
PM |
Cytosol |
Nucleus |
|
| Expt B |
5
peptides |
32
spectra |
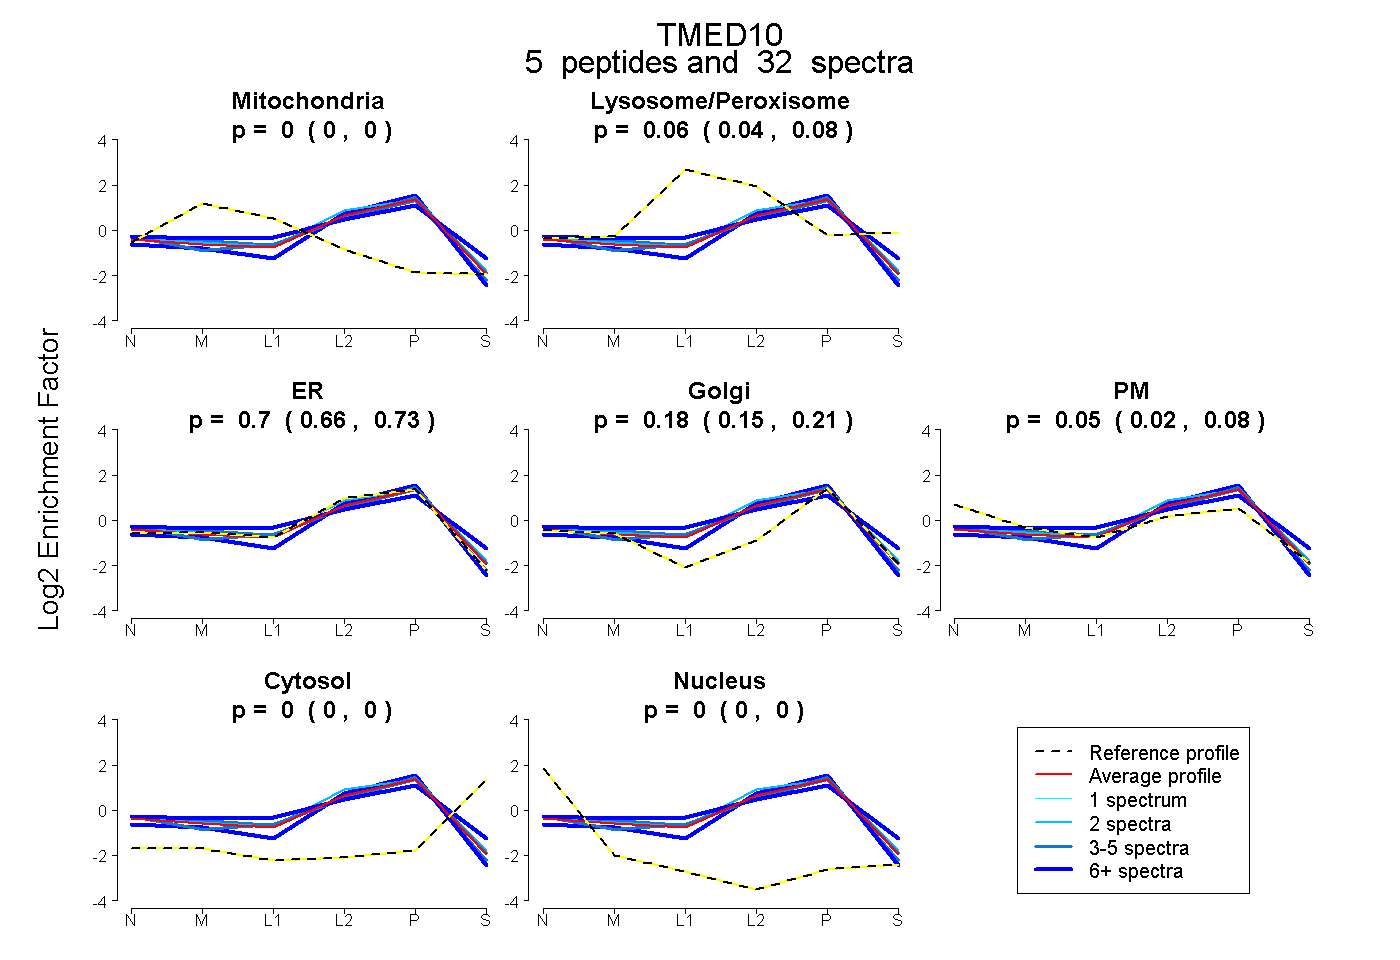 |
0.000
0.000 | 0.000 |
|
0.063
0.042 | 0.082 |
|
0.700
0.662 | 0.729 |
0.183
0.150 | 0.213 |
0.054
0.024 | 0.077 |
0.000
0.000 | 0.000 |
0.000
0.000 | 0.000 |
|
| 4 spectra, LKPLEVELR |
0.000 |
|
0.083 |
|
0.632 |
0.232 |
0.053 |
0.000 |
0.000 |
|
| 5 spectra, HGVEAK |
0.007 |
|
0.006 |
|
0.741 |
0.074 |
0.172 |
0.000 |
0.000 |
|
| 6 spectra, NYEEIAK |
0.000 |
|
0.306 |
|
0.216 |
0.431 |
0.047 |
0.000 |
0.000 |
|
| 15 spectra, IPDQLVILDMK |
0.000 |
|
0.000 |
|
0.809 |
0.191 |
0.000 |
0.000 |
0.000 |
|
| 2 spectra, ITDSAGHILYAK |
0.000 |
|
0.076 |
|
0.750 |
0.115 |
0.059 |
0.000 |
0.000 |
|
| | | Plot |
|
Lyso |
|
|
|
|
|
|
|
Other |
| Expt C |
5
peptides |
94
spectra |
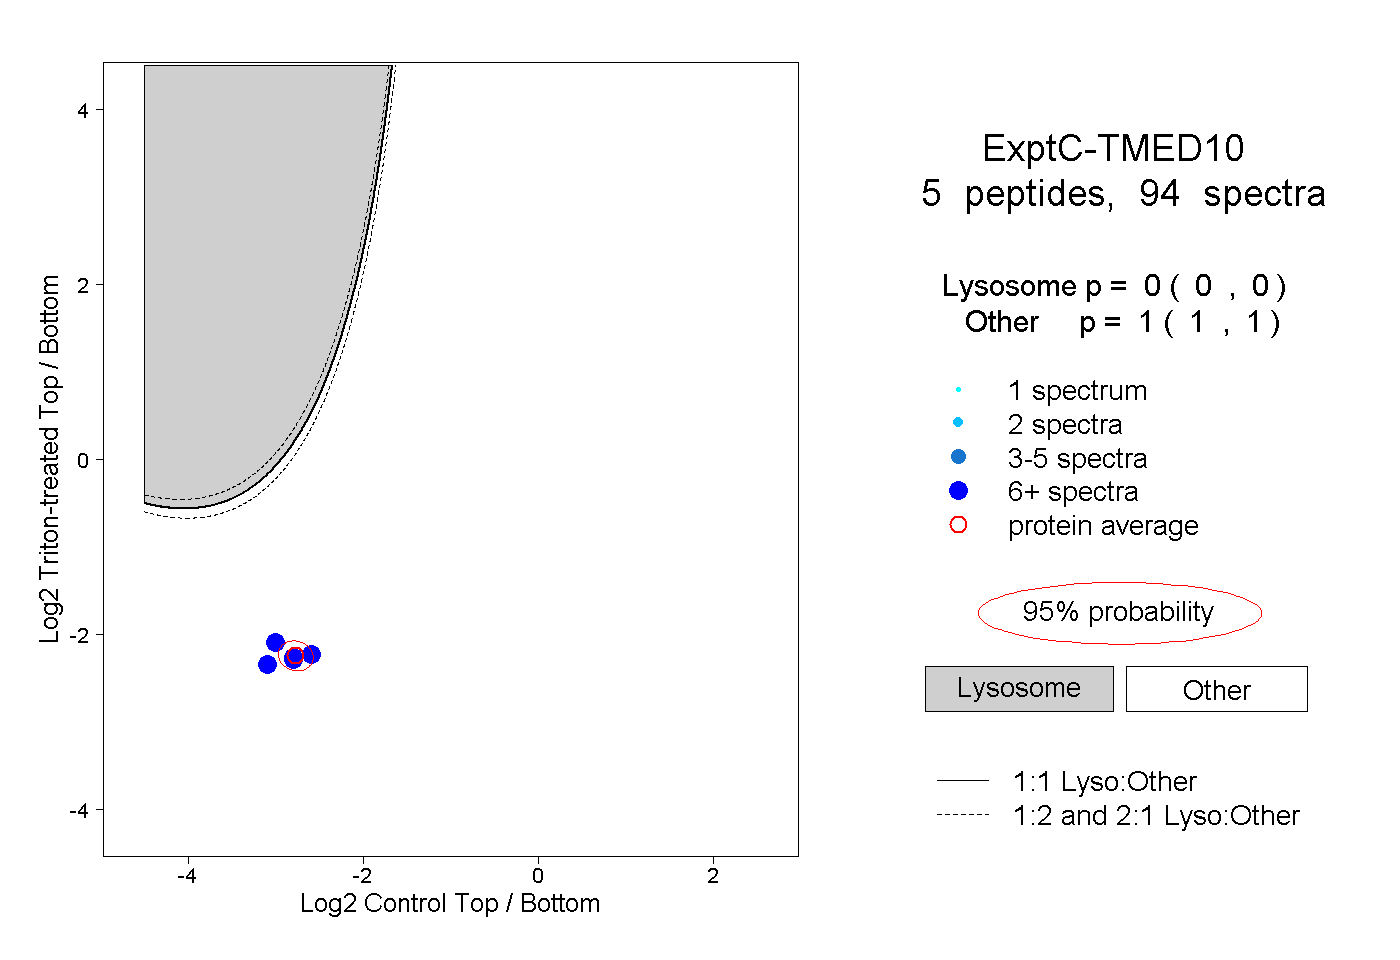 |
|
0.000
0.000 | 0.000 |
|
|
|
|
|
|
|
1.000
1.000 | 1.000 |
| | | Plot |
|
Lyso |
|
|
|
|
|
|
|
Other |
| Expt D |
3
peptides |
5
spectra |
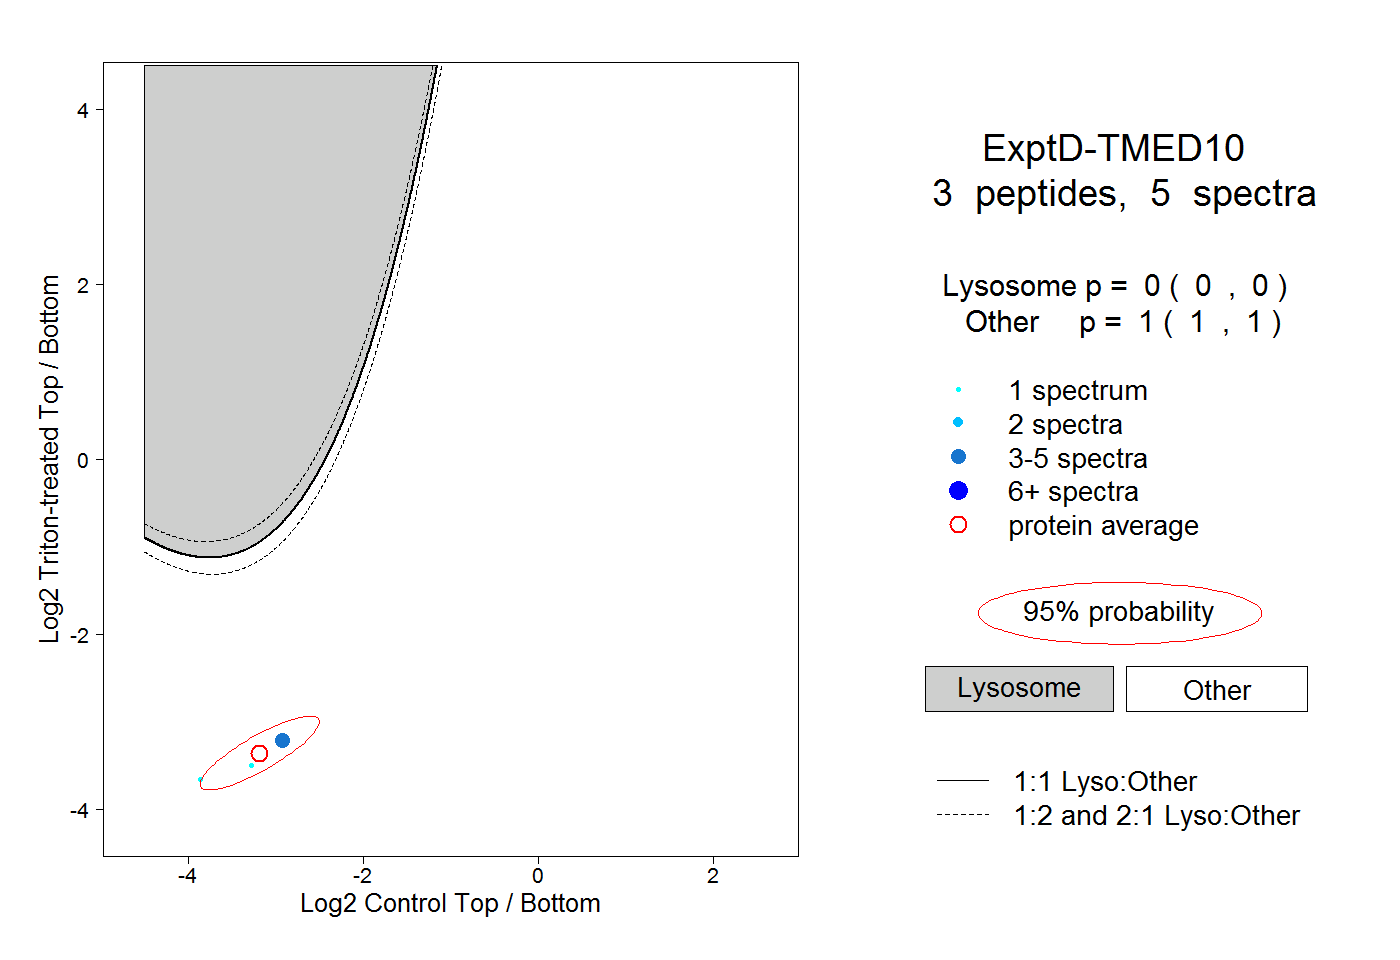 |
|
0.000
0.000 | 0.000 |
|
|
|
|
|
|
|
1.000
1.000 | 1.000 |