 6
6peptides
spectra
0.000 | 0.000
0.000 | 0.000
0.000 | 0.000
0.663 | 0.683
0.252 | 0.276
0.000 | 0.004
0.000 | 0.026
0.039 | 0.055
| Plot | Mito | Lyso | Perox | ER | Golgi | PM | Cytosol | Nucleus | |||||
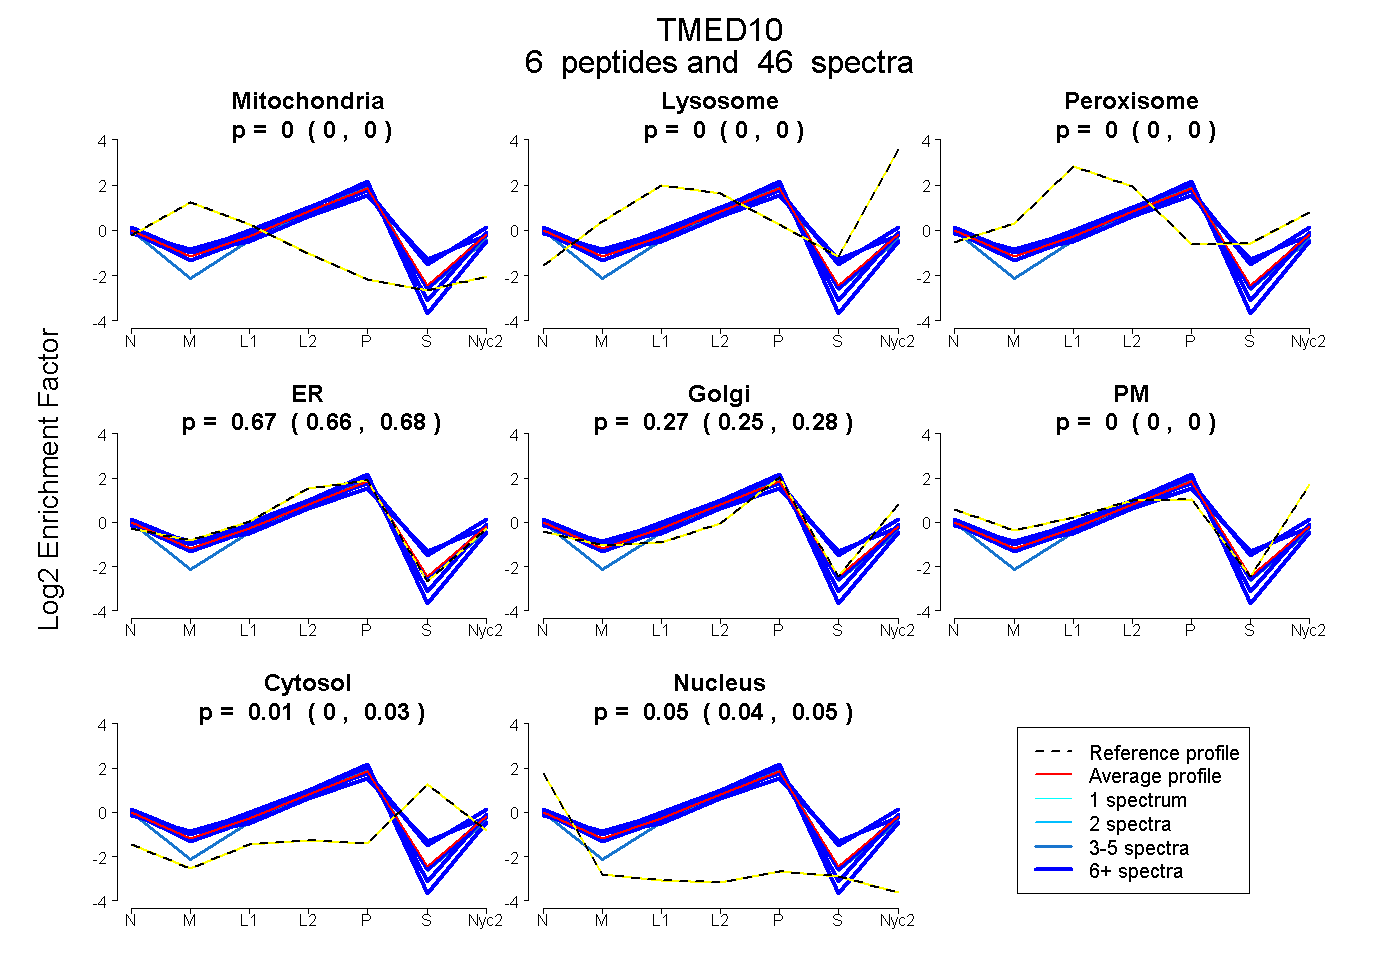
| Expt A |
6 peptides |
46 spectra |
|
0.000 0.000 | 0.000 |
0.000 0.000 | 0.000 |
0.000 0.000 | 0.000 |
0.674 0.663 | 0.683 |
0.266 0.252 | 0.276 |
0.000 0.000 | 0.004 |
0.011 0.000 | 0.026 |
0.049 0.039 | 0.055 |
| 6 spectra, LKPLEVELR | 0.000 | 0.000 | 0.000 | 0.817 | 0.119 | 0.000 | 0.000 | 0.064 | ||
| 10 spectra, HGVEAK | 0.000 | 0.000 | 0.000 | 0.547 | 0.144 | 0.098 | 0.207 | 0.005 | ||
| 3 spectra, DTNESTNTR | 0.000 | 0.000 | 0.000 | 0.642 | 0.261 | 0.000 | 0.000 | 0.097 | ||
| 12 spectra, NYEEIAK | 0.000 | 0.000 | 0.000 | 0.690 | 0.205 | 0.050 | 0.000 | 0.055 | ||
| 7 spectra, IPDQLVILDMK | 0.000 | 0.000 | 0.000 | 0.784 | 0.180 | 0.015 | 0.000 | 0.021 | ||
| 8 spectra, ITDSAGHILYAK | 0.000 | 0.000 | 0.105 | 0.434 | 0.366 | 0.000 | 0.094 | 0.000 |
| Plot | Mito | Lyso or Perox | ER | Golgi | PM | Cytosol | Nucleus | ||||||
| Expt B |
5 peptides |
32 spectra |
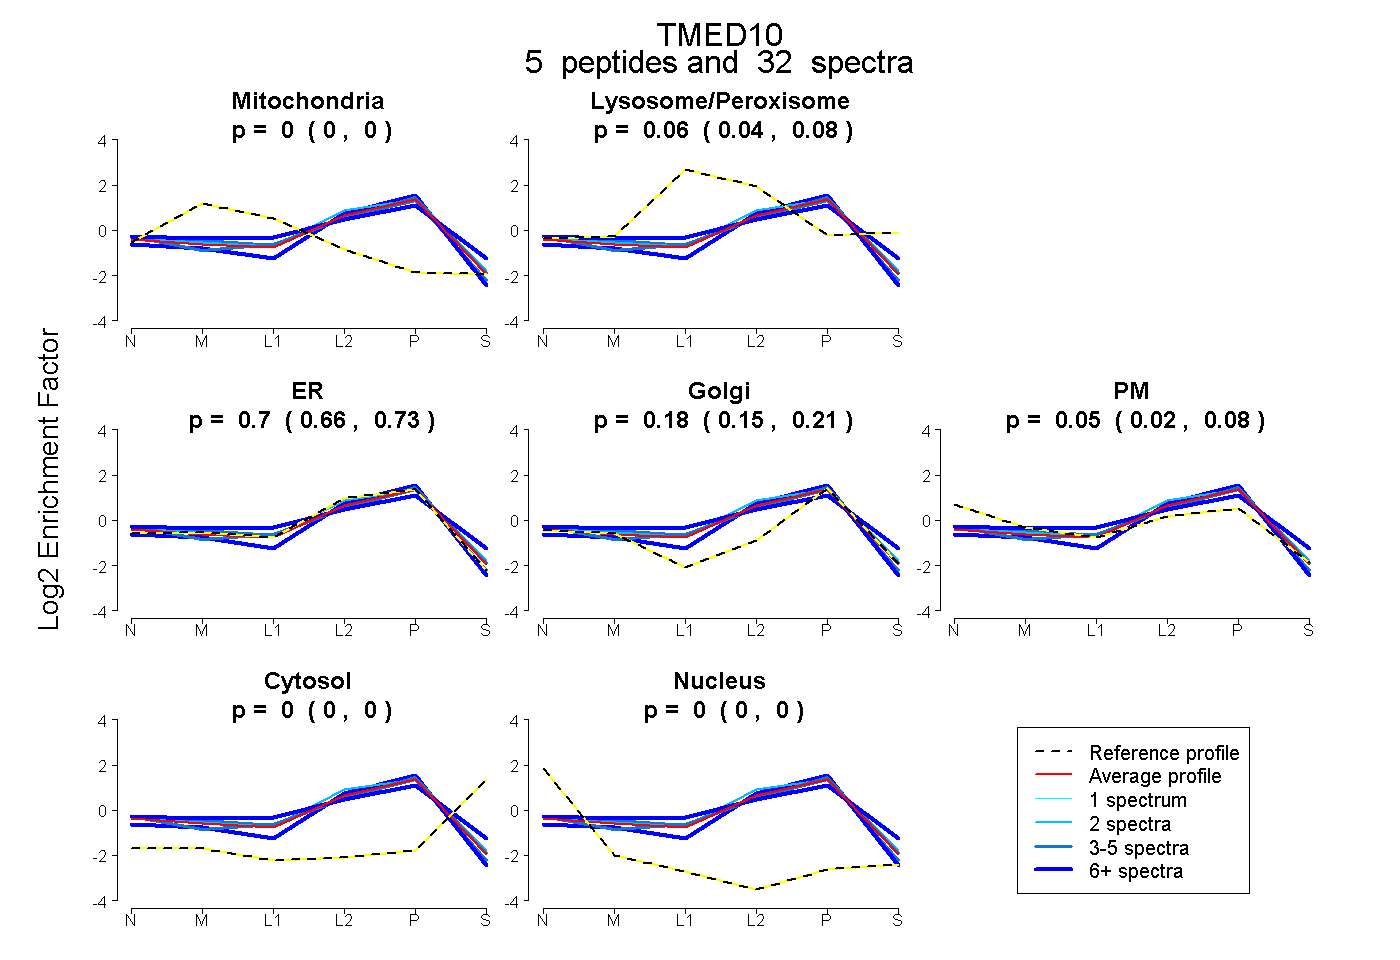 |
0.000 0.000 | 0.000 |
0.063 0.042 | 0.082 |
0.700 0.662 | 0.729 |
0.183 0.150 | 0.213 |
0.054 0.024 | 0.077 |
0.000 0.000 | 0.000 |
0.000 0.000 | 0.000 |
|||
| Plot | Lyso | Other | |||||||||||
| Expt C |
5 peptides |
94 spectra |
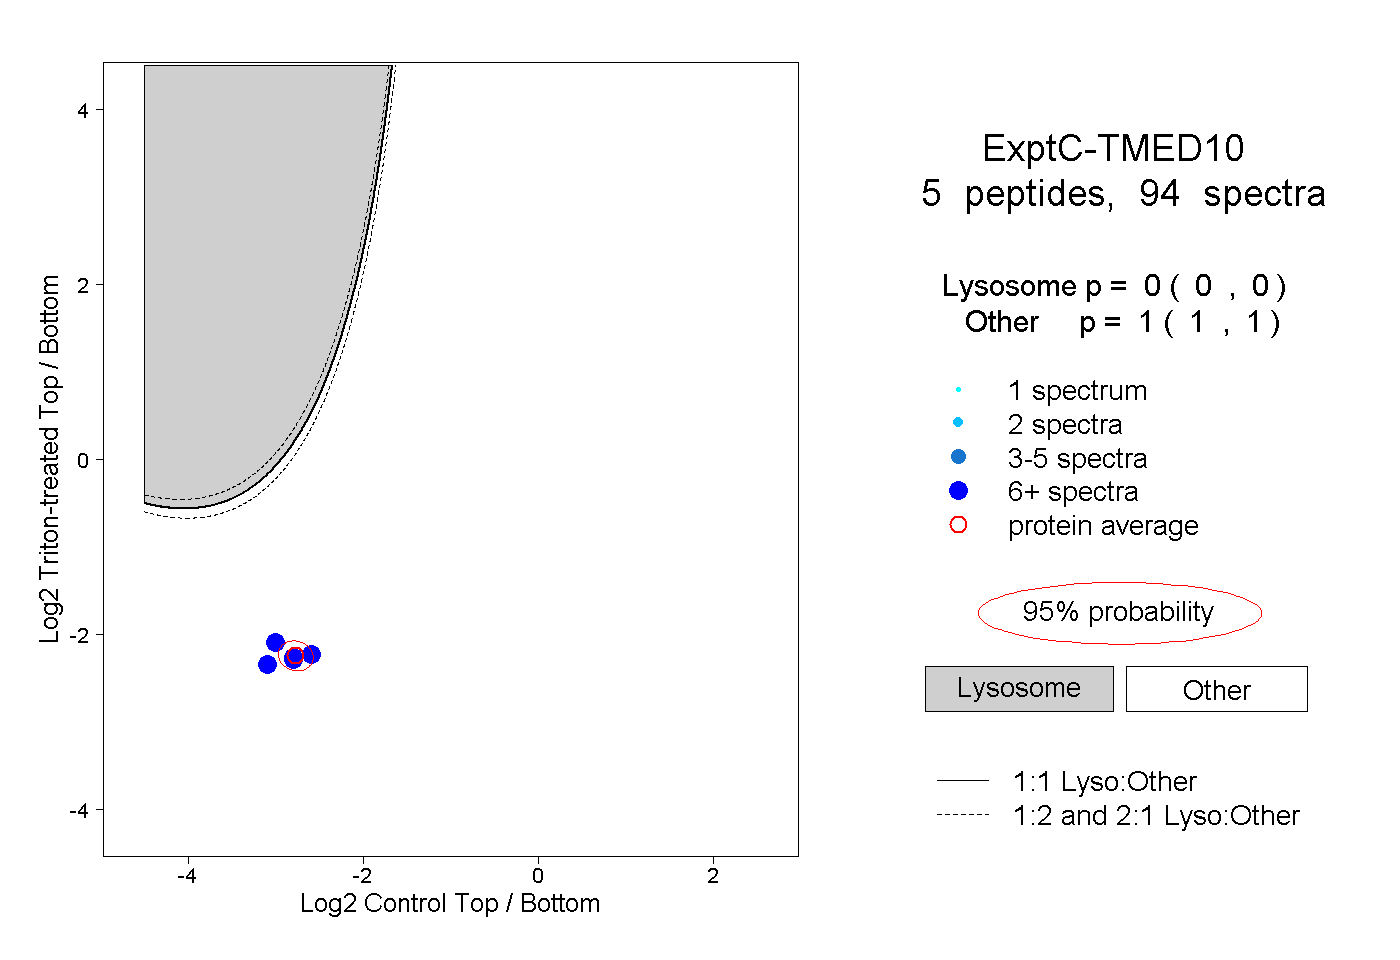 |
0.000 0.000 | 0.000 |
1.000 1.000 | 1.000 |
||||||||
| Plot | Lyso | Other | |||||||||||
| Expt D |
3 peptides |
5 spectra |
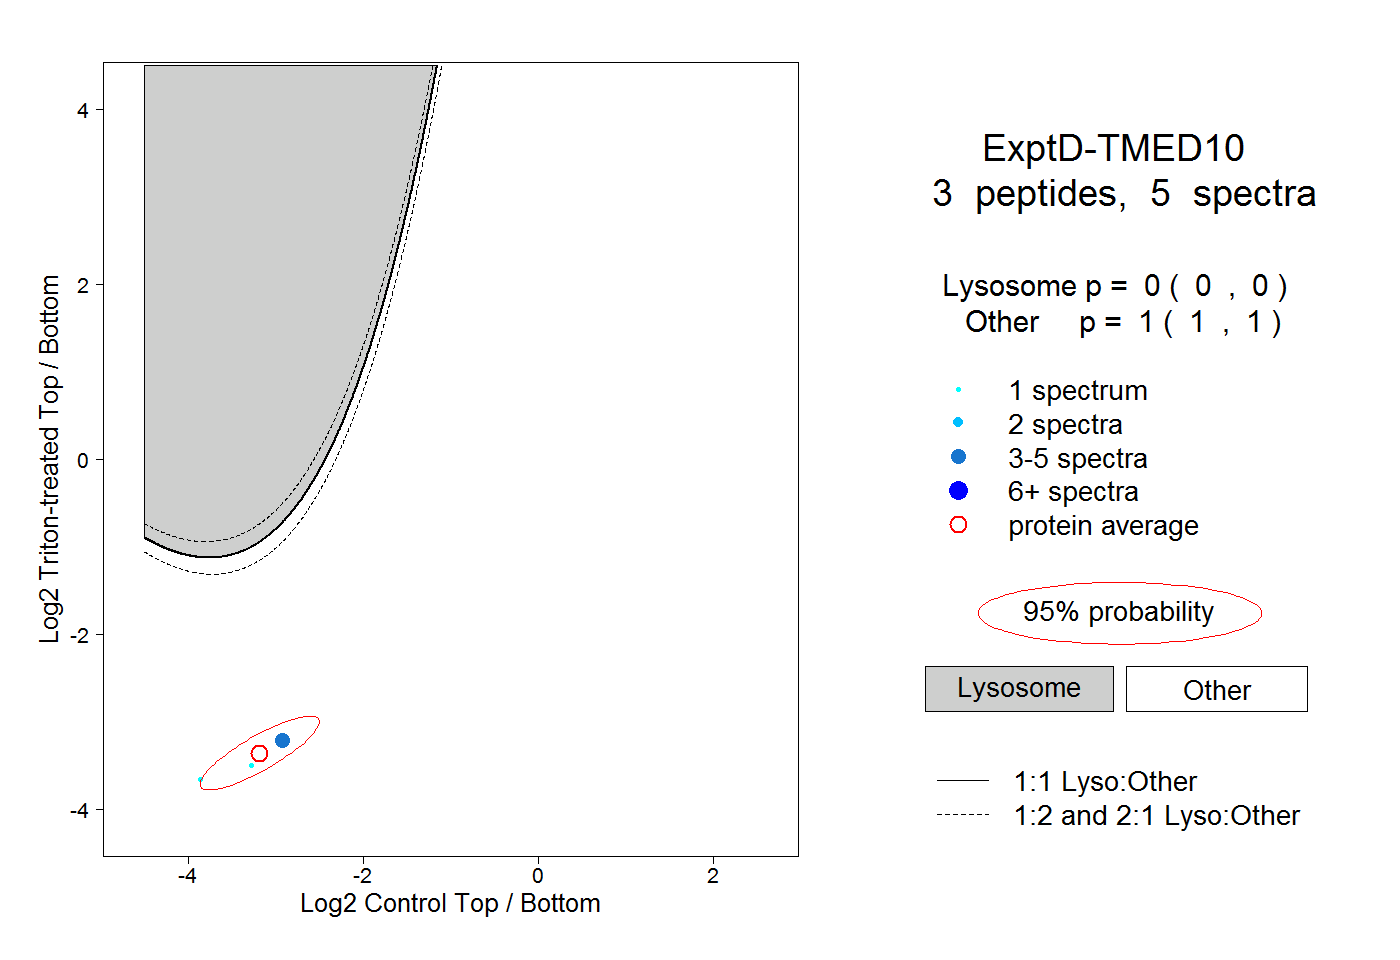 |
0.000 0.000 | 0.000 |
1.000 1.000 | 1.000 |