 9
9peptides
spectra
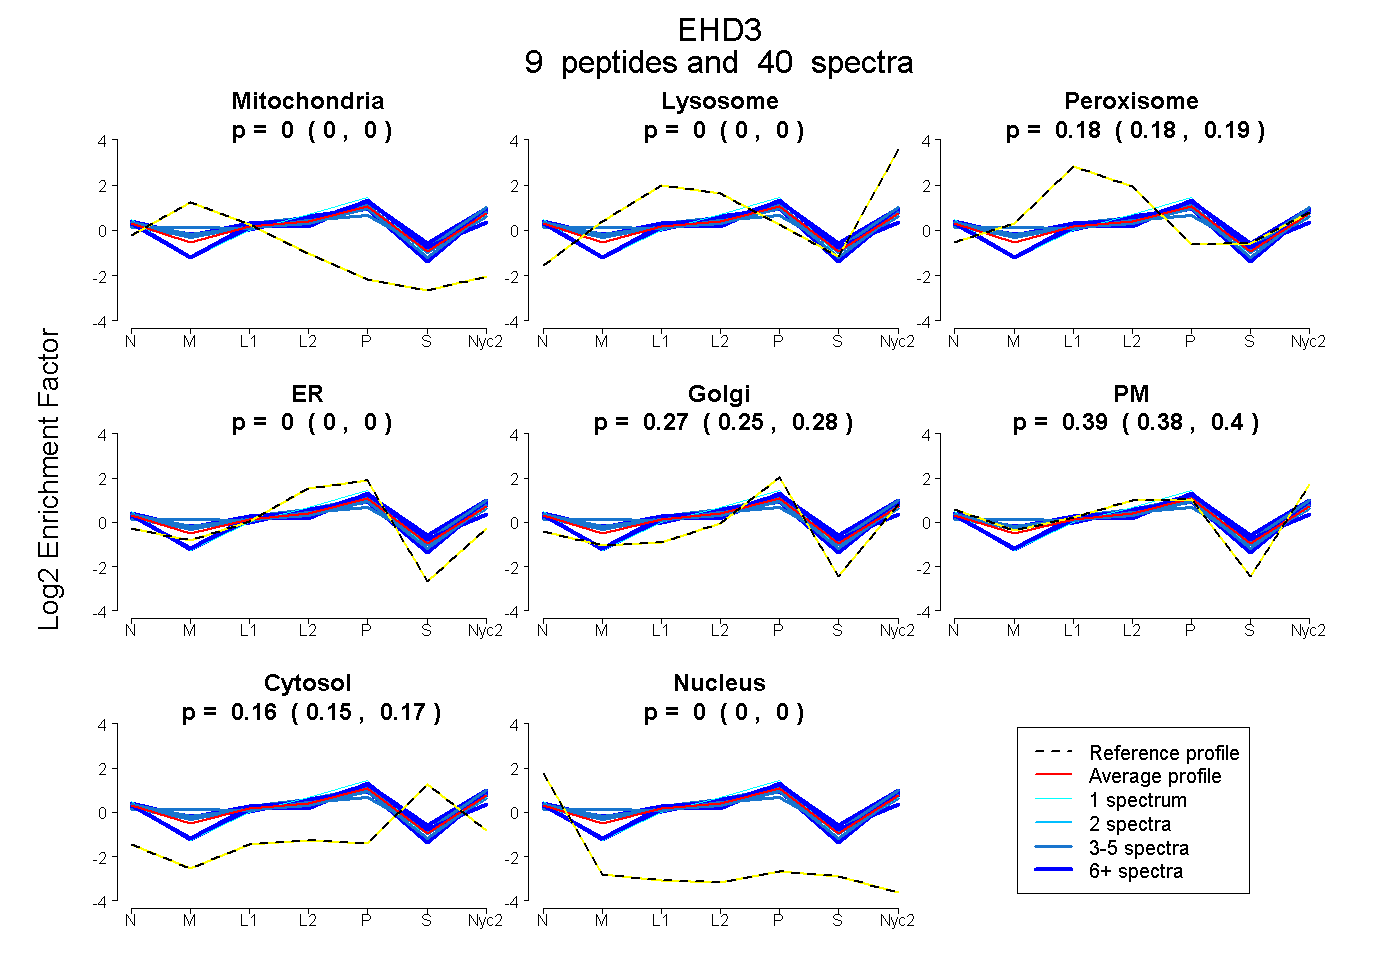
0.000 | 0.000
0.000 | 0.000
0.178 | 0.190
0.000 | 0.000
0.254 | 0.277
0.375 | 0.399
0.154 | 0.165
0.000 | 0.000
2peptides
spectra
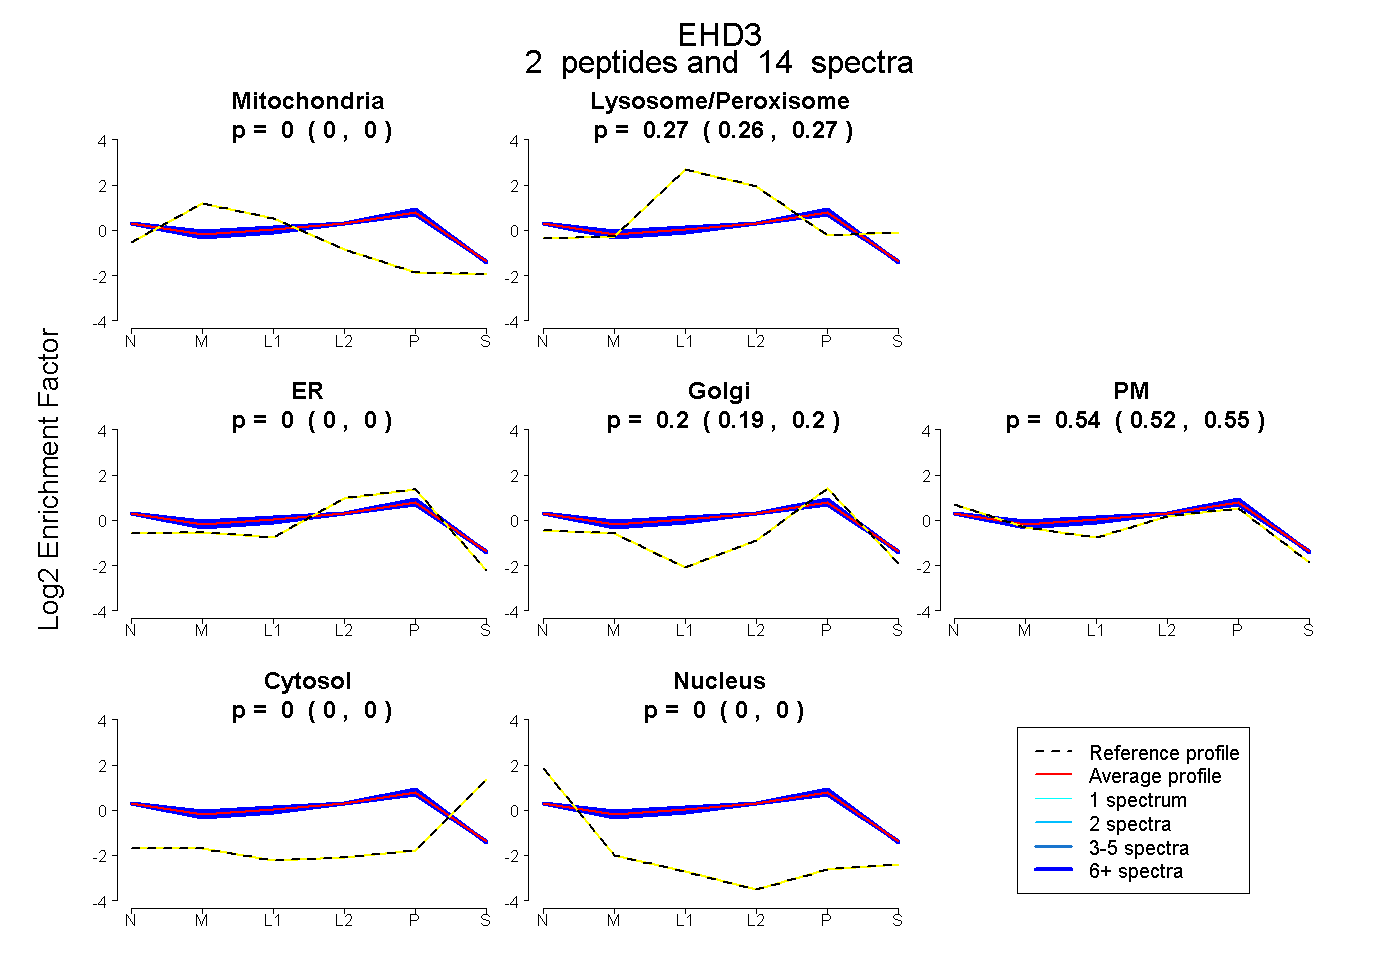
0.000 | 0.000
0.259 | 0.271
0.000 | 0.000
0.187 | 0.204
0.524 | 0.550
0.000 | 0.000
0.000 | 0.000
23peptides
spectra
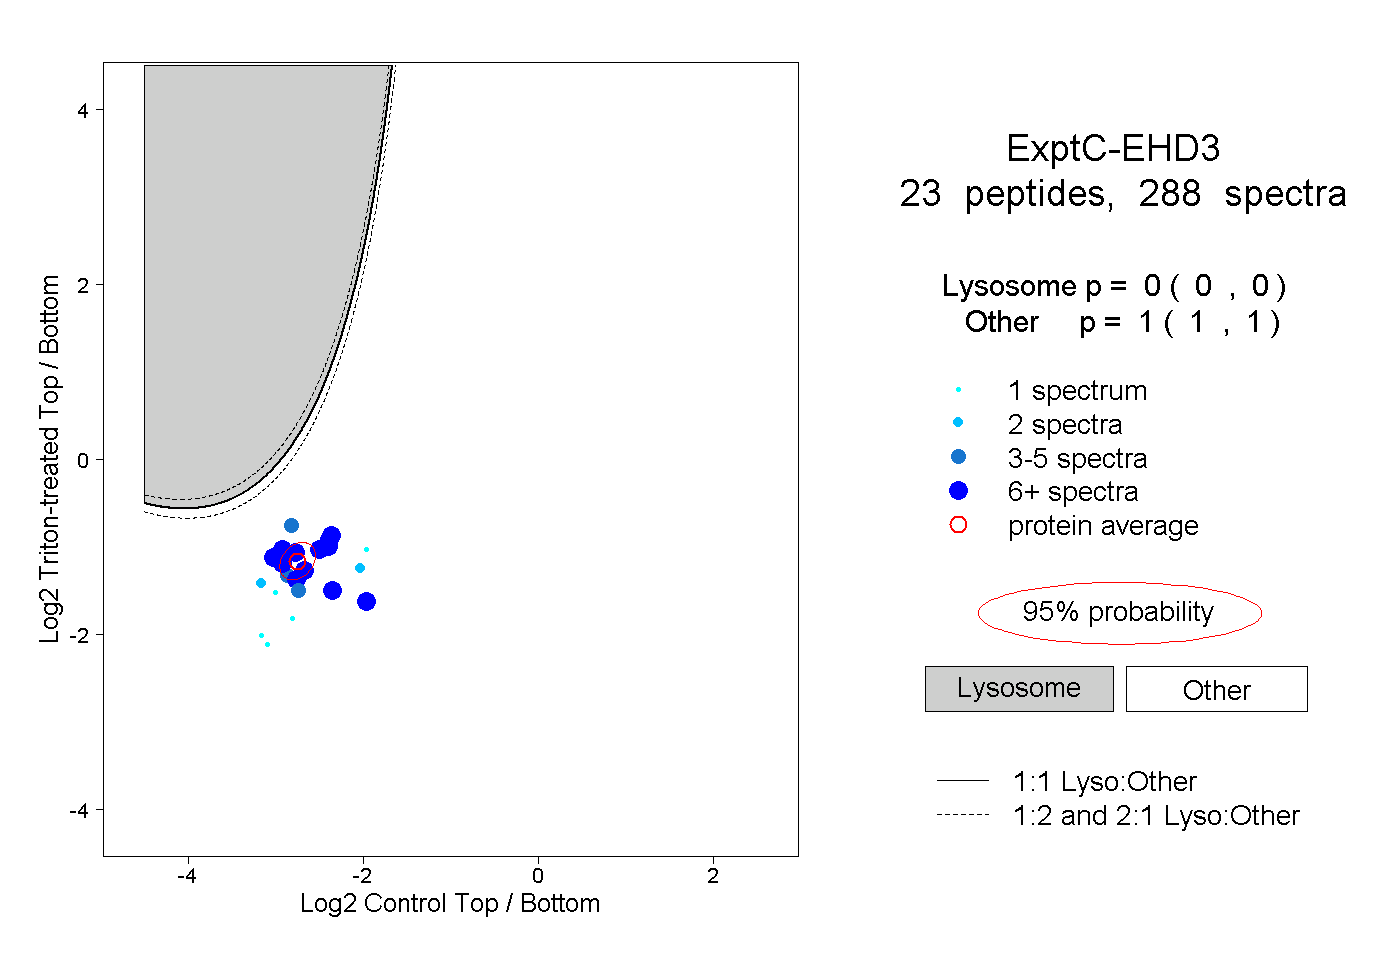
0.000 | 0.000
1.000 | 1.000
8peptides
spectra
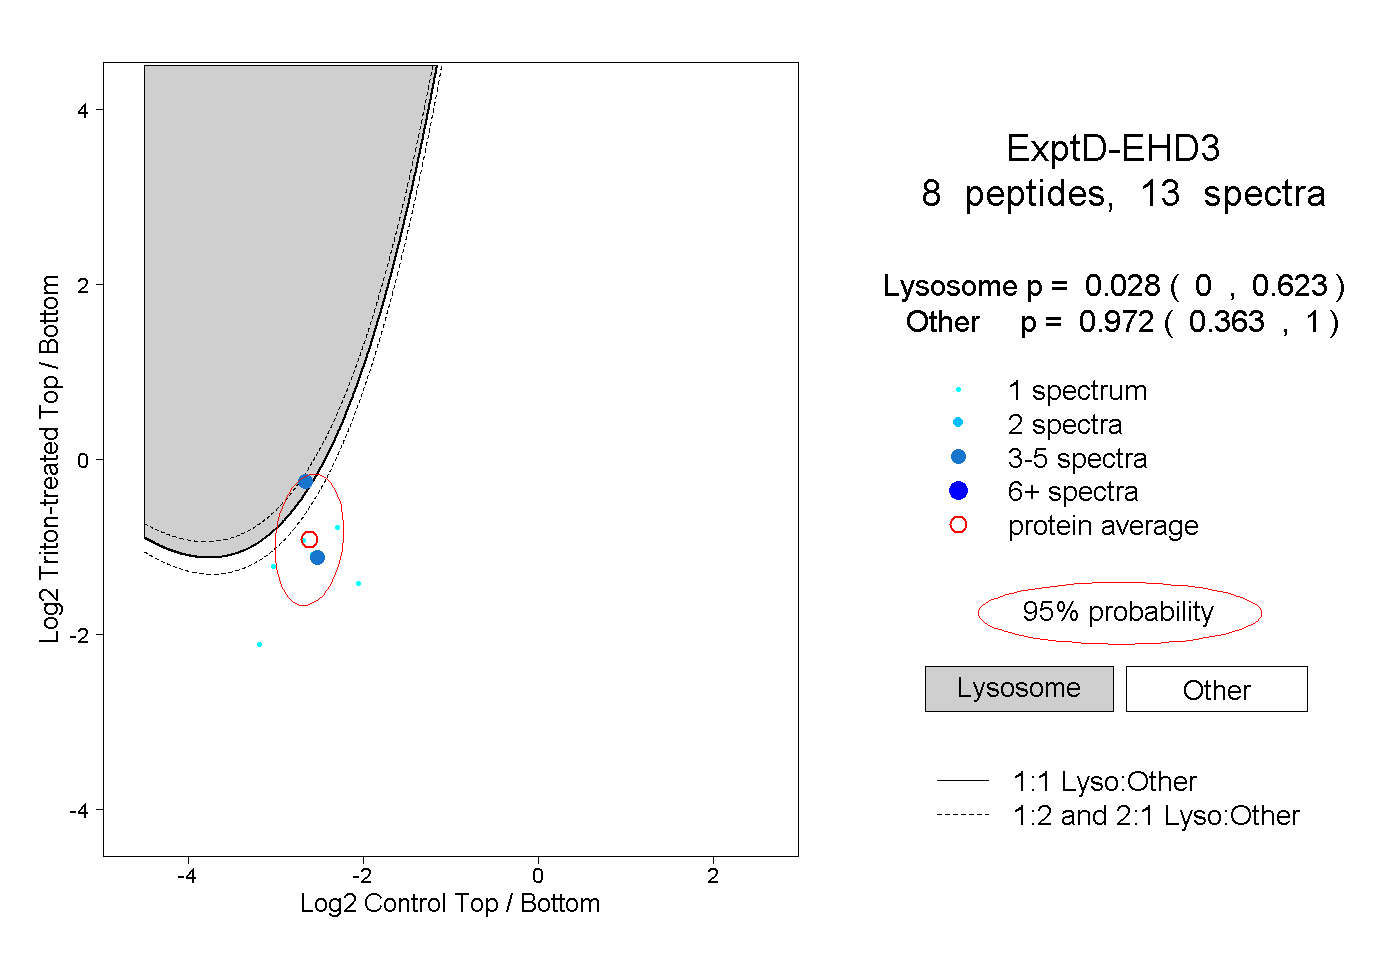
0.000 | 0.623
0.363 | 1.000