EHD3
[ENSRNOP00000010419]
Main page
| | | Plot |
Mito |
Lyso |
|
Perox |
ER |
Golgi |
PM |
Cytosol |
Nucleus |
|
| Expt A |
 9
9
peptides |
40
spectra |
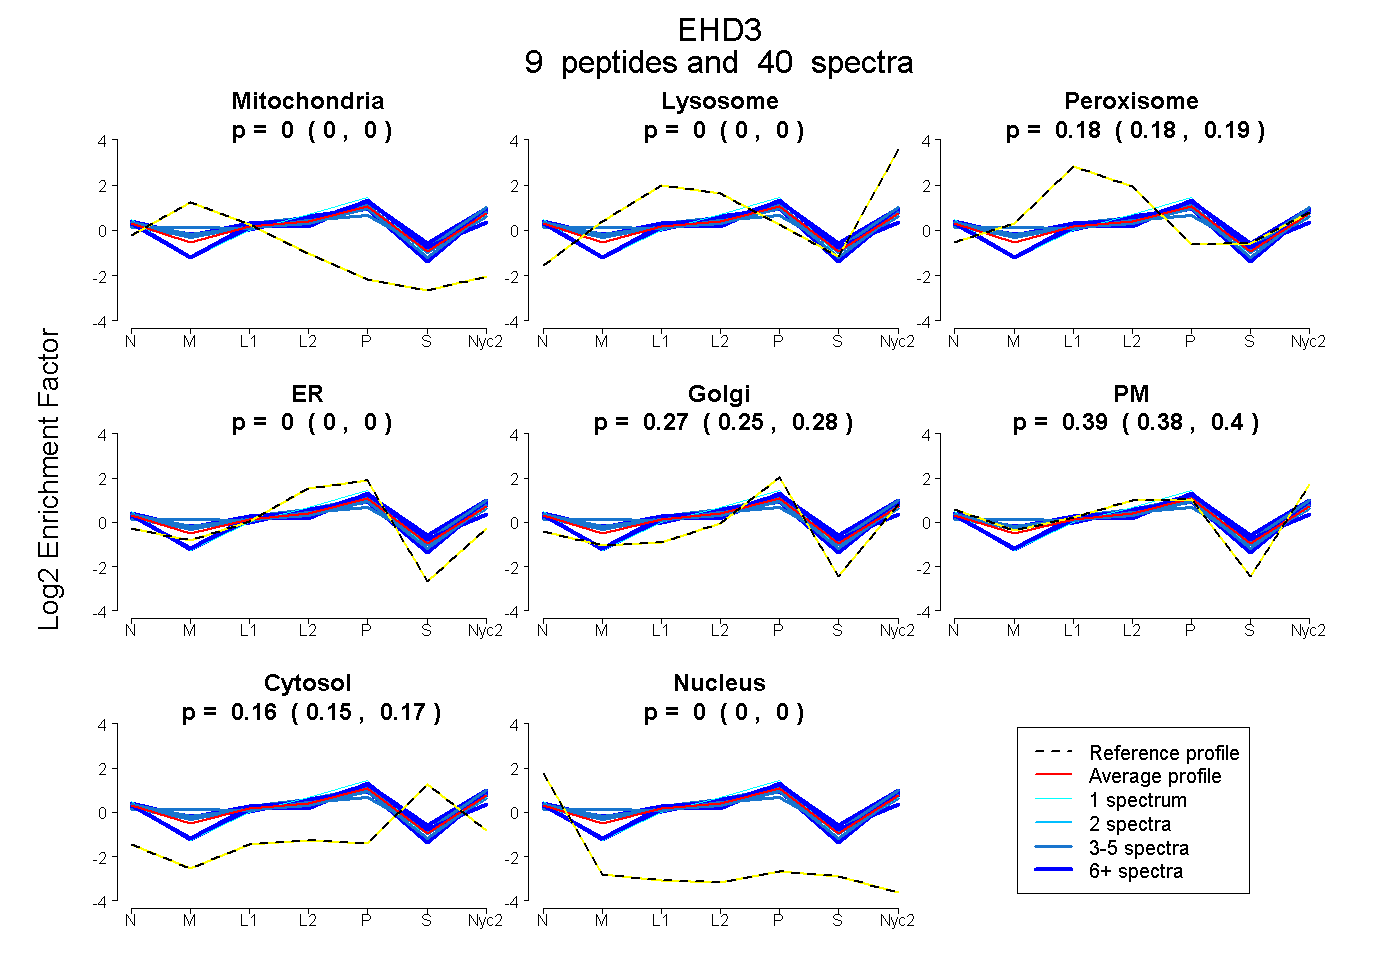 |
0.000
0.000 | 0.000 |
0.000
0.000 | 0.000 |
|
0.185
0.178 | 0.190 |
0.000
0.000 | 0.000 |
0.267
0.254 | 0.277 |
0.389
0.375 | 0.399 |
0.160
0.154 | 0.165 |
0.000
0.000 | 0.000 |
|
| | | Plot |
Mito |
|
Lyso or Perox |
|
ER |
Golgi |
PM |
Cytosol |
Nucleus |
|
| Expt B |
2
peptides |
14
spectra |
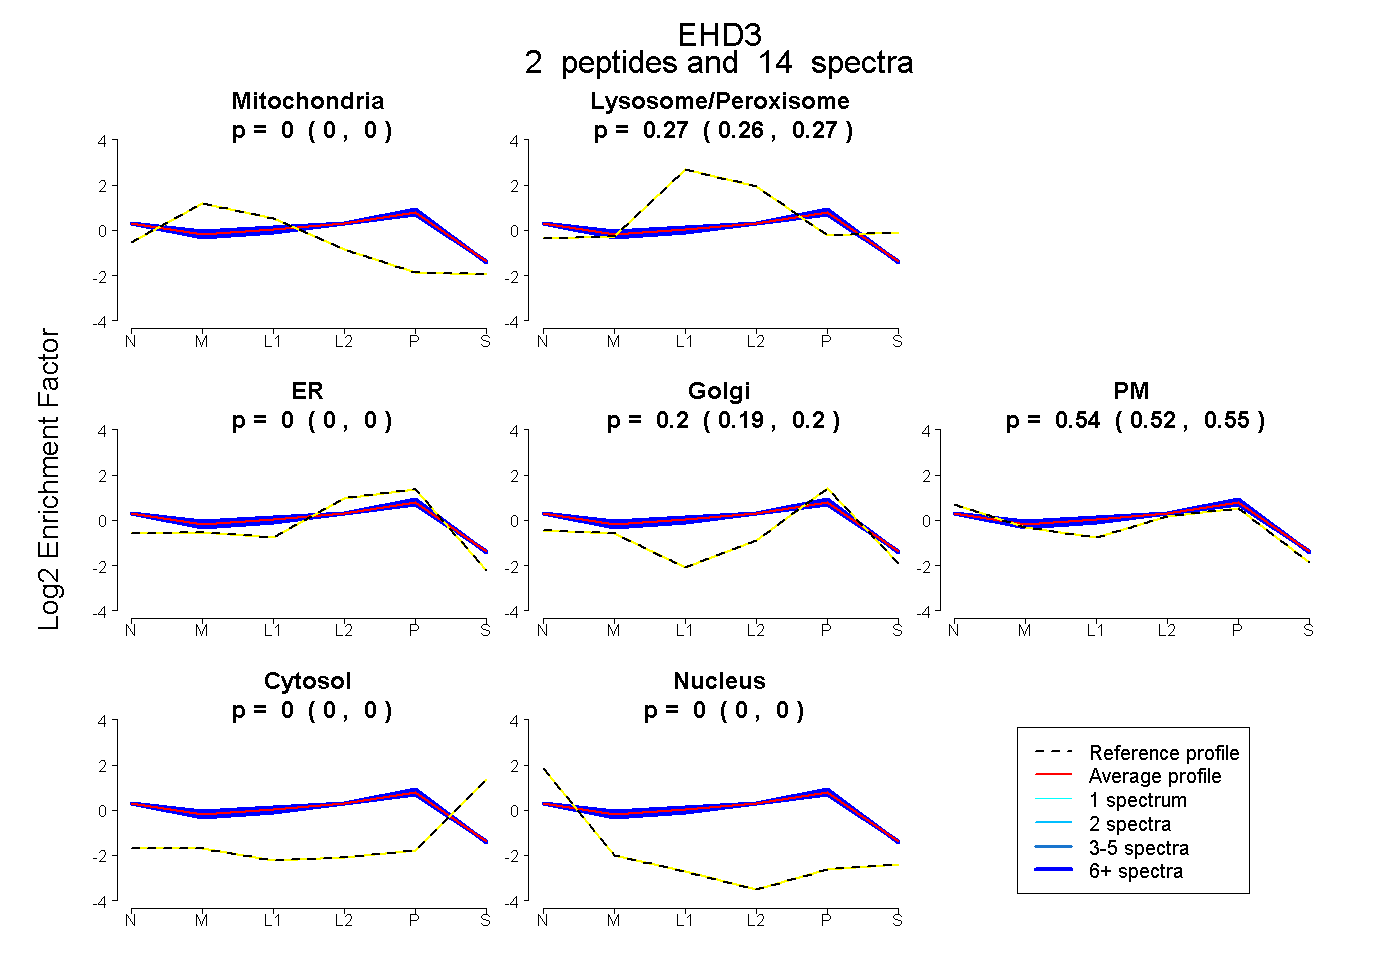 |
0.000
0.000 | 0.000 |
|
0.265
0.259 | 0.271 |
|
0.000
0.000 | 0.000 |
0.196
0.187 | 0.204 |
0.539
0.524 | 0.550 |
0.000
0.000 | 0.000 |
0.000
0.000 | 0.000 |
|
| | | Plot |
|
Lyso |
|
|
|
|
|
|
|
Other |
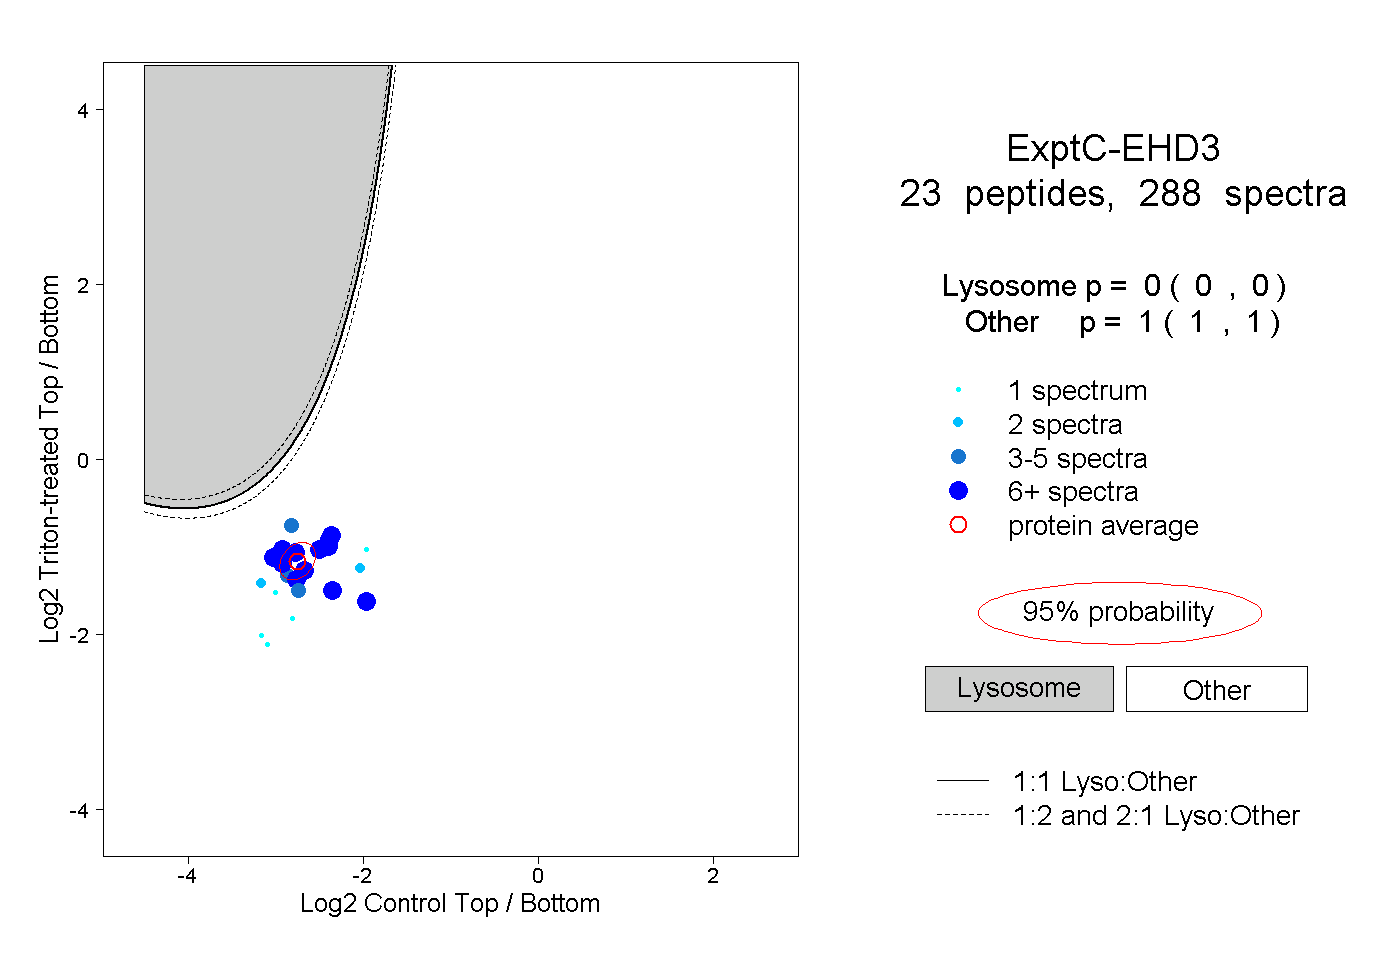
| Expt C |
23
peptides |
288
spectra |
 |
|
0.000
0.000 | 0.000 |
|
|
|
|
|
|
|
1.000
1.000 | 1.000 |
| | | Plot |
|
Lyso |
|
|
|
|
|
|
|
Other |
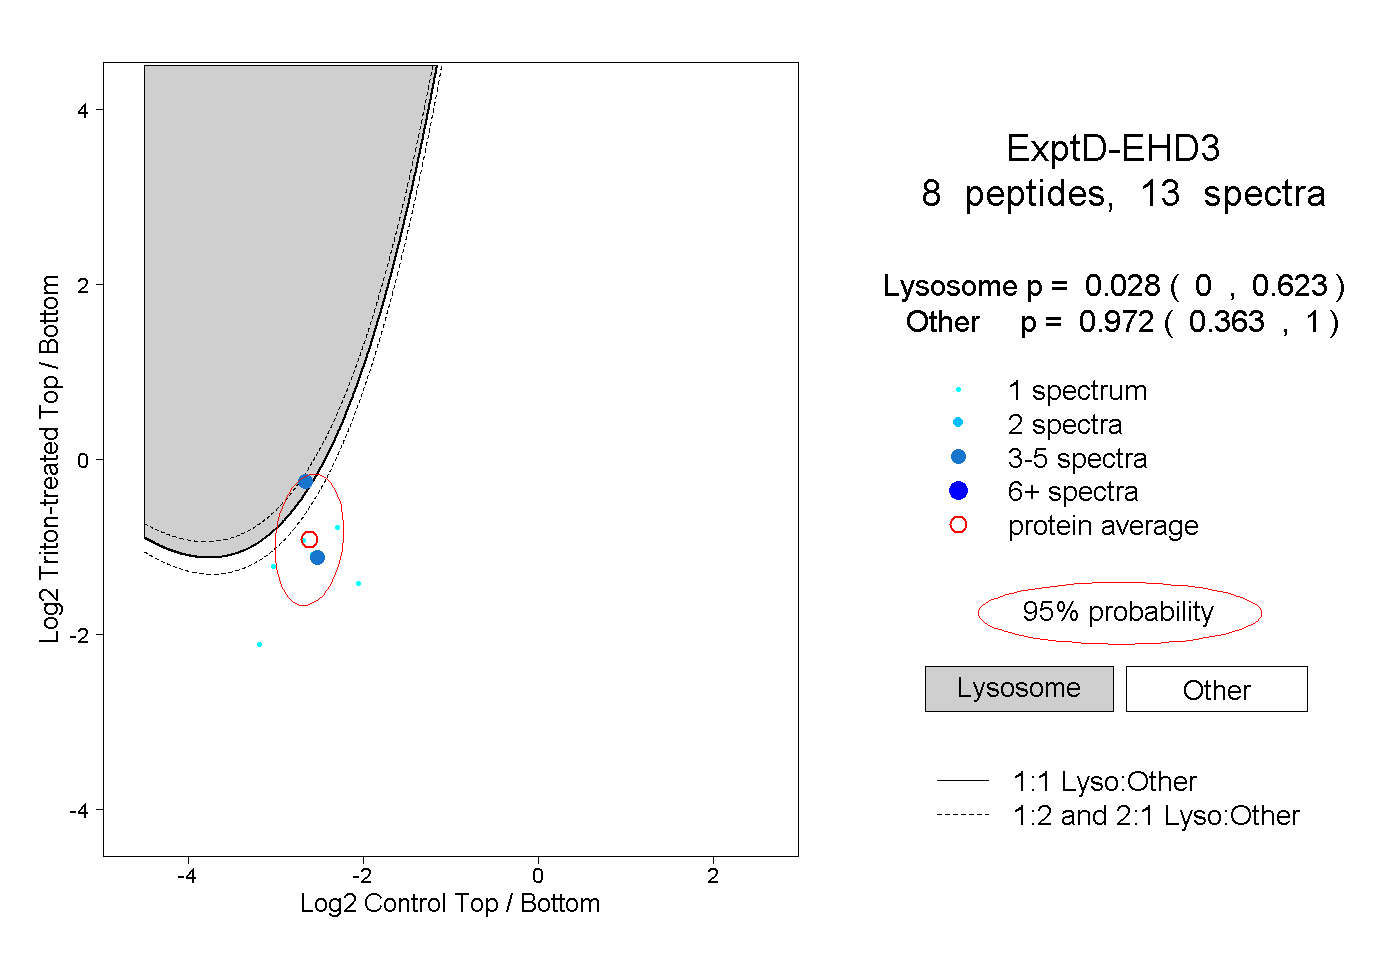
| Expt D |
8
peptides |
13
spectra |
 |
|
0.028
0.000 | 0.623 |
|
|
|
|
|
|
|
0.972
0.363 | 1.000 |
| 3 spectra, IVNTPEVIR |
|
0.004 |
|
|
|
|
|
|
|
0.996 |
| 4 spectra, LFEAEEQDLFK |
|
0.684 |
|
|
|
|
|
|
|
0.316 |
| 1 spectrum, LNAFGNAFLNR |
|
0.046 |
|
|
|
|
|
|
|
0.954 |
| 1 spectrum, ITGANAK |
|
0.008 |
|
|
|
|
|
|
|
0.992 |
| 1 spectrum, LLPLEEYYR |
|
0.071 |
|
|
|
|
|
|
|
0.929 |
| 1 spectrum, IILLFDAHK |
|
0.000 |
|
|
|
|
|
|
|
1.000 |
| 1 spectrum, LDISDEFSEVIK |
|
0.003 |
|
|
|
|
|
|
|
0.997 |
| 1 spectrum, EMPSVFGK |
|
0.000 |
|
|
|
|
|
|
|
1.000 |