 9
9peptides
spectra
0.000 | 0.000
0.000 | 0.000
0.178 | 0.190
0.000 | 0.000
0.254 | 0.277
0.375 | 0.399
0.154 | 0.165
0.000 | 0.000
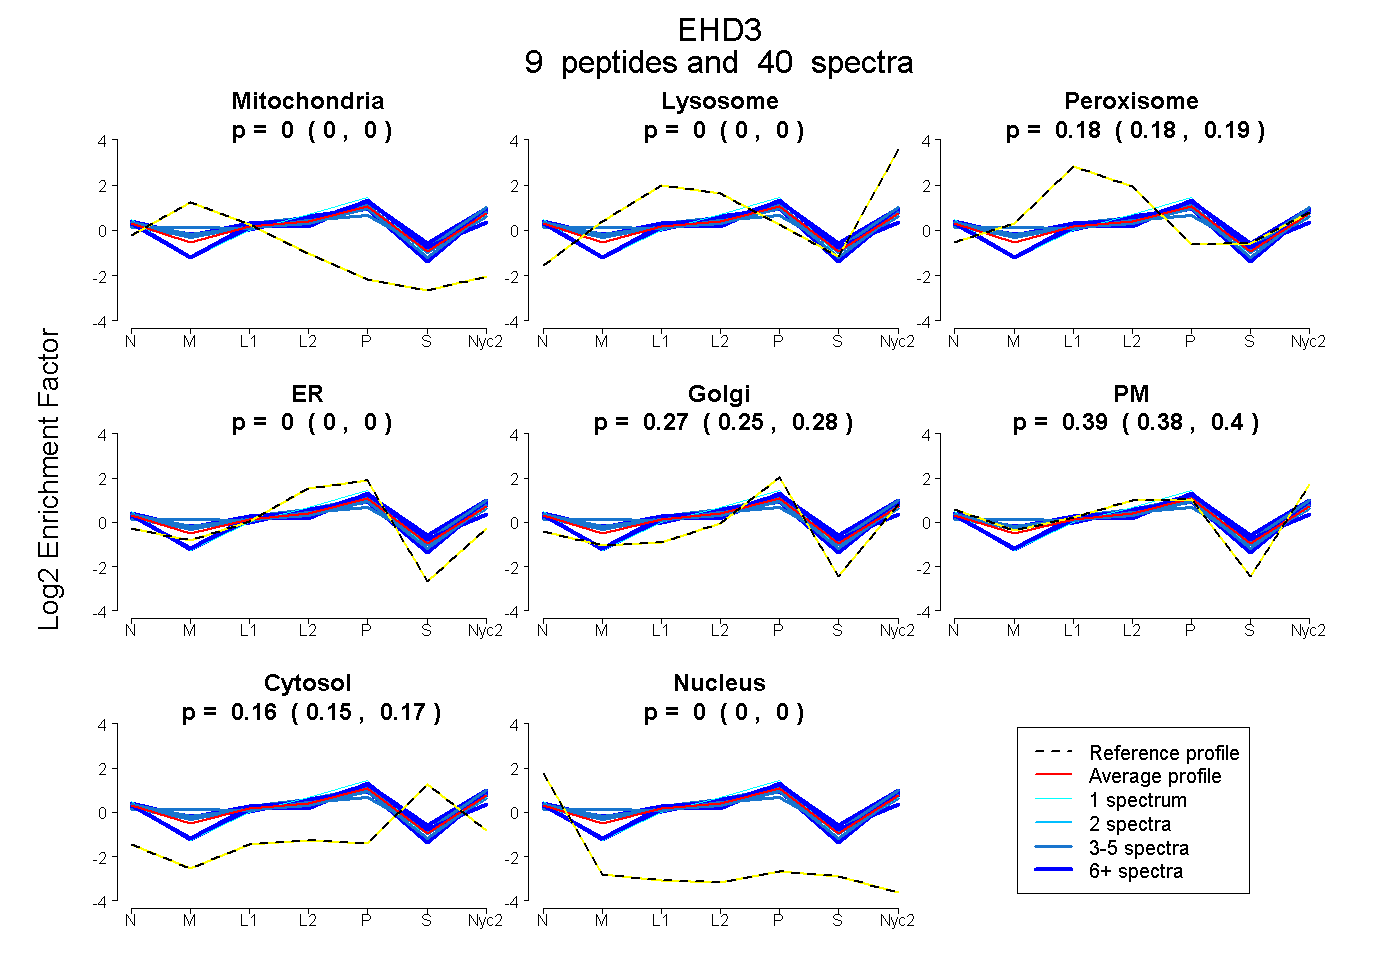
| Plot | Mito | Lyso | Perox | ER | Golgi | PM | Cytosol | Nucleus | |||||
| Expt A |
9 peptides |
40 spectra |
|
0.000 0.000 | 0.000 |
0.000 0.000 | 0.000 |
0.185 0.178 | 0.190 |
0.000 0.000 | 0.000 |
0.267 0.254 | 0.277 |
0.389 0.375 | 0.399 |
0.160 0.154 | 0.165 |
0.000 0.000 | 0.000 |
| 6 spectra, IVNTPEVIR | 0.000 | 0.000 | 0.194 | 0.000 | 0.206 | 0.438 | 0.162 | 0.000 | ||
| 1 spectrum, LPNSVLGK | 0.000 | 0.000 | 0.000 | 0.255 | 0.050 | 0.503 | 0.192 | 0.000 | ||
| 6 spectra, QEETQRPVQMVK | 0.000 | 0.000 | 0.162 | 0.101 | 0.340 | 0.186 | 0.211 | 0.000 | ||
| 3 spectra, MQDQLQAQDFSK | 0.033 | 0.051 | 0.148 | 0.000 | 0.084 | 0.503 | 0.180 | 0.000 | ||
| 3 spectra, ELVNNLAEIYGR | 0.000 | 0.000 | 0.277 | 0.023 | 0.354 | 0.238 | 0.109 | 0.000 | ||
| 5 spectra, LLPLEEYYR | 0.016 | 0.000 | 0.203 | 0.000 | 0.305 | 0.331 | 0.145 | 0.000 | ||
| 6 spectra, LADIDK | 0.000 | 0.000 | 0.113 | 0.000 | 0.208 | 0.455 | 0.224 | 0.000 | ||
| 6 spectra, EMPSVFGK | 0.033 | 0.000 | 0.171 | 0.000 | 0.211 | 0.491 | 0.094 | 0.000 | ||
| 4 spectra, YLLEQDFPGMR | 0.038 | 0.000 | 0.150 | 0.000 | 0.227 | 0.459 | 0.126 | 0.000 |
| Plot | Mito | Lyso or Perox | ER | Golgi | PM | Cytosol | Nucleus | ||||||
| Expt B |
2 peptides |
14 spectra |
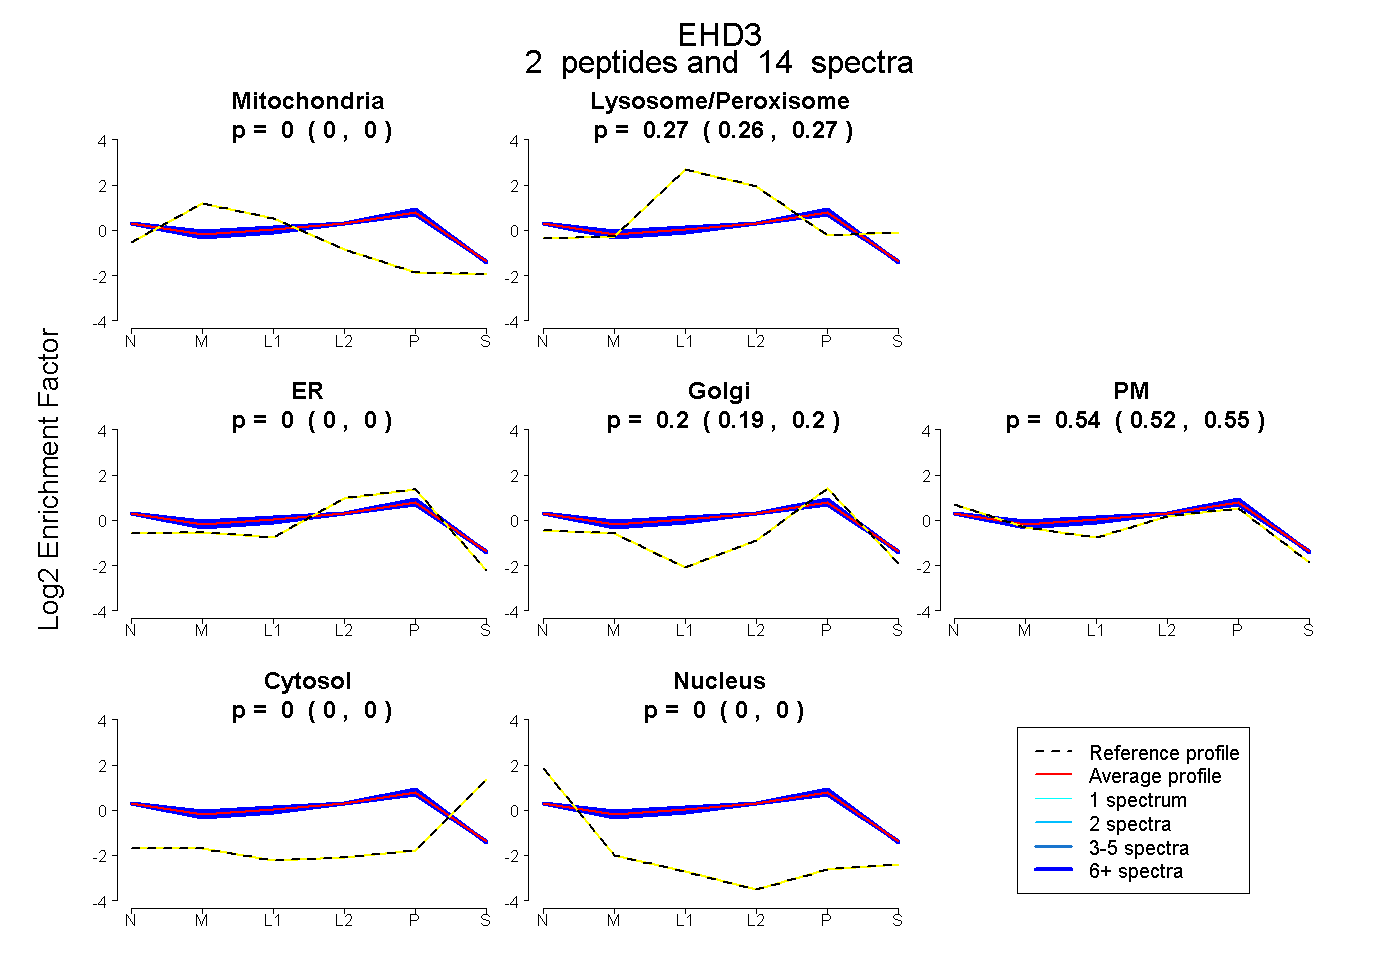 |
0.000 0.000 | 0.000 |
0.265 0.259 | 0.271 |
0.000 0.000 | 0.000 |
0.196 0.187 | 0.204 |
0.539 0.524 | 0.550 |
0.000 0.000 | 0.000 |
0.000 0.000 | 0.000 |
|||
| Plot | Lyso | Other | |||||||||||
| Expt C |
23 peptides |
288 spectra |
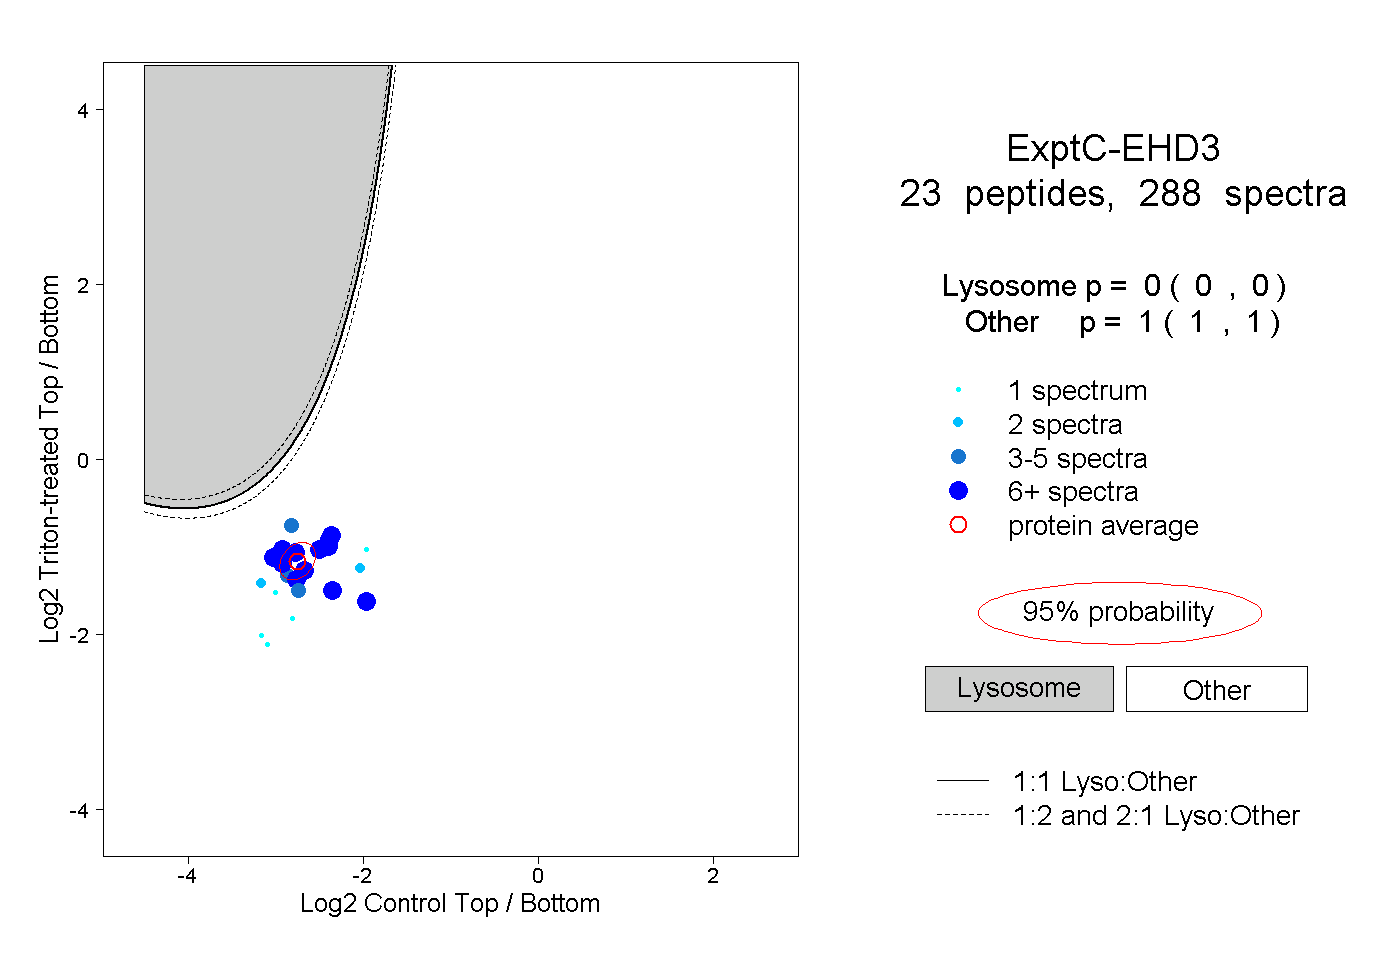 |
0.000 0.000 | 0.000 |
1.000 1.000 | 1.000 |
||||||||
| Plot | Lyso | Other | |||||||||||
| Expt D |
8 peptides |
13 spectra |
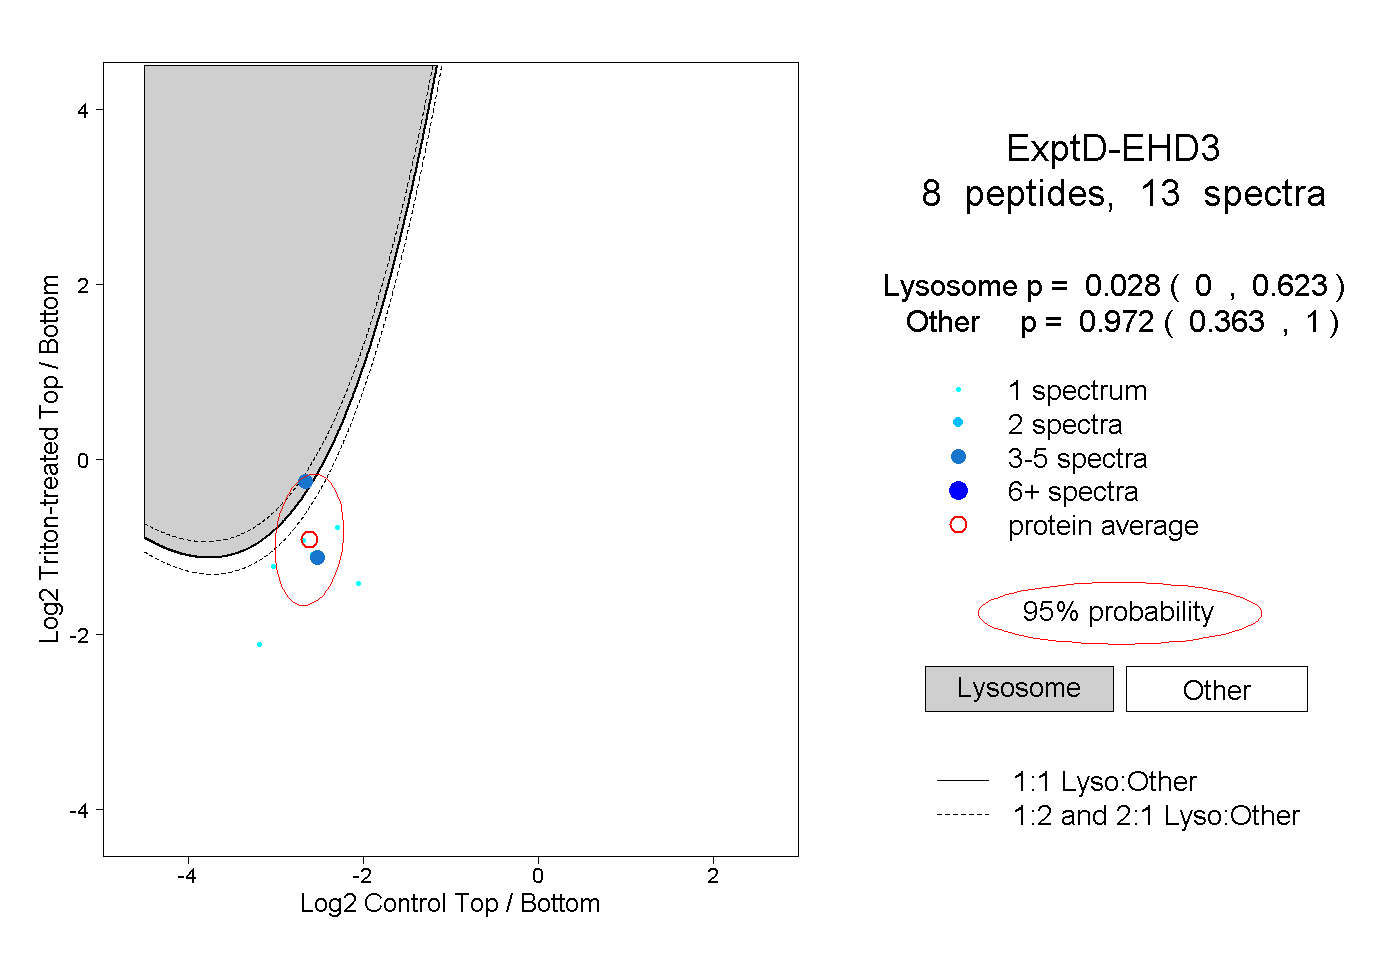 |
0.028 0.000 | 0.623 |
0.972 0.363 | 1.000 |