 6
6peptides
spectra
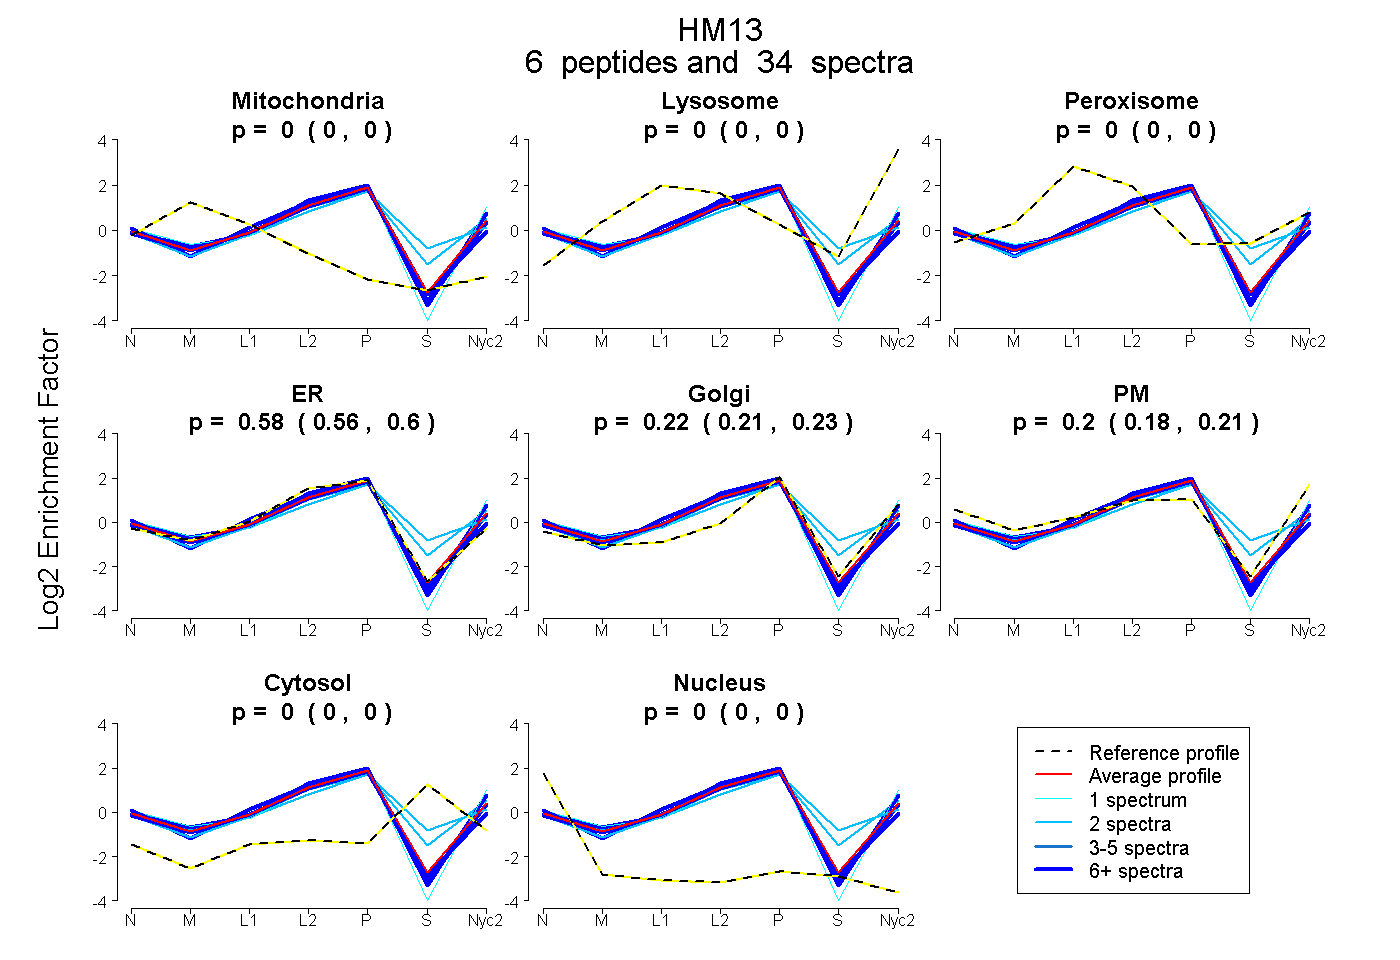
0.000 | 0.000
0.000 | 0.000
0.000 | 0.000
0.559 | 0.599
0.206 | 0.230
0.182 | 0.213
0.000 | 0.000
0.000 | 0.000
5peptides
spectra
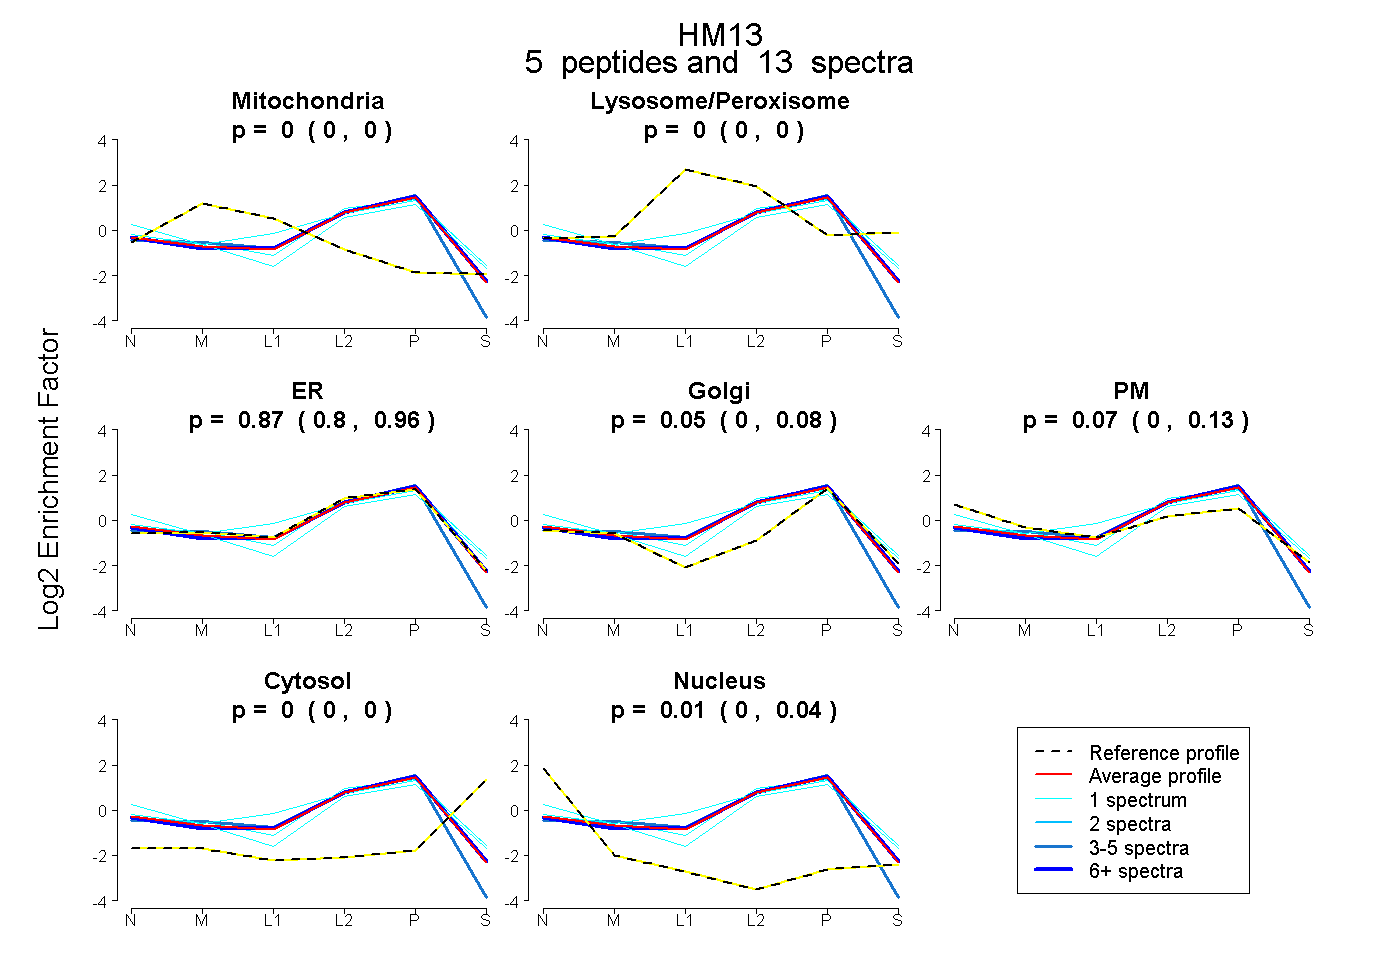
0.000 | 0.000
0.000 | 0.000
0.804 | 0.957
0.000 | 0.078
0.000 | 0.125
0.000 | 0.000
0.000 | 0.036
6peptides
spectra
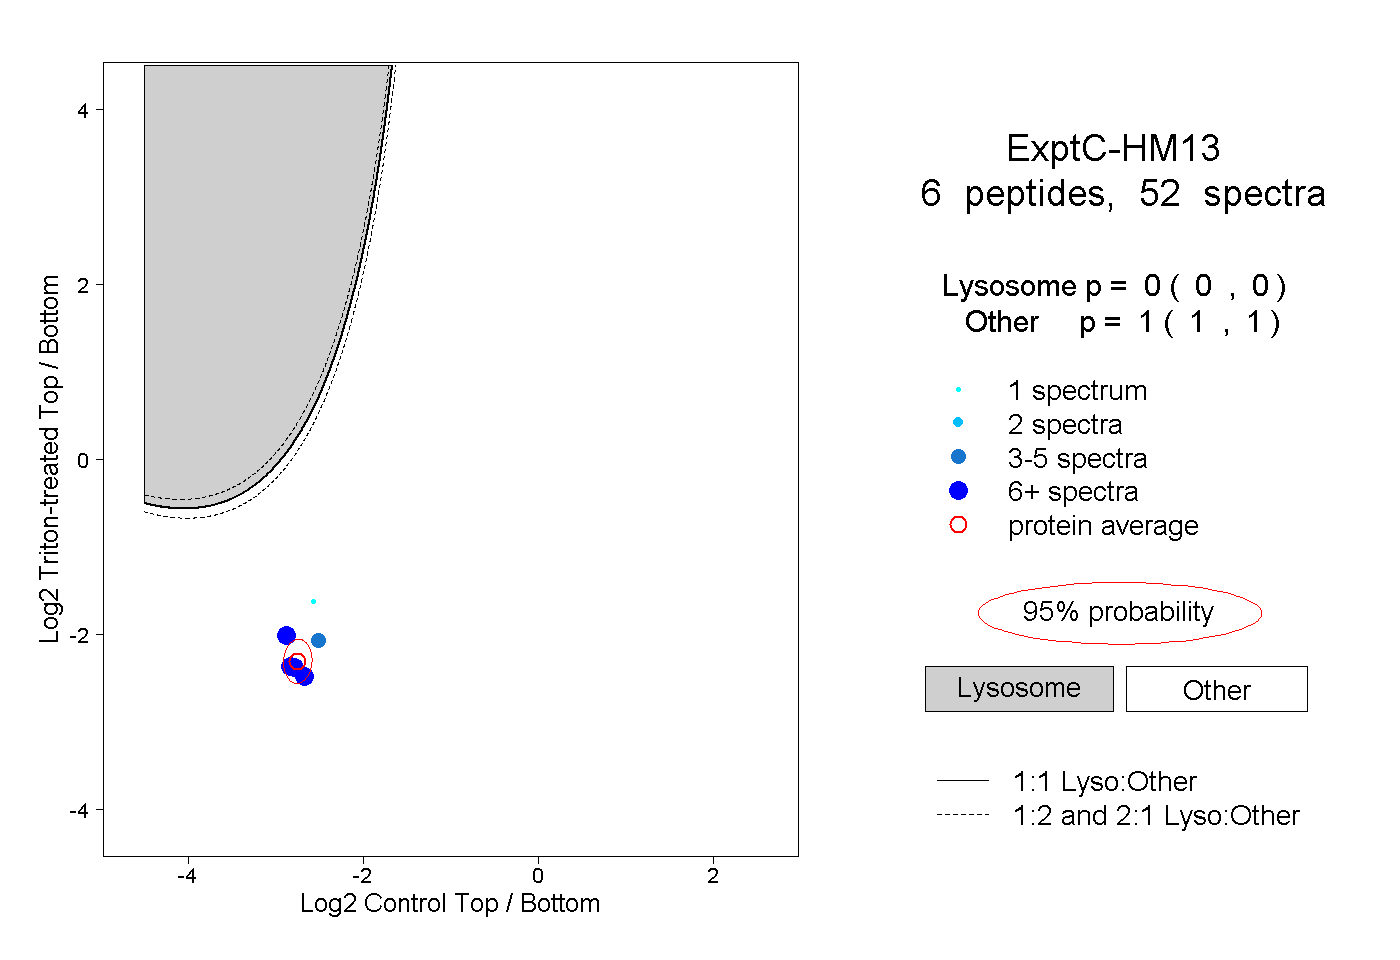
0.000 | 0.000
1.000 | 1.000
3peptides
spectra
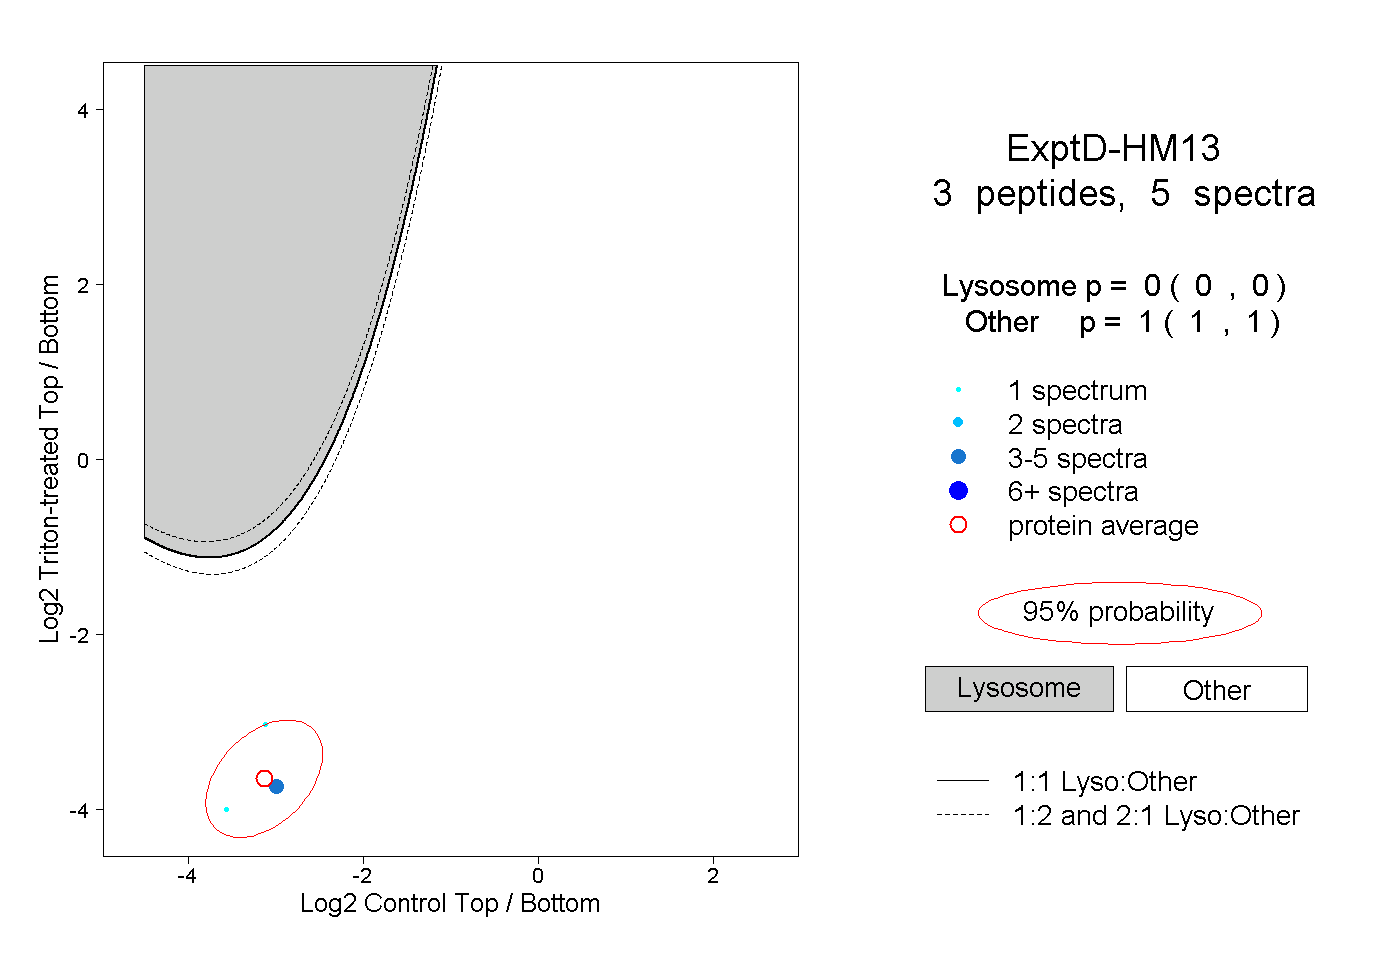
0.000 | 0.000
1.000 | 1.000