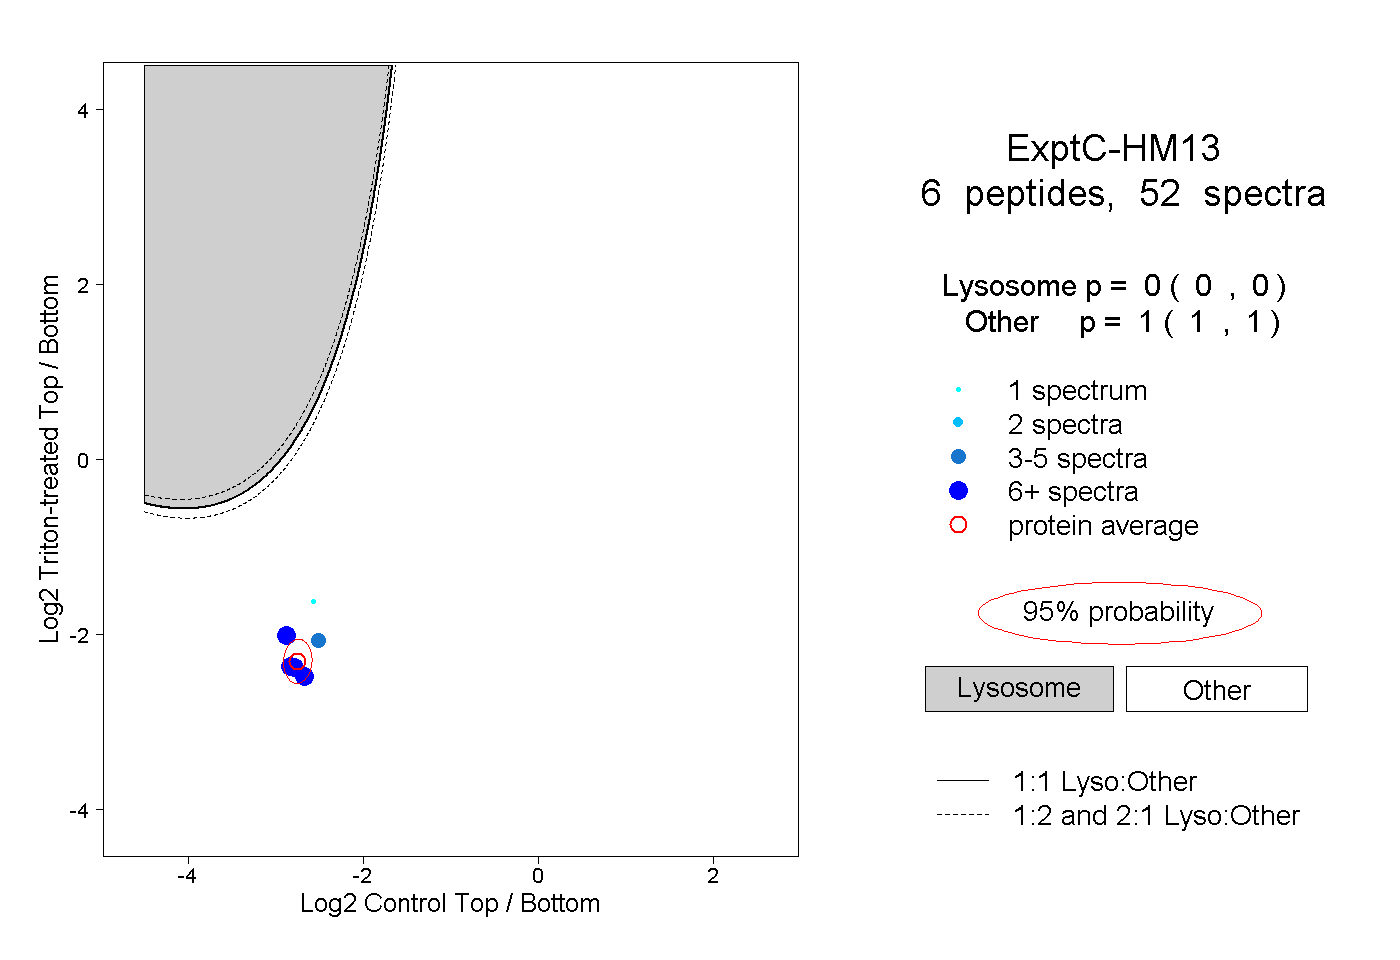
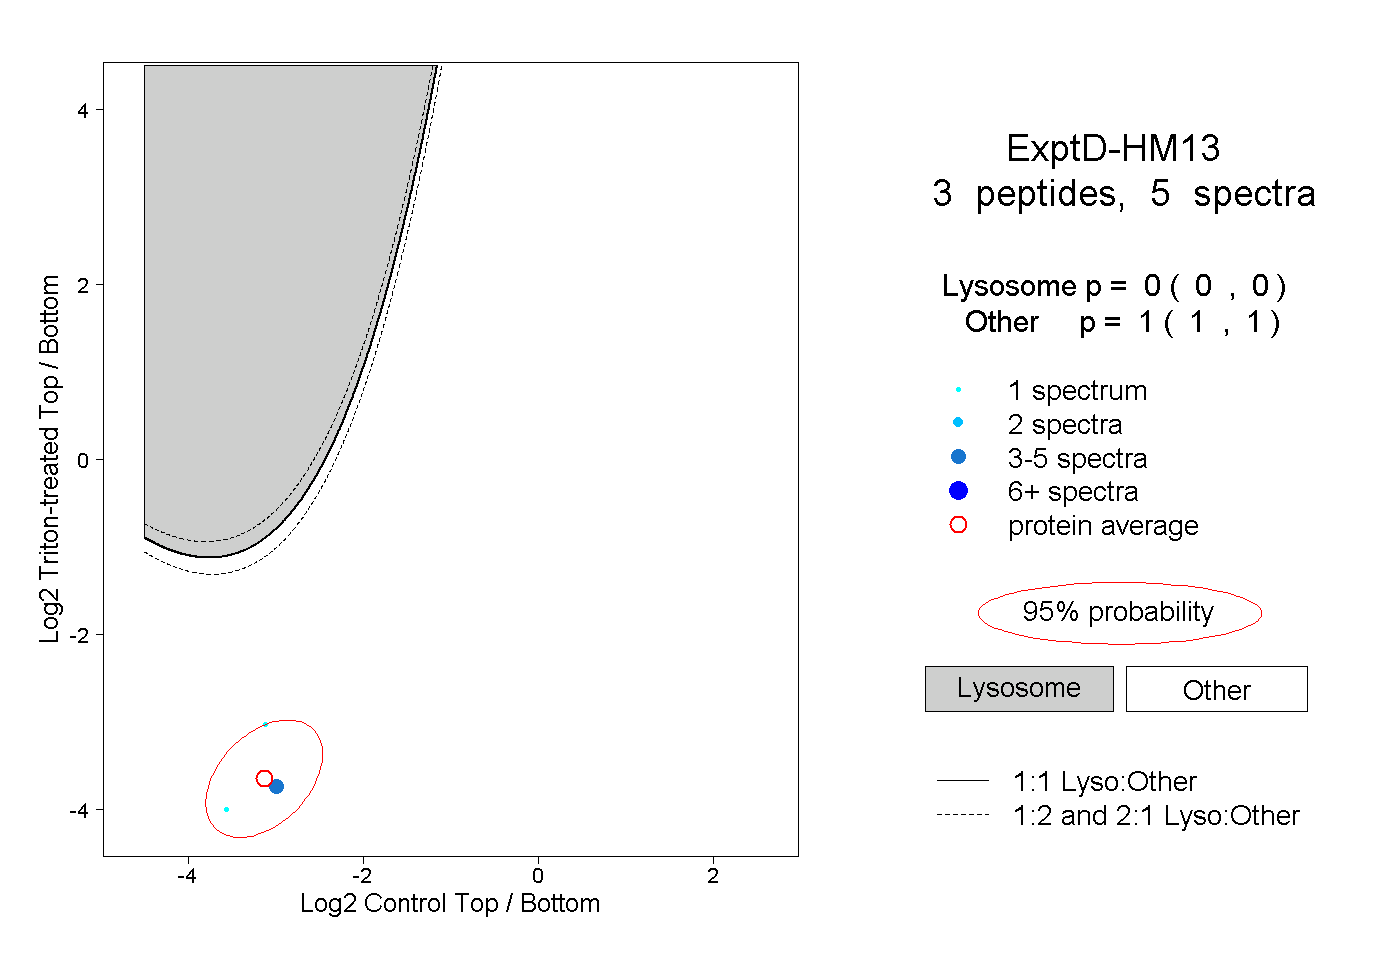
HM13
[ENSRNOP00000010251]
Main page
| | | Plot |
Mito |
Lyso |
|
Perox |
ER |
Golgi |
PM |
Cytosol |
Nucleus |
|
| Expt A |
 6
6
peptides |
34
spectra |
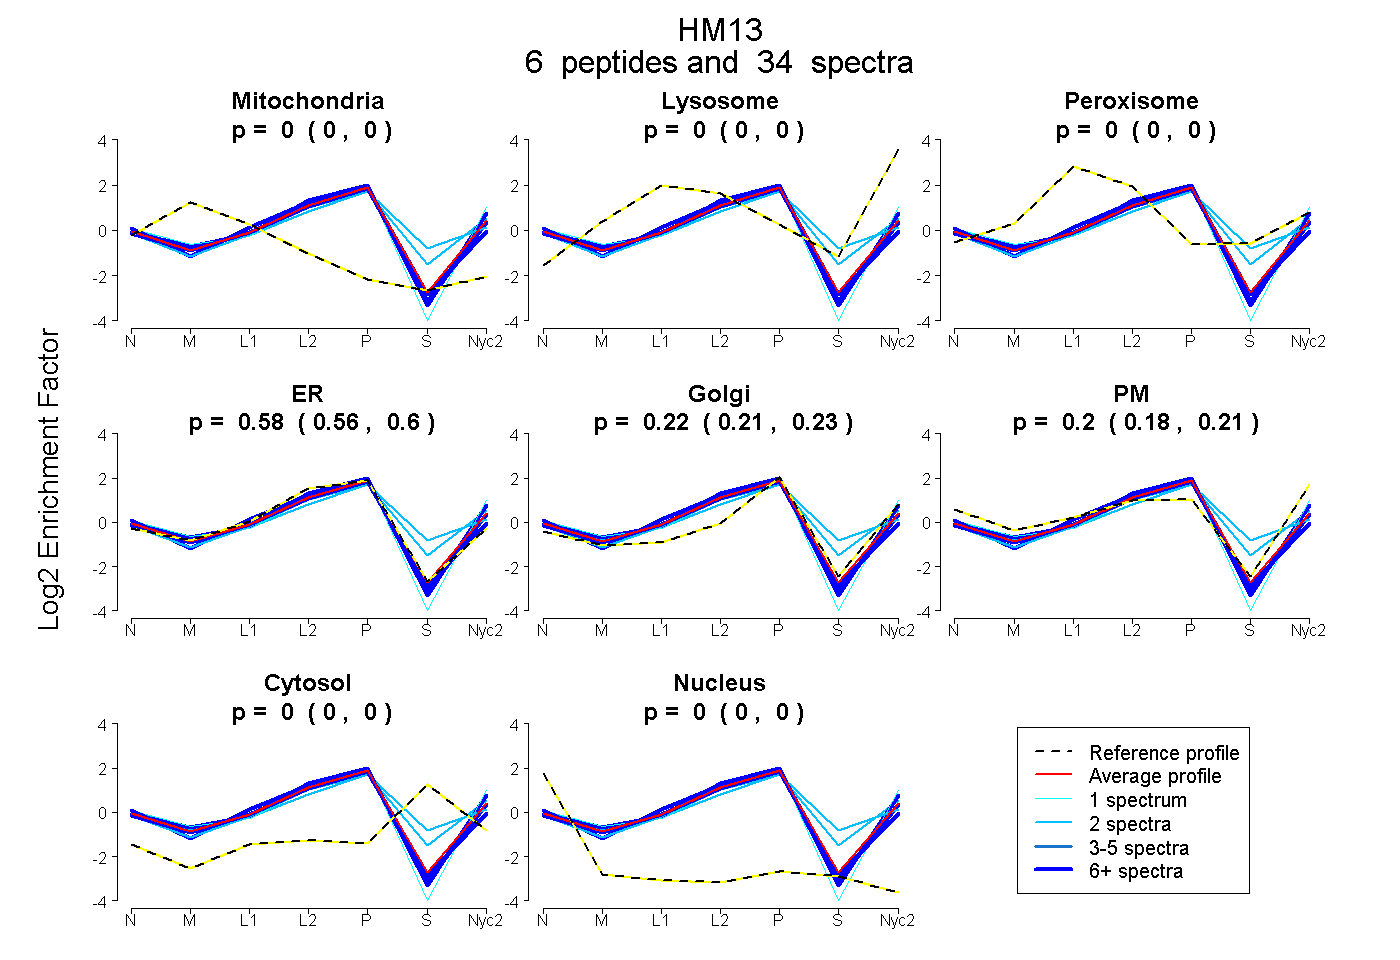 |
0.000
0.000 | 0.000 |
0.000
0.000 | 0.000 |
|
0.000
0.000 | 0.000 |
0.581
0.559 | 0.599 |
0.219
0.206 | 0.230 |
0.200
0.182 | 0.213 |
0.000
0.000 | 0.000 |
0.000
0.000 | 0.000 |
|
| | | Plot |
Mito |
|
Lyso or Perox |
|
ER |
Golgi |
PM |
Cytosol |
Nucleus |
|
| Expt B |
5
peptides |
13
spectra |
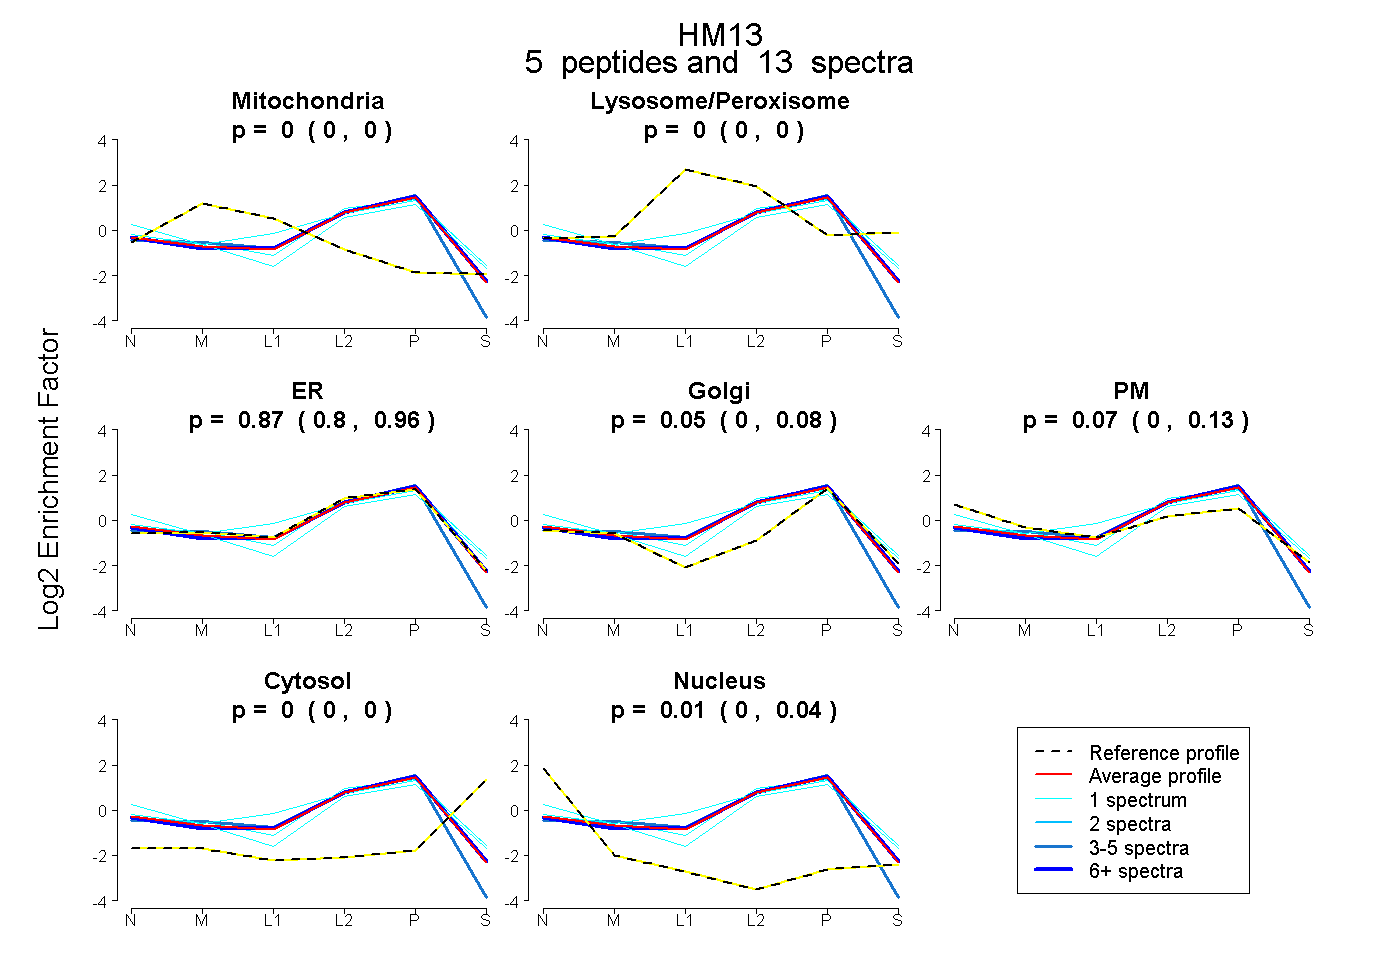 |
0.000
0.000 | 0.000 |
|
0.000
0.000 | 0.000 |
|
0.867
0.804 | 0.957 |
0.051
0.000 | 0.078 |
0.072
0.000 | 0.125 |
0.000
0.000 | 0.000 |
0.009
0.000 | 0.036 |
|
| 1 spectrum, SSSDMPETITSR |
0.000 |
|
0.000 |
|
0.344 |
0.257 |
0.398 |
0.001 |
0.000 |
|
| 1 spectrum, EEIINYEFDTK |
0.000 |
|
0.000 |
|
0.894 |
0.018 |
0.020 |
0.068 |
0.000 |
|
| 1 spectrum, SFEAPIK |
0.000 |
|
0.227 |
|
0.501 |
0.200 |
0.071 |
0.000 |
0.000 |
|
| 3 spectra, FFPANFPNR |
0.000 |
|
0.000 |
|
0.982 |
0.000 |
0.000 |
0.000 |
0.018 |
|
| 7 spectra, LVFPQDLLEK |
0.000 |
|
0.000 |
|
0.915 |
0.041 |
0.022 |
0.000 |
0.021 |
|
| | | Plot |
|
Lyso |
|
|
|
|
|
|
|
Other |
| Expt C |
6
peptides |
52
spectra |
 |
|
0.000
0.000 | 0.000 |
|
|
|
|
|
|
|
1.000
1.000 | 1.000 |
| | | Plot |
|
Lyso |
|
|
|
|
|
|
|
Other |
| Expt D |
3
peptides |
5
spectra |
 |
|
0.000
0.000 | 0.000 |
|
|
|
|
|
|
|
1.000
1.000 | 1.000 |