 6
6peptides
spectra
0.000 | 0.000
0.000 | 0.000
0.000 | 0.000
0.559 | 0.599
0.206 | 0.230
0.182 | 0.213
0.000 | 0.000
0.000 | 0.000
| Plot | Mito | Lyso | Perox | ER | Golgi | PM | Cytosol | Nucleus | |||||
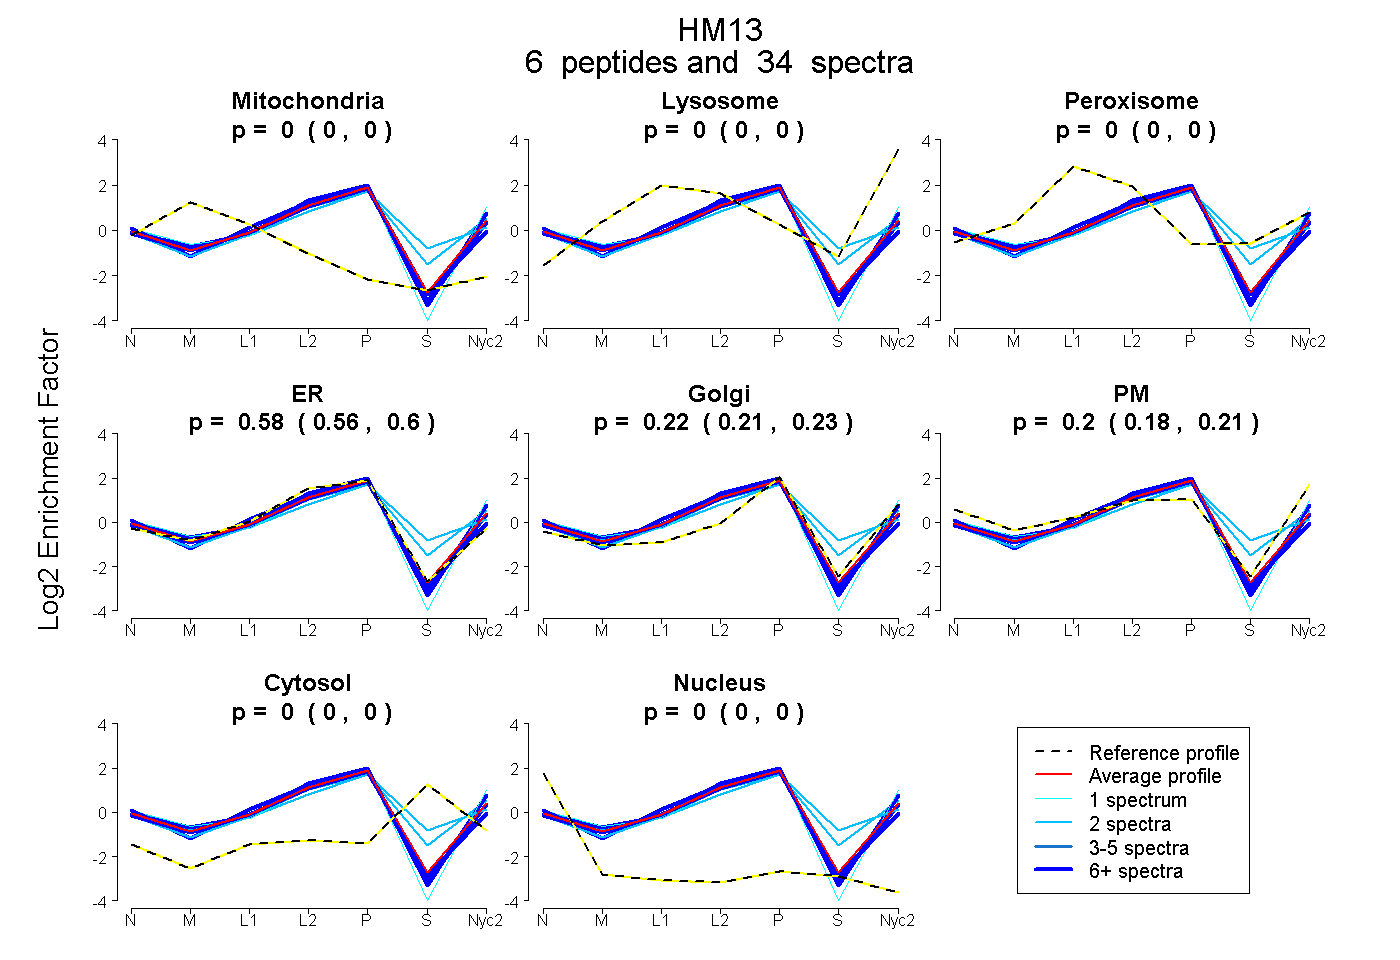
| Expt A |
6 peptides |
34 spectra |
|
0.000 0.000 | 0.000 |
0.000 0.000 | 0.000 |
0.000 0.000 | 0.000 |
0.581 0.559 | 0.599 |
0.219 0.206 | 0.230 |
0.200 0.182 | 0.213 |
0.000 0.000 | 0.000 |
0.000 0.000 | 0.000 |
| 11 spectra, SSSDMPETITSR | 0.000 | 0.000 | 0.000 | 0.748 | 0.167 | 0.063 | 0.000 | 0.023 | ||
| 2 spectra, EEIINYEFDTK | 0.000 | 0.000 | 0.070 | 0.311 | 0.315 | 0.214 | 0.090 | 0.000 | ||
| 2 spectra, SFEAPIK | 0.000 | 0.020 | 0.063 | 0.533 | 0.130 | 0.051 | 0.202 | 0.000 | ||
| 12 spectra, FFPANFPNR | 0.000 | 0.000 | 0.000 | 0.551 | 0.164 | 0.285 | 0.000 | 0.000 | ||
| 6 spectra, LVFPQDLLEK | 0.000 | 0.000 | 0.000 | 0.686 | 0.119 | 0.195 | 0.000 | 0.000 | ||
| 1 spectrum, GEVAEMFSYEESNPK | 0.000 | 0.000 | 0.000 | 0.389 | 0.245 | 0.367 | 0.000 | 0.000 |
| Plot | Mito | Lyso or Perox | ER | Golgi | PM | Cytosol | Nucleus | ||||||
| Expt B |
5 peptides |
13 spectra |
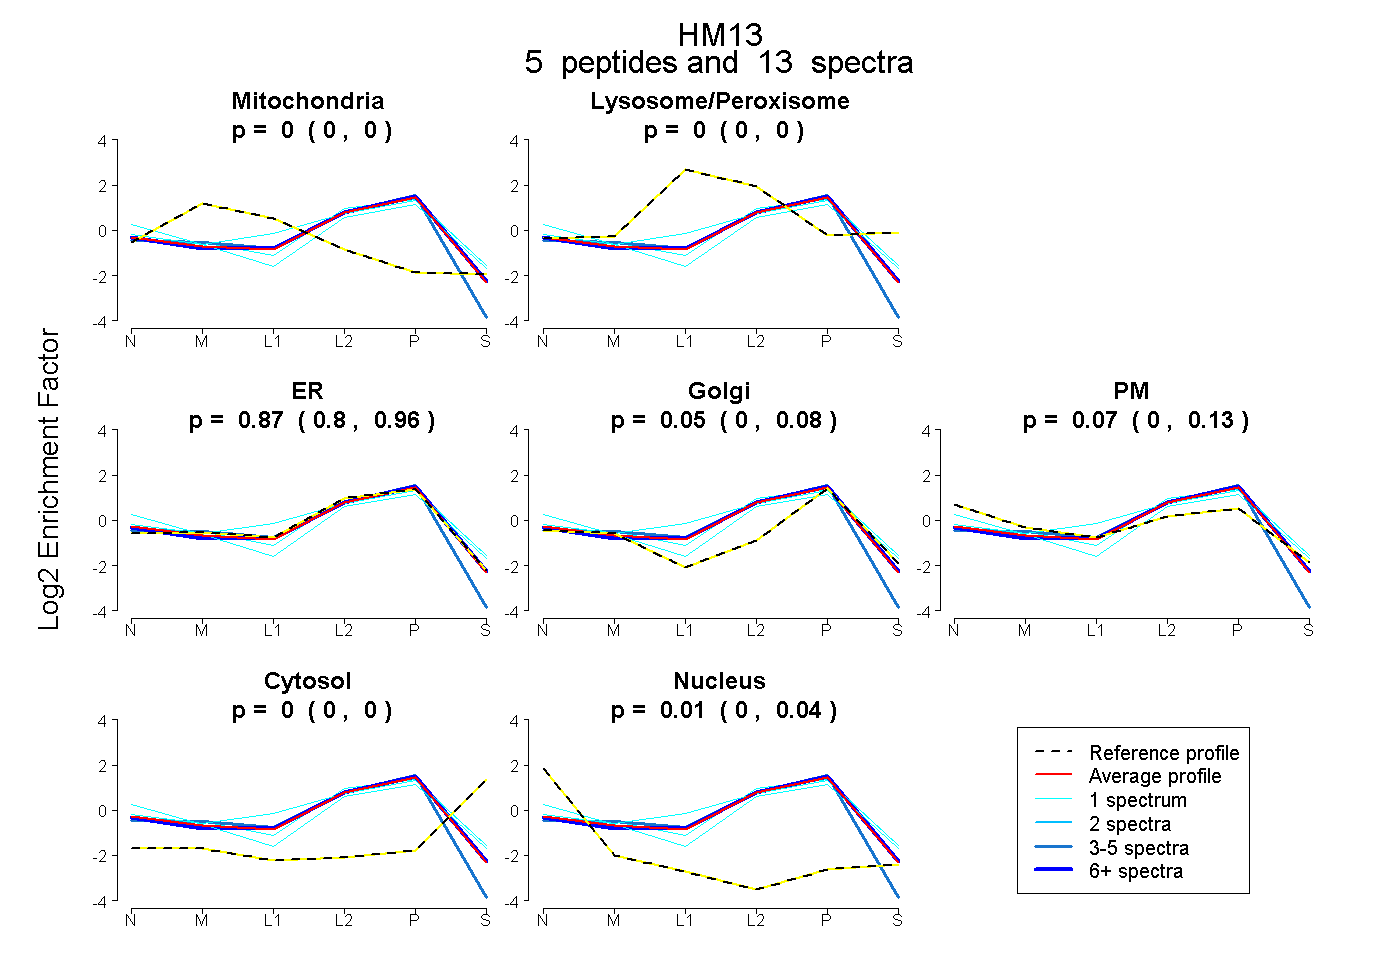 |
0.000 0.000 | 0.000 |
0.000 0.000 | 0.000 |
0.867 0.804 | 0.957 |
0.051 0.000 | 0.078 |
0.072 0.000 | 0.125 |
0.000 0.000 | 0.000 |
0.009 0.000 | 0.036 |
|||
| Plot | Lyso | Other | |||||||||||
| Expt C |
6 peptides |
52 spectra |
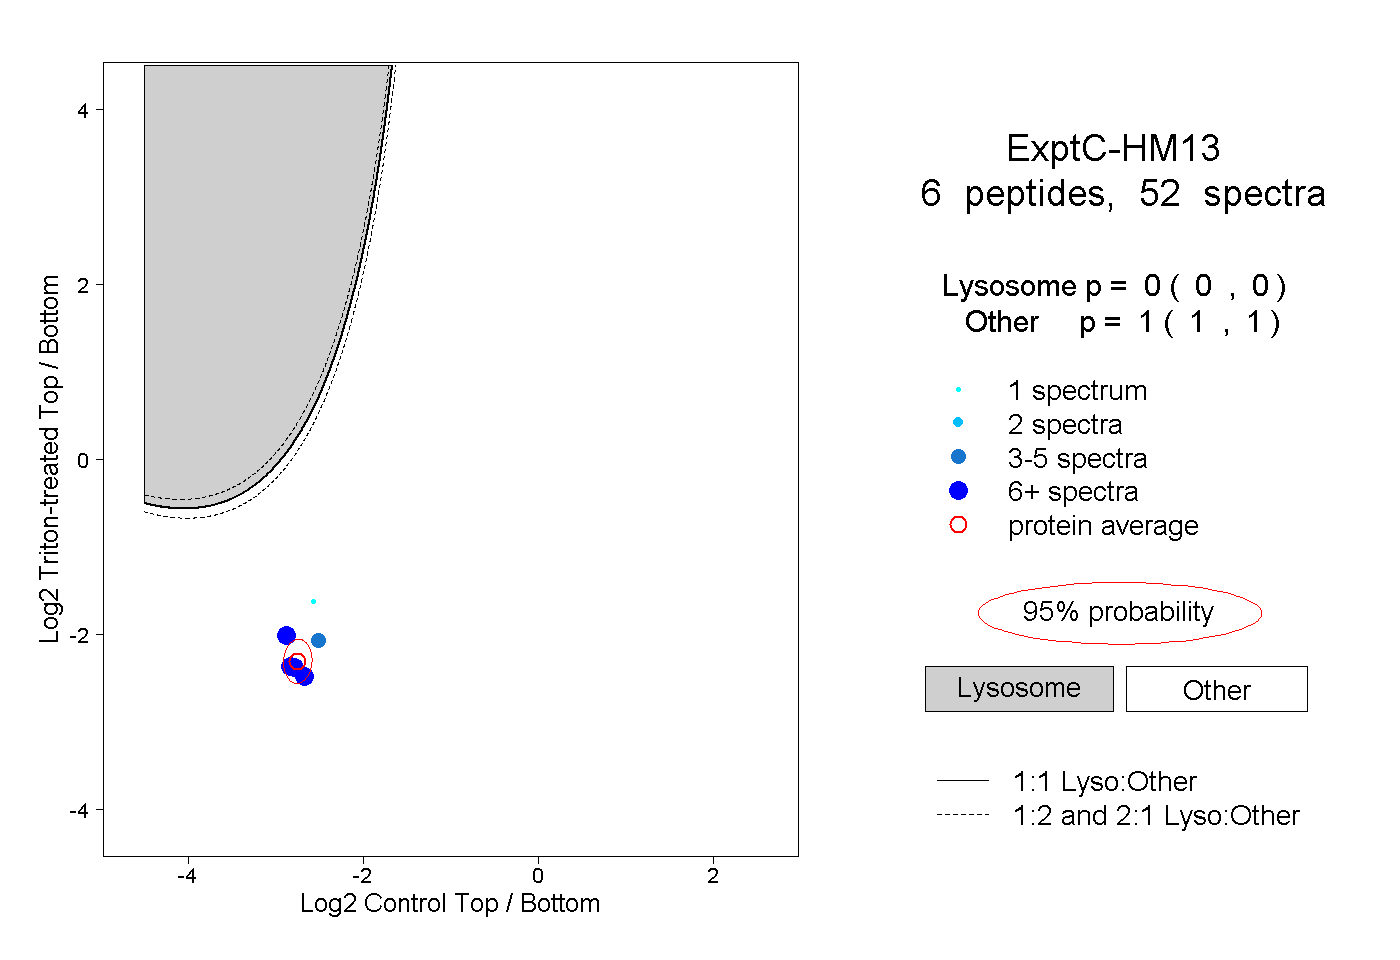 |
0.000 0.000 | 0.000 |
1.000 1.000 | 1.000 |
||||||||
| Plot | Lyso | Other | |||||||||||
| Expt D |
3 peptides |
5 spectra |
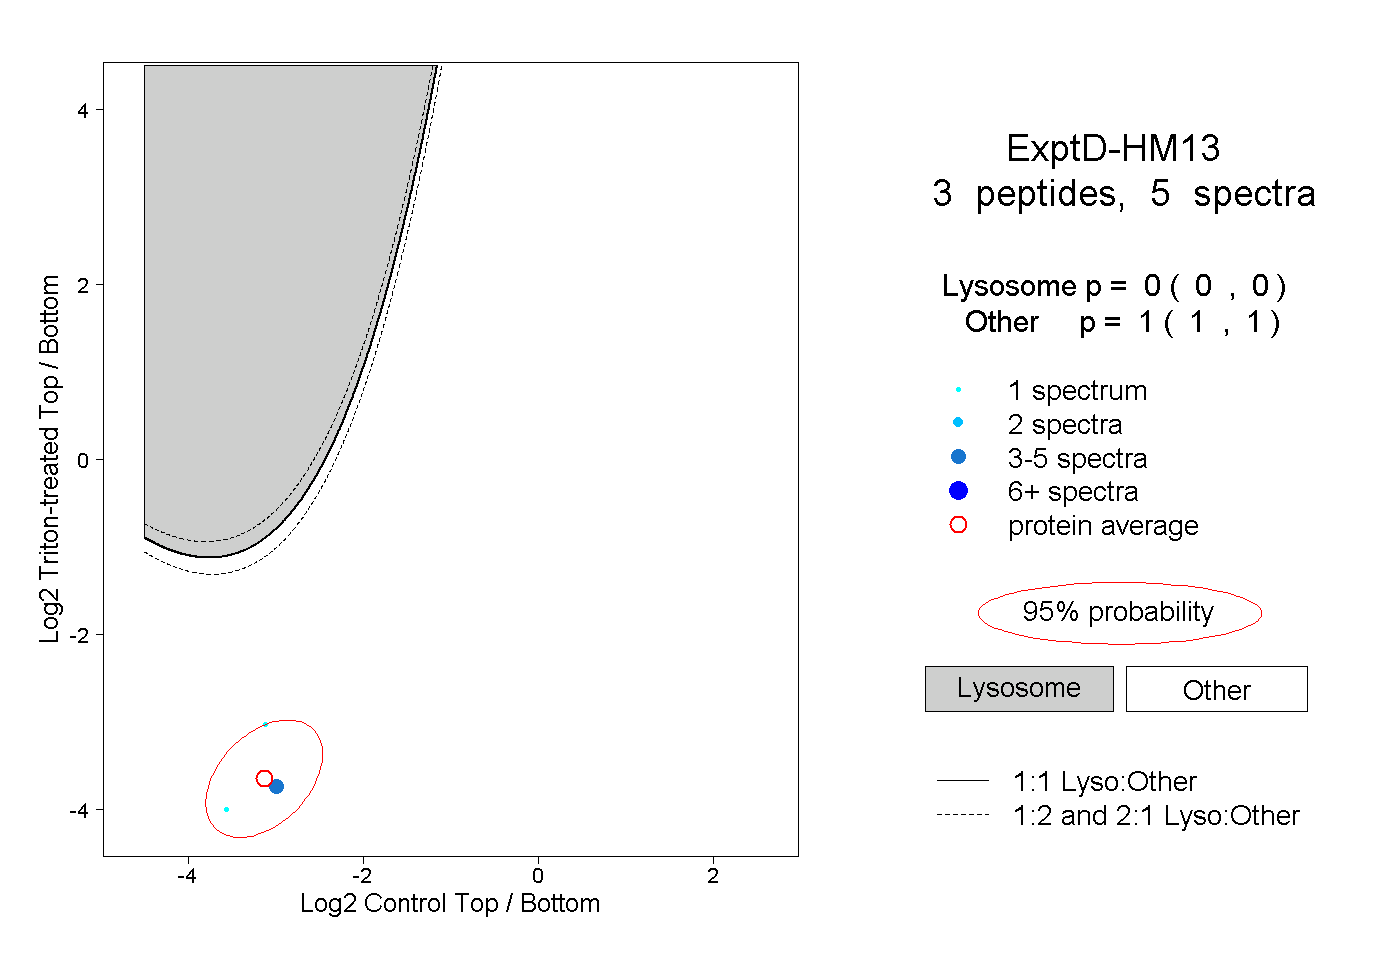 |
0.000 0.000 | 0.000 |
1.000 1.000 | 1.000 |