 21
21peptides
spectra
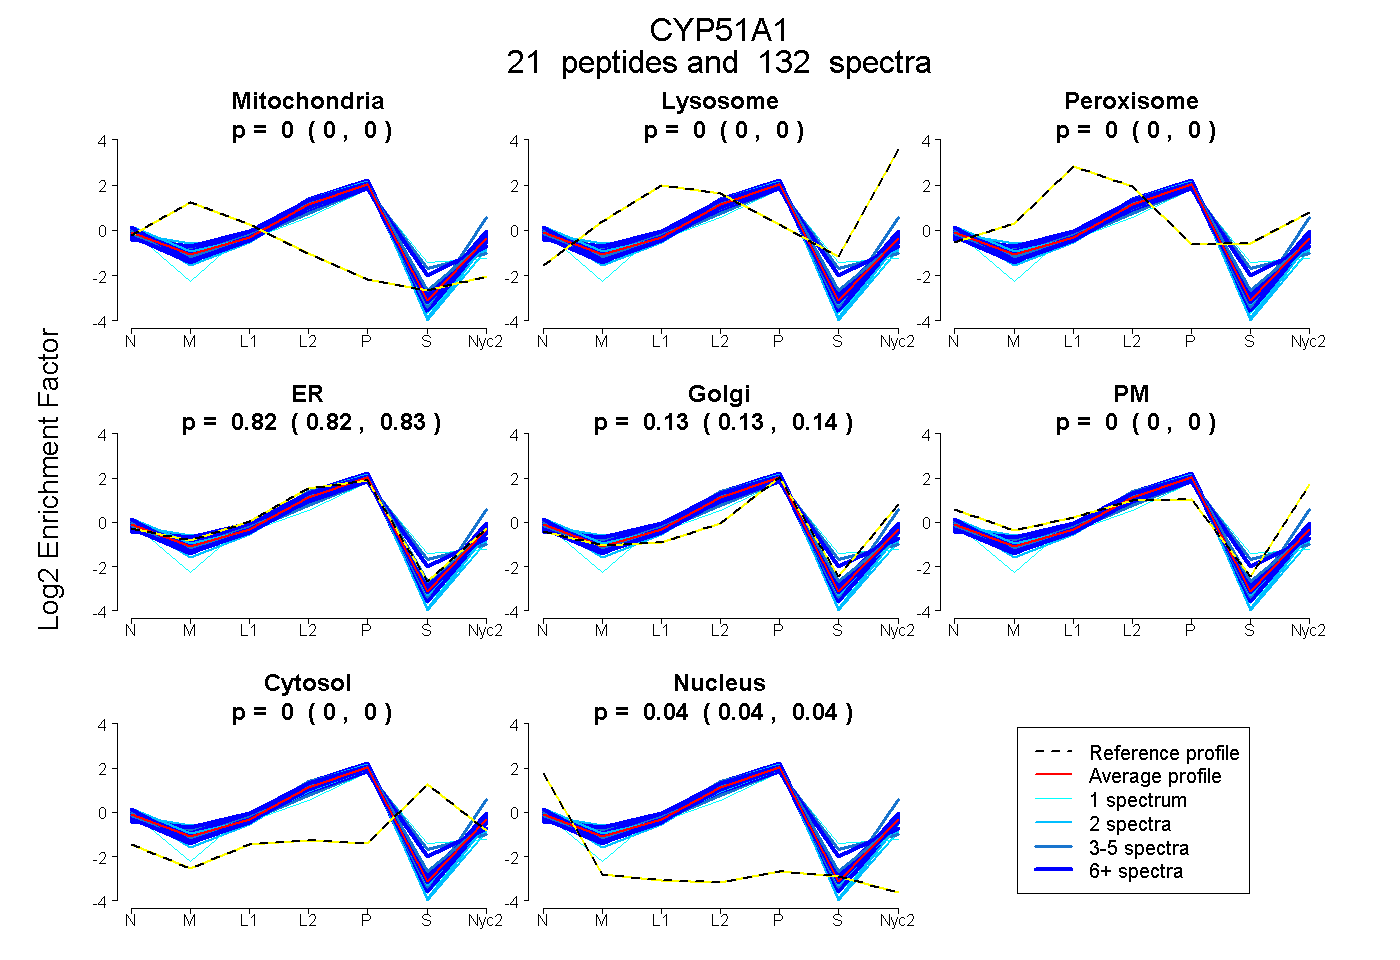
0.000 | 0.000
0.000 | 0.000
0.000 | 0.000
0.821 | 0.828
0.128 | 0.136
0.000 | 0.000
0.000 | 0.000
0.041 | 0.043
18peptides
spectra
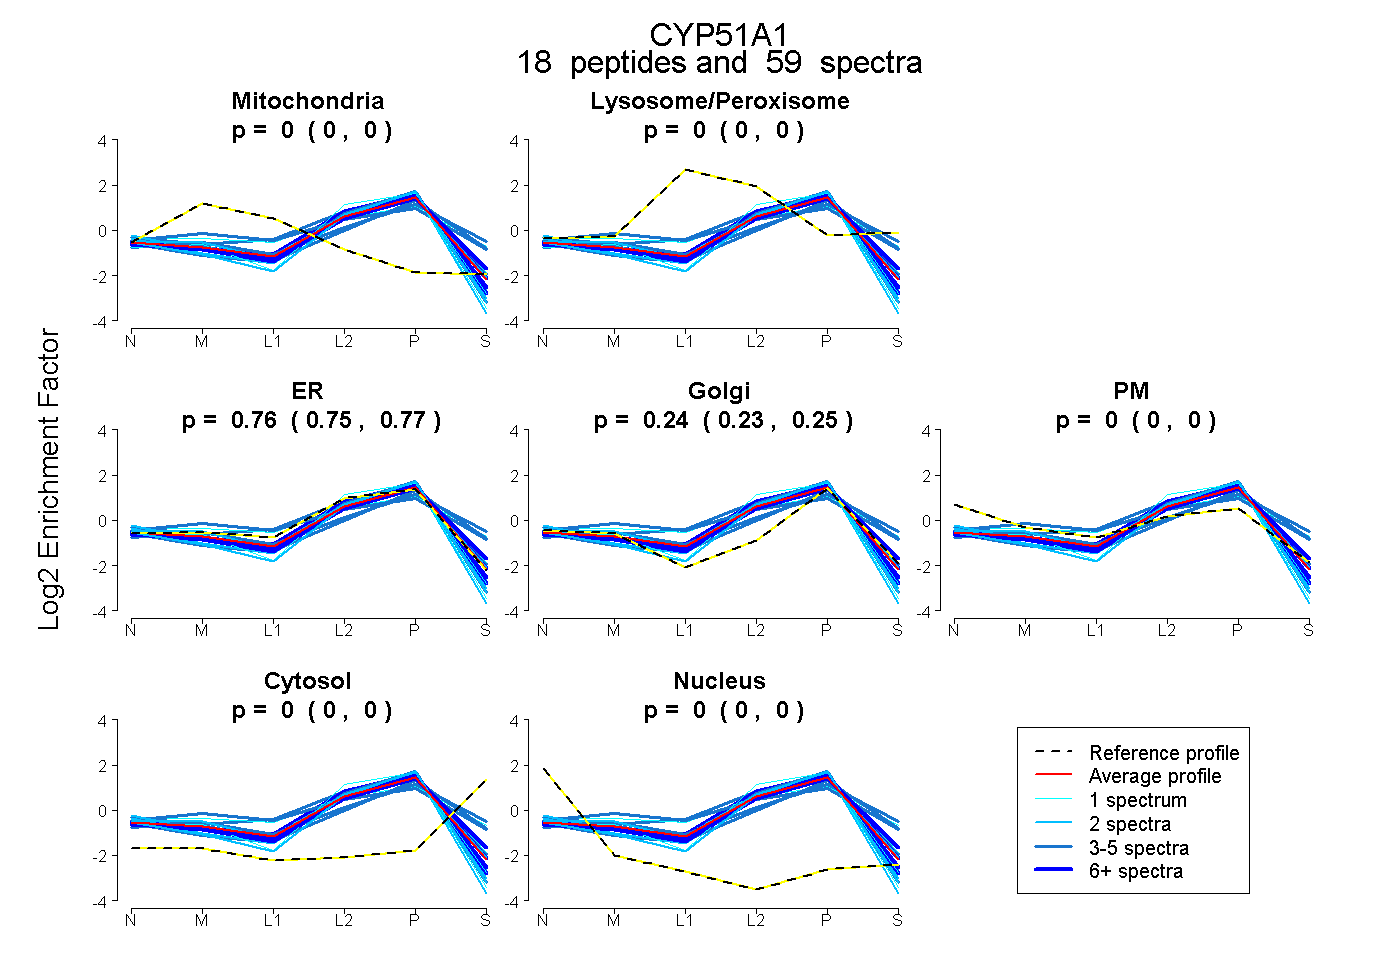
0.000 | 0.000
0.000 | 0.000
0.750 | 0.765
0.233 | 0.248
0.000 | 0.000
0.000 | 0.000
0.000 | 0.000
20peptides
spectra
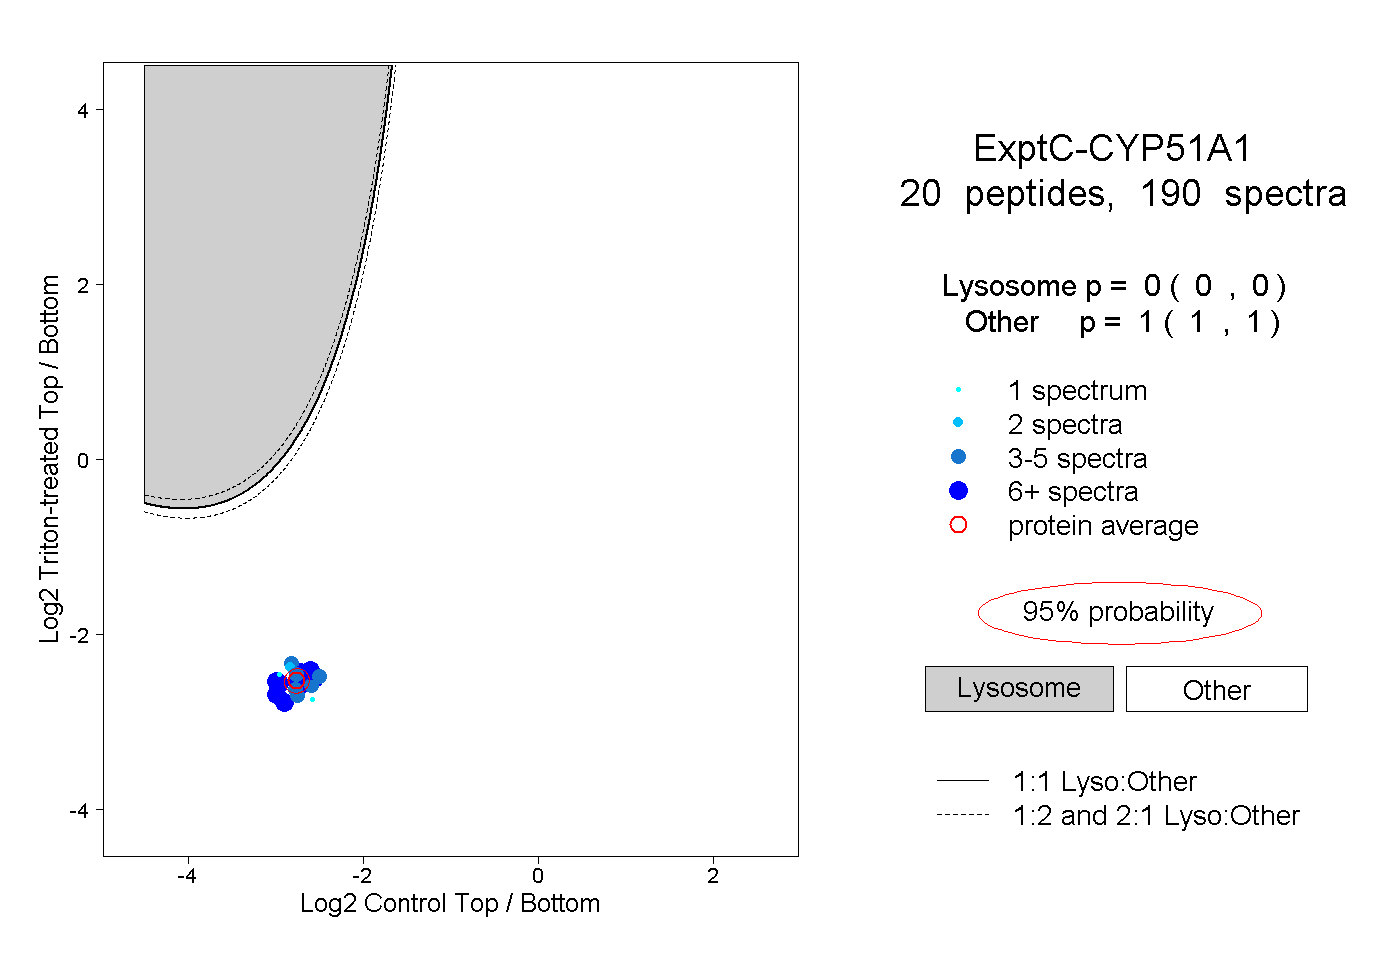
0.000 | 0.000
1.000 | 1.000
7peptides
spectra
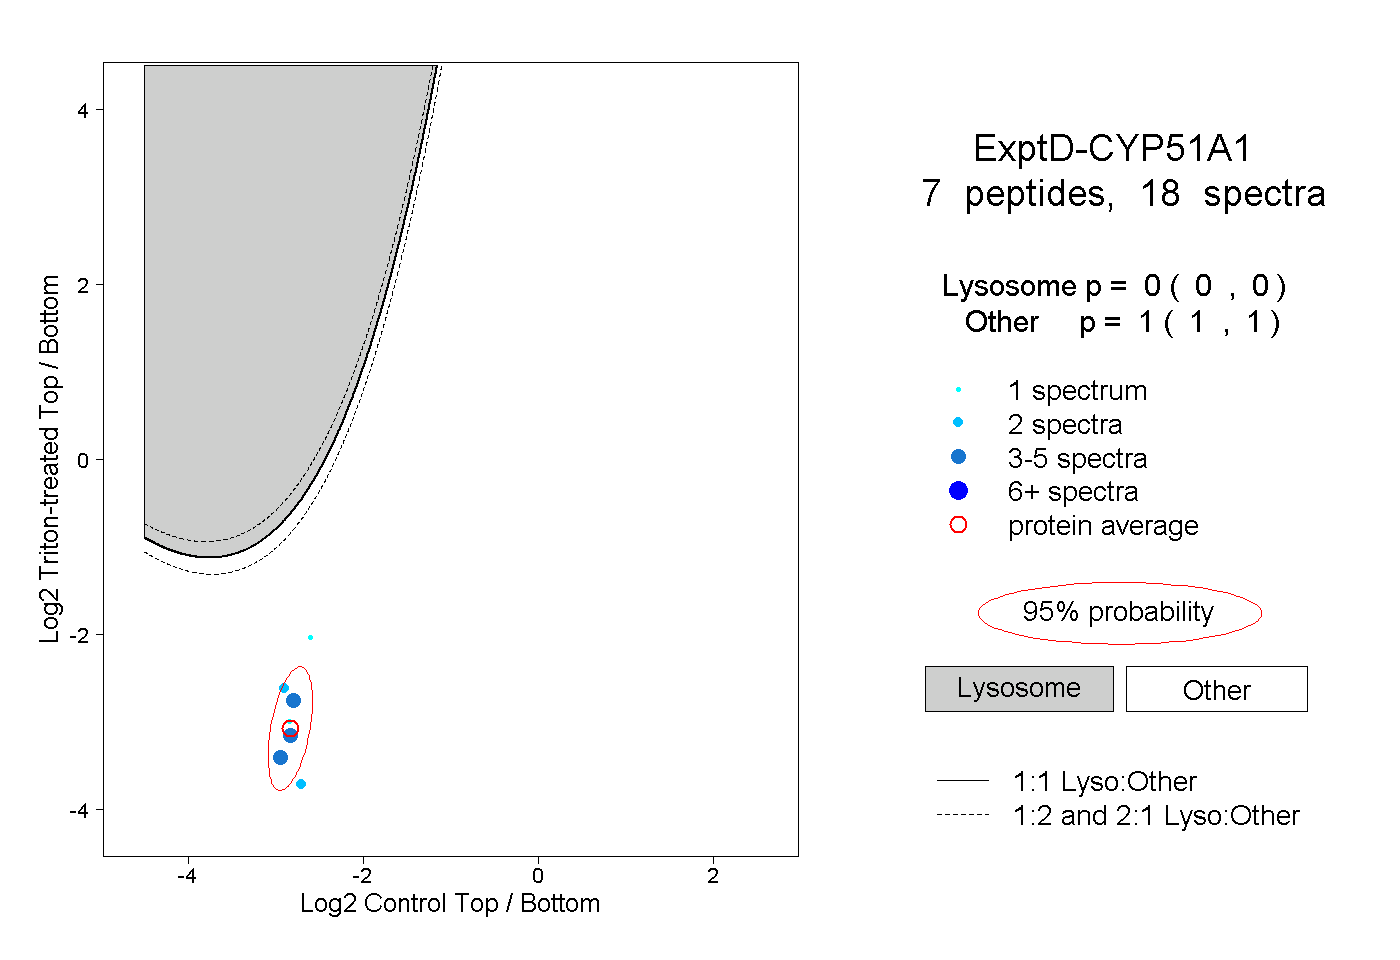
0.000 | 0.000
1.000 | 1.000