 21
21peptides
spectra
0.000 | 0.000
0.000 | 0.000
0.000 | 0.000
0.821 | 0.828
0.128 | 0.136
0.000 | 0.000
0.000 | 0.000
0.041 | 0.043
| Plot | Mito | Lyso | Perox | ER | Golgi | PM | Cytosol | Nucleus | |||||
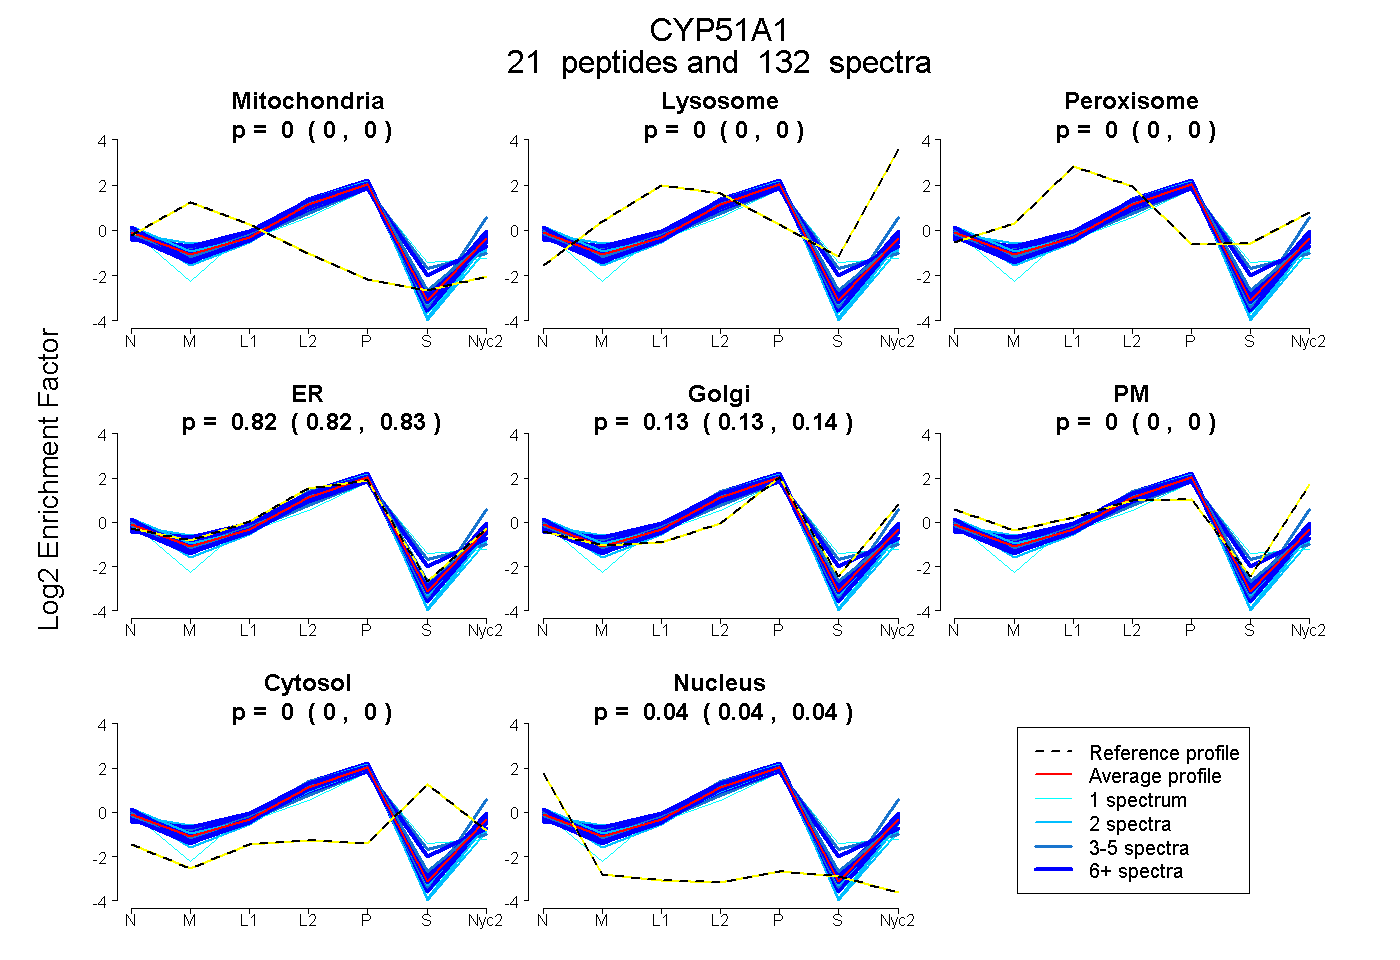
| Expt A |
21 peptides |
132 spectra |
|
0.000 0.000 | 0.000 |
0.000 0.000 | 0.000 |
0.000 0.000 | 0.000 |
0.825 0.821 | 0.828 |
0.133 0.128 | 0.136 |
0.000 0.000 | 0.000 |
0.000 0.000 | 0.000 |
0.042 0.041 | 0.043 |
| 12 spectra, NEDLNAEEVYGR | 0.000 | 0.000 | 0.000 | 0.830 | 0.123 | 0.000 | 0.000 | 0.046 | ||
| 9 spectra, CYLEQK | 0.000 | 0.000 | 0.000 | 0.811 | 0.145 | 0.000 | 0.000 | 0.044 | ||
| 6 spectra, TIWSTMLR | 0.000 | 0.000 | 0.000 | 0.873 | 0.127 | 0.000 | 0.000 | 0.000 | ||
| 10 spectra, LDFNPDR | 0.000 | 0.000 | 0.000 | 0.782 | 0.175 | 0.001 | 0.000 | 0.041 | ||
| 2 spectra, CIGENFAYVQIK | 0.000 | 0.000 | 0.000 | 0.899 | 0.000 | 0.000 | 0.000 | 0.101 | ||
| 6 spectra, DLNLLDR | 0.000 | 0.000 | 0.000 | 0.893 | 0.066 | 0.000 | 0.000 | 0.041 | ||
| 1 spectrum, GVAYDVPNAVFLEQK | 0.005 | 0.000 | 0.000 | 0.772 | 0.000 | 0.000 | 0.181 | 0.042 | ||
| 10 spectra, YLQDNPASGEK | 0.000 | 0.000 | 0.000 | 0.805 | 0.117 | 0.000 | 0.000 | 0.079 | ||
| 5 spectra, TVCGEDLPPLTYEQLK | 0.000 | 0.000 | 0.000 | 0.782 | 0.161 | 0.000 | 0.000 | 0.057 | ||
| 3 spectra, SQLNEK | 0.000 | 0.000 | 0.000 | 0.842 | 0.131 | 0.000 | 0.000 | 0.027 | ||
| 6 spectra, SPIEFLENAYEK | 0.000 | 0.000 | 0.000 | 0.829 | 0.028 | 0.000 | 0.102 | 0.041 | ||
| 2 spectra, DSWVER | 0.000 | 0.000 | 0.000 | 0.860 | 0.065 | 0.000 | 0.000 | 0.075 | ||
| 2 spectra, YGPVFSFTMVGK | 0.000 | 0.000 | 0.000 | 0.800 | 0.132 | 0.000 | 0.000 | 0.068 | ||
| 4 spectra, QYVSIIEK | 0.000 | 0.000 | 0.000 | 0.634 | 0.147 | 0.219 | 0.000 | 0.000 | ||
| 2 spectra, LTTPVFGK | 0.000 | 0.000 | 0.000 | 0.956 | 0.000 | 0.000 | 0.000 | 0.044 | ||
| 2 spectra, DKPLQDK | 0.000 | 0.000 | 0.000 | 0.847 | 0.100 | 0.000 | 0.000 | 0.052 | ||
| 10 spectra, SWGESGER | 0.000 | 0.000 | 0.000 | 0.828 | 0.151 | 0.000 | 0.000 | 0.022 | ||
| 17 spectra, FAYVPFGAGR | 0.000 | 0.000 | 0.000 | 0.816 | 0.155 | 0.000 | 0.000 | 0.029 | ||
| 19 spectra, LRPPIMTMMR | 0.000 | 0.000 | 0.000 | 0.837 | 0.152 | 0.000 | 0.000 | 0.011 | ||
| 3 spectra, LAVGHMVQLPAGAK | 0.000 | 0.000 | 0.000 | 0.822 | 0.000 | 0.000 | 0.134 | 0.044 | ||
| 1 spectrum, EPAEDILQTLLDSTYK | 0.000 | 0.000 | 0.000 | 0.921 | 0.000 | 0.000 | 0.000 | 0.079 |
| Plot | Mito | Lyso or Perox | ER | Golgi | PM | Cytosol | Nucleus | ||||||
| Expt B |
18 peptides |
59 spectra |
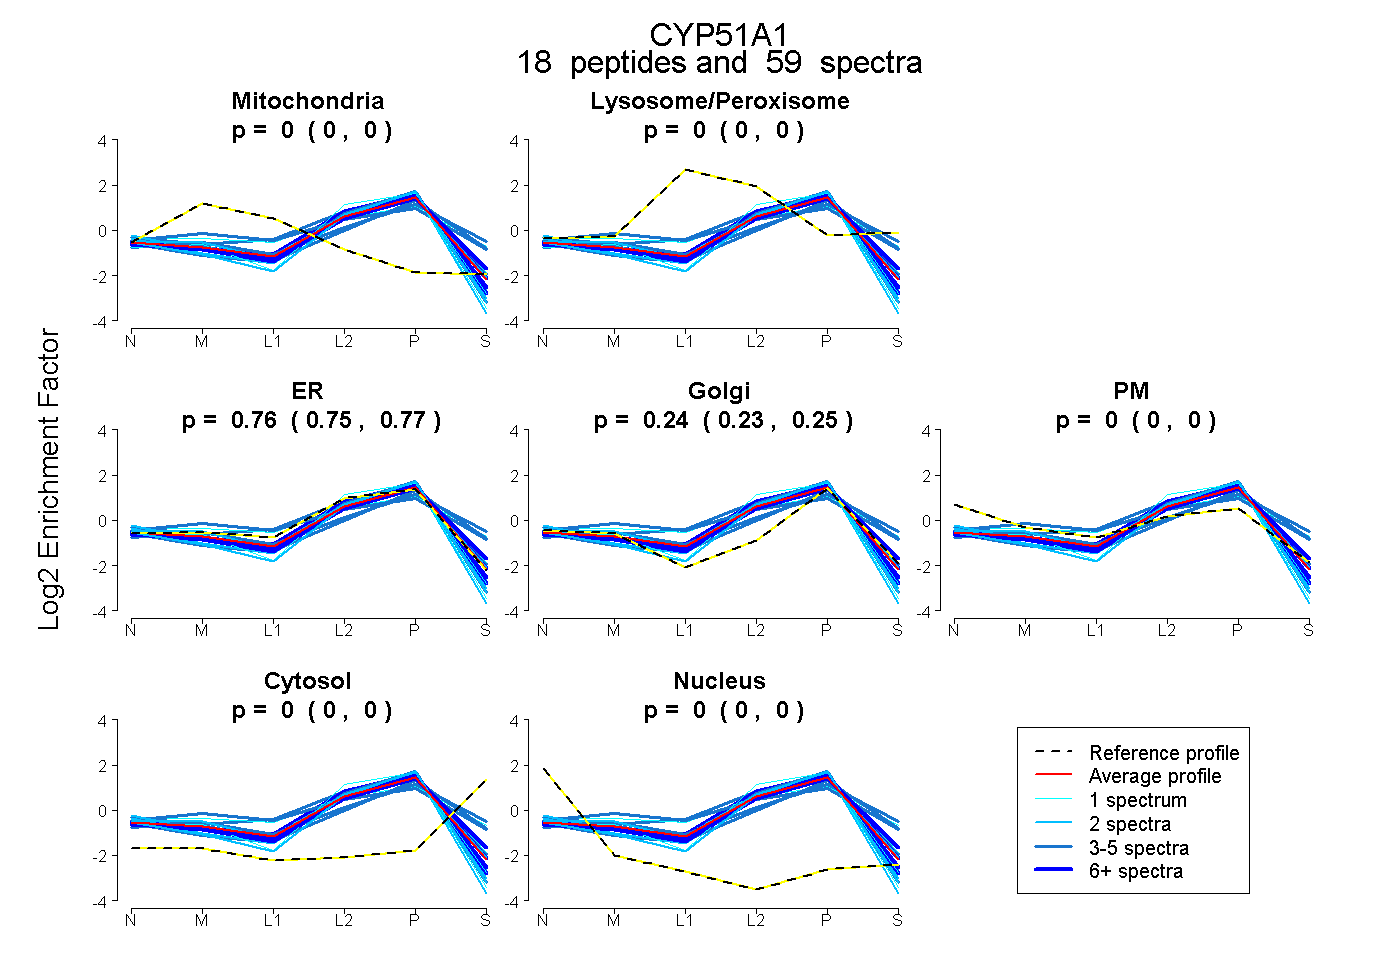 |
0.000 0.000 | 0.000 |
0.000 0.000 | 0.000 |
0.758 0.750 | 0.765 |
0.242 0.233 | 0.248 |
0.000 0.000 | 0.000 |
0.000 0.000 | 0.000 |
0.000 0.000 | 0.000 |
|||
| Plot | Lyso | Other | |||||||||||
| Expt C |
20 peptides |
190 spectra |
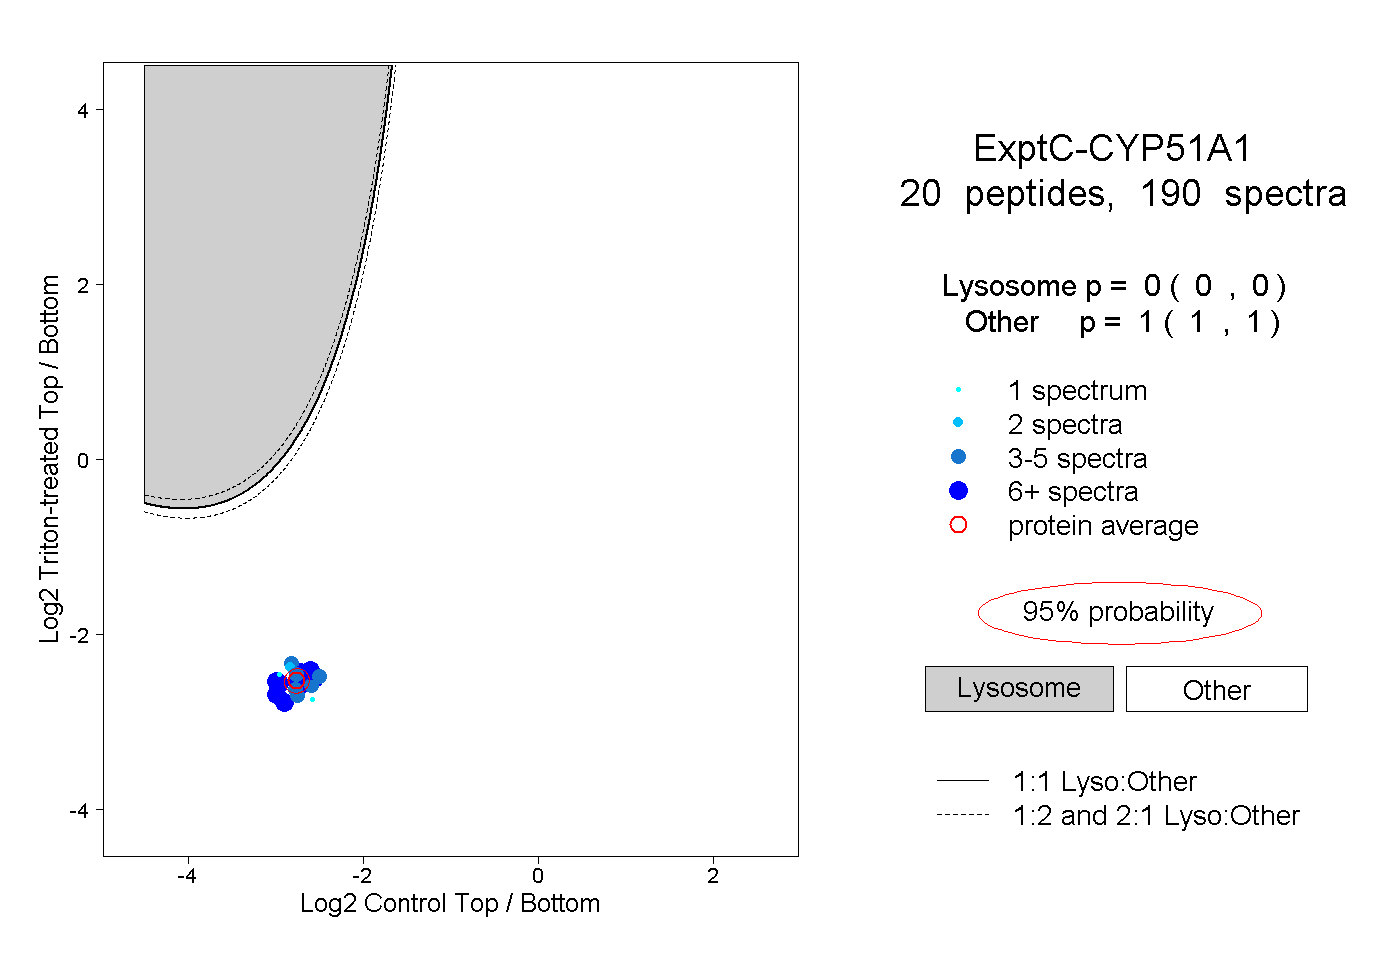 |
0.000 0.000 | 0.000 |
1.000 1.000 | 1.000 |
||||||||
| Plot | Lyso | Other | |||||||||||
| Expt D |
7 peptides |
18 spectra |
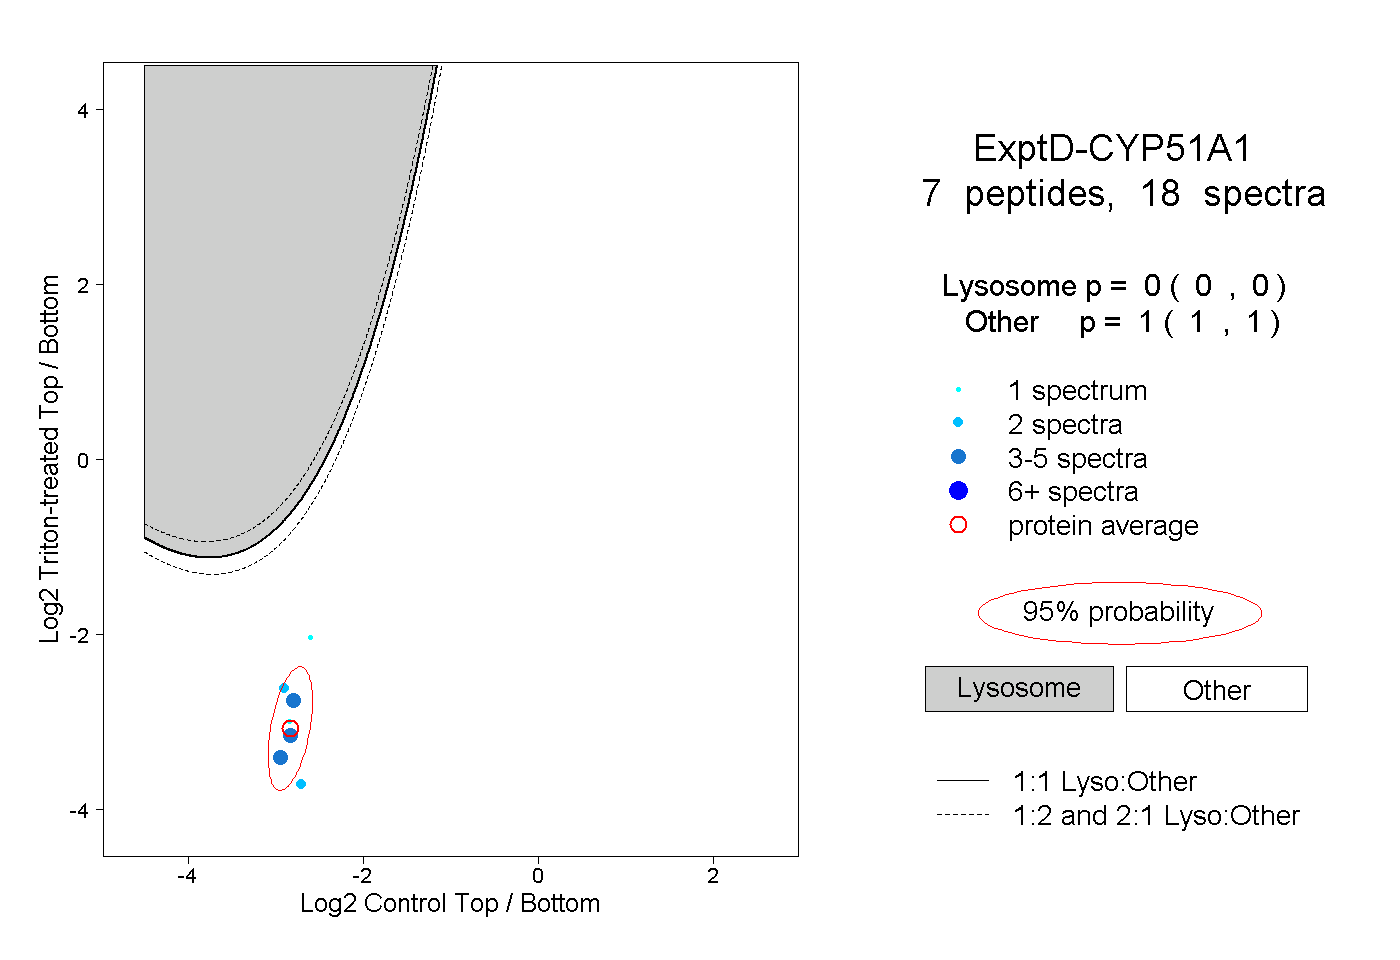 |
0.000 0.000 | 0.000 |
1.000 1.000 | 1.000 |