 44
44peptides
spectra
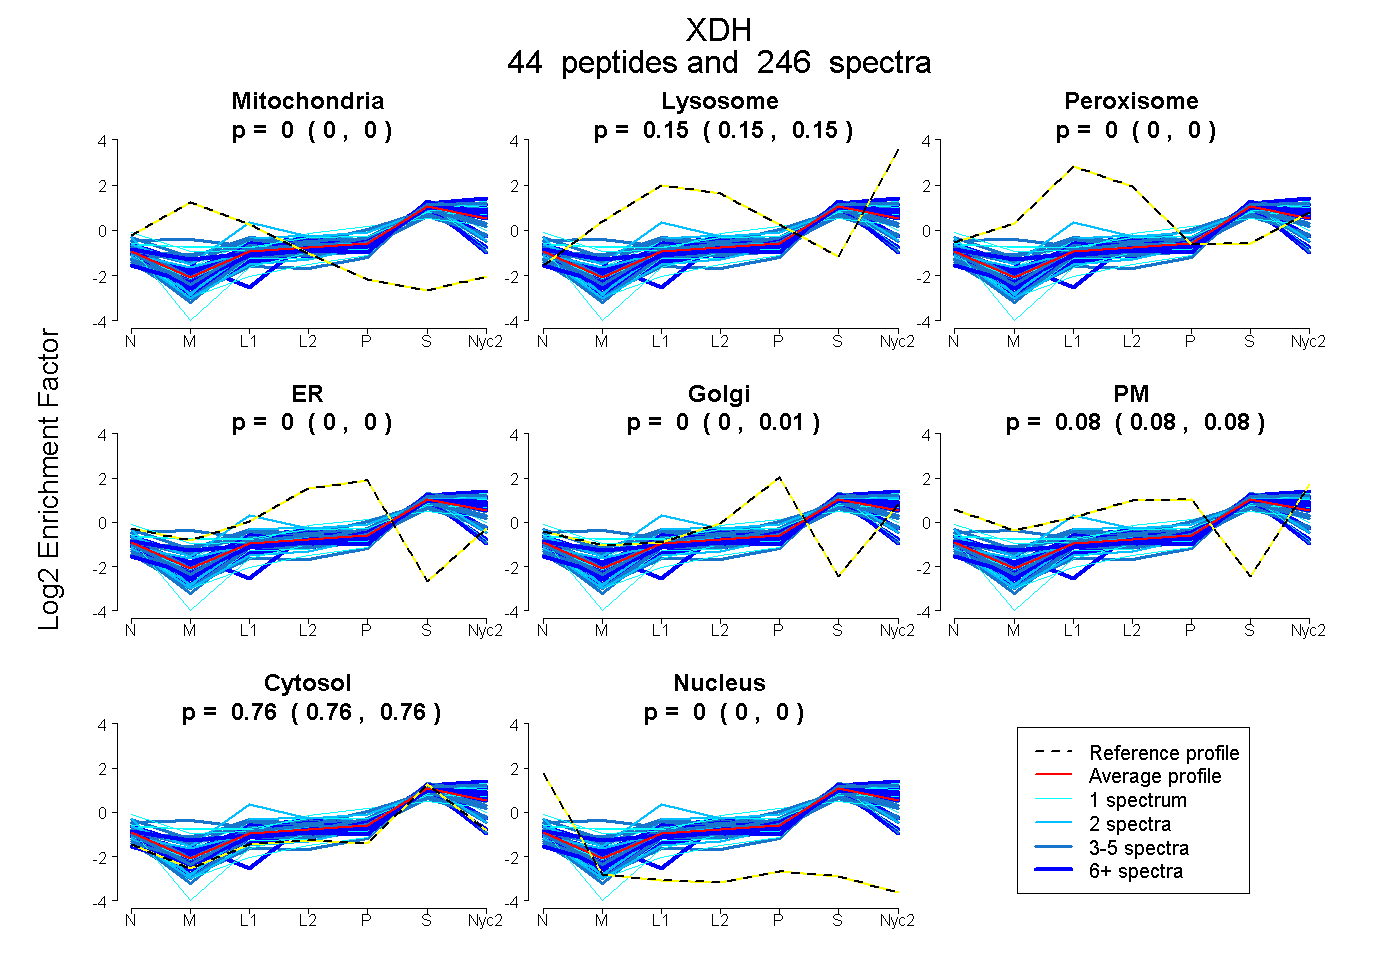
0.000 | 0.000
0.150 | 0.154
0.000 | 0.000
0.000 | 0.000
0.002 | 0.007
0.077 | 0.083
0.762 | 0.764
0.000 | 0.000
25peptides
spectra
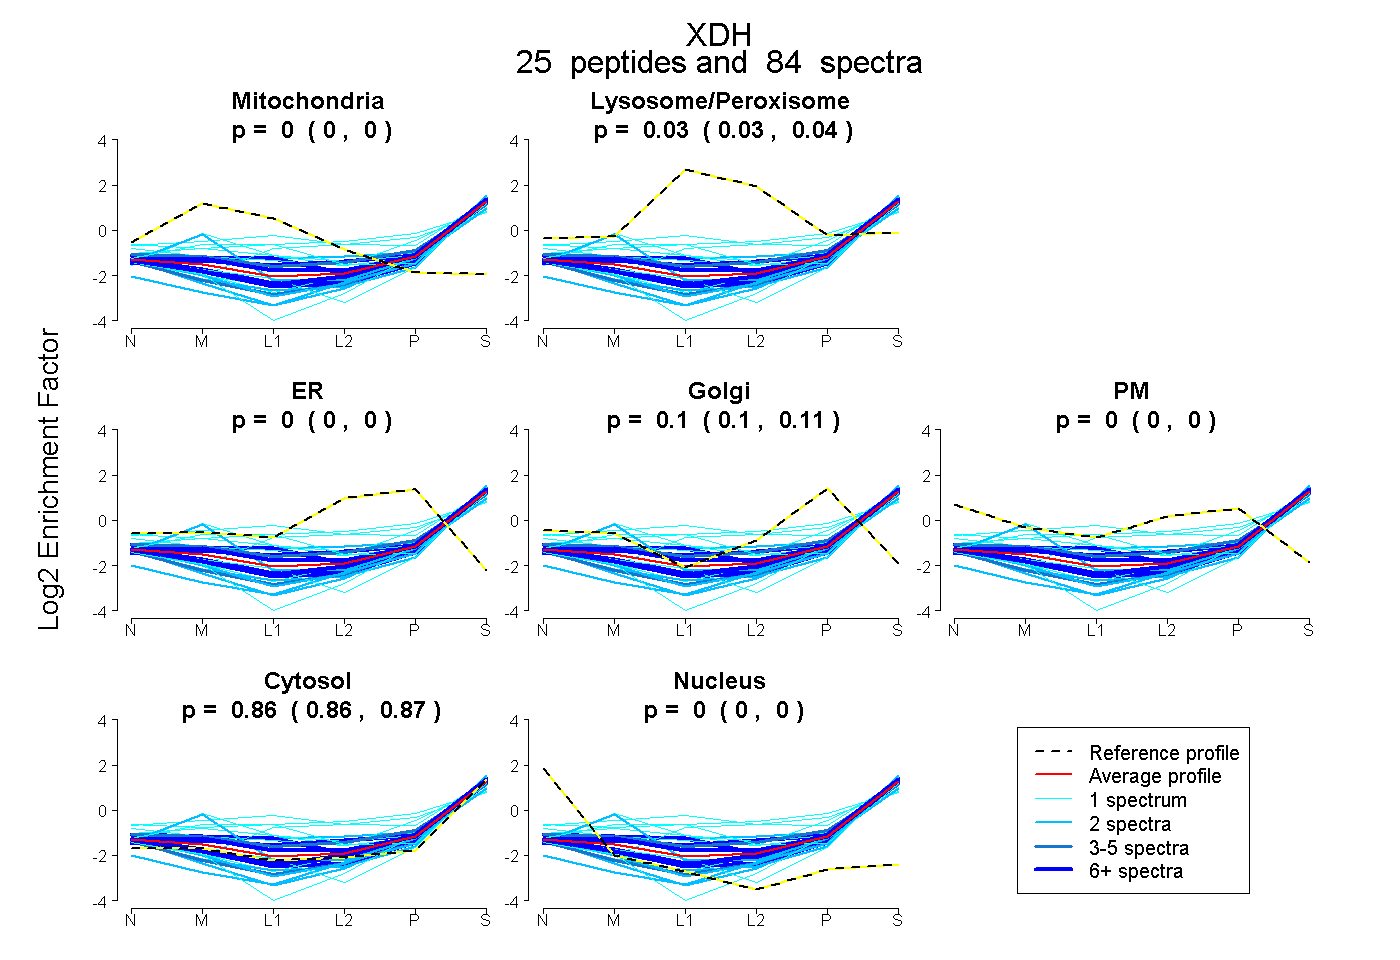
0.000 | 0.000
0.029 | 0.039
0.000 | 0.000
0.099 | 0.106
0.000 | 0.000
0.860 | 0.865
0.000 | 0.000
36peptides
spectra
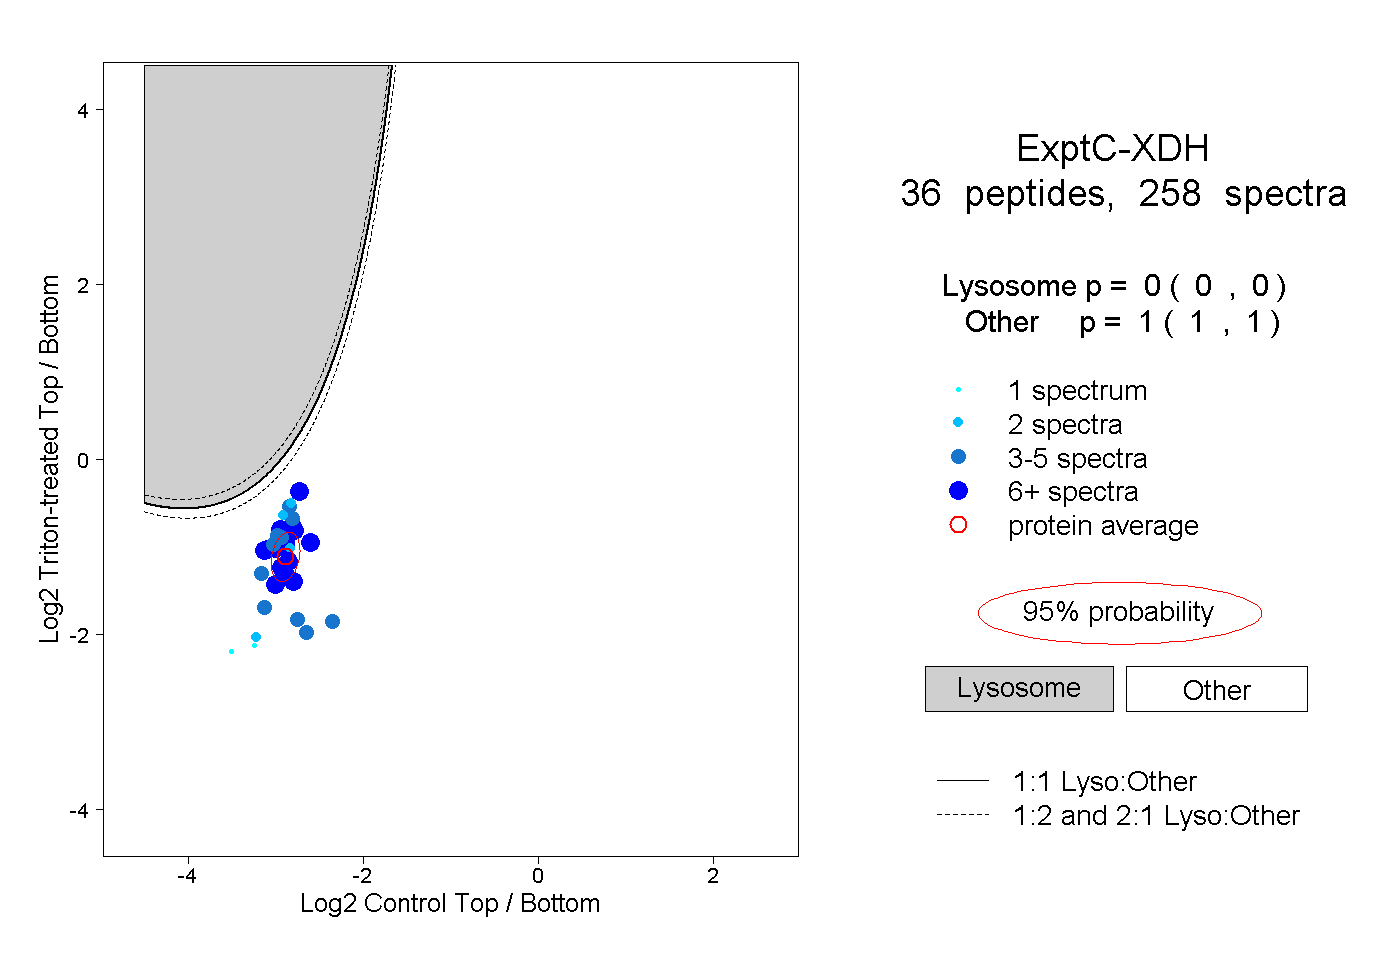
0.000 | 0.000
1.000 | 1.000
14peptides
spectra
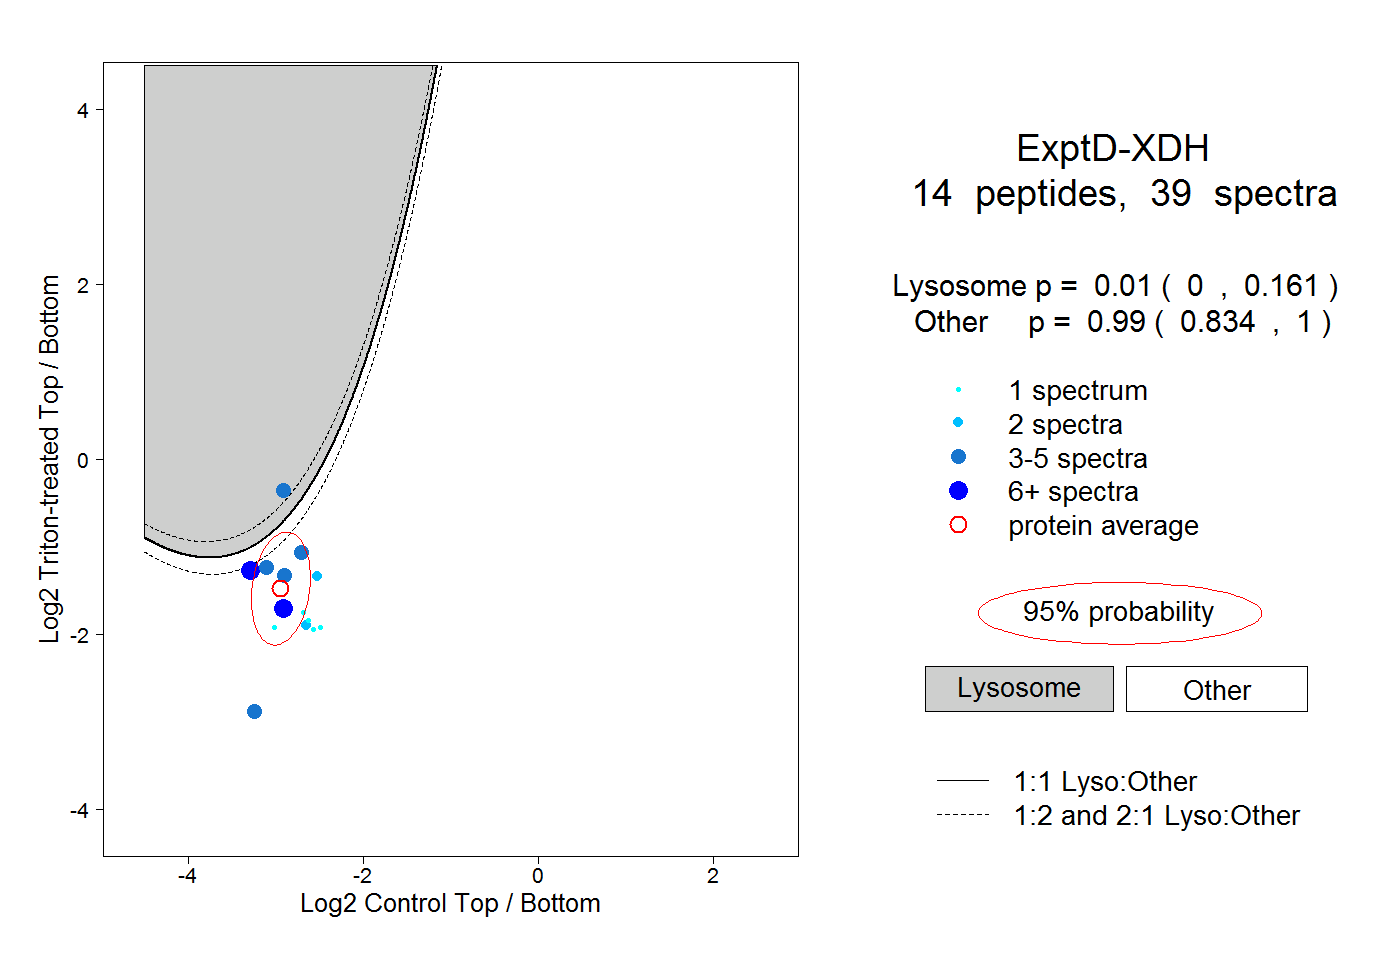
0.000 | 0.161
0.834 | 1.000