XDH
[ENSRNOP00000009634]
Main page
| | | Plot |
Mito |
Lyso |
|
Perox |
ER |
Golgi |
PM |
Cytosol |
Nucleus |
|
| Expt A |
 44
44
peptides |
246
spectra |
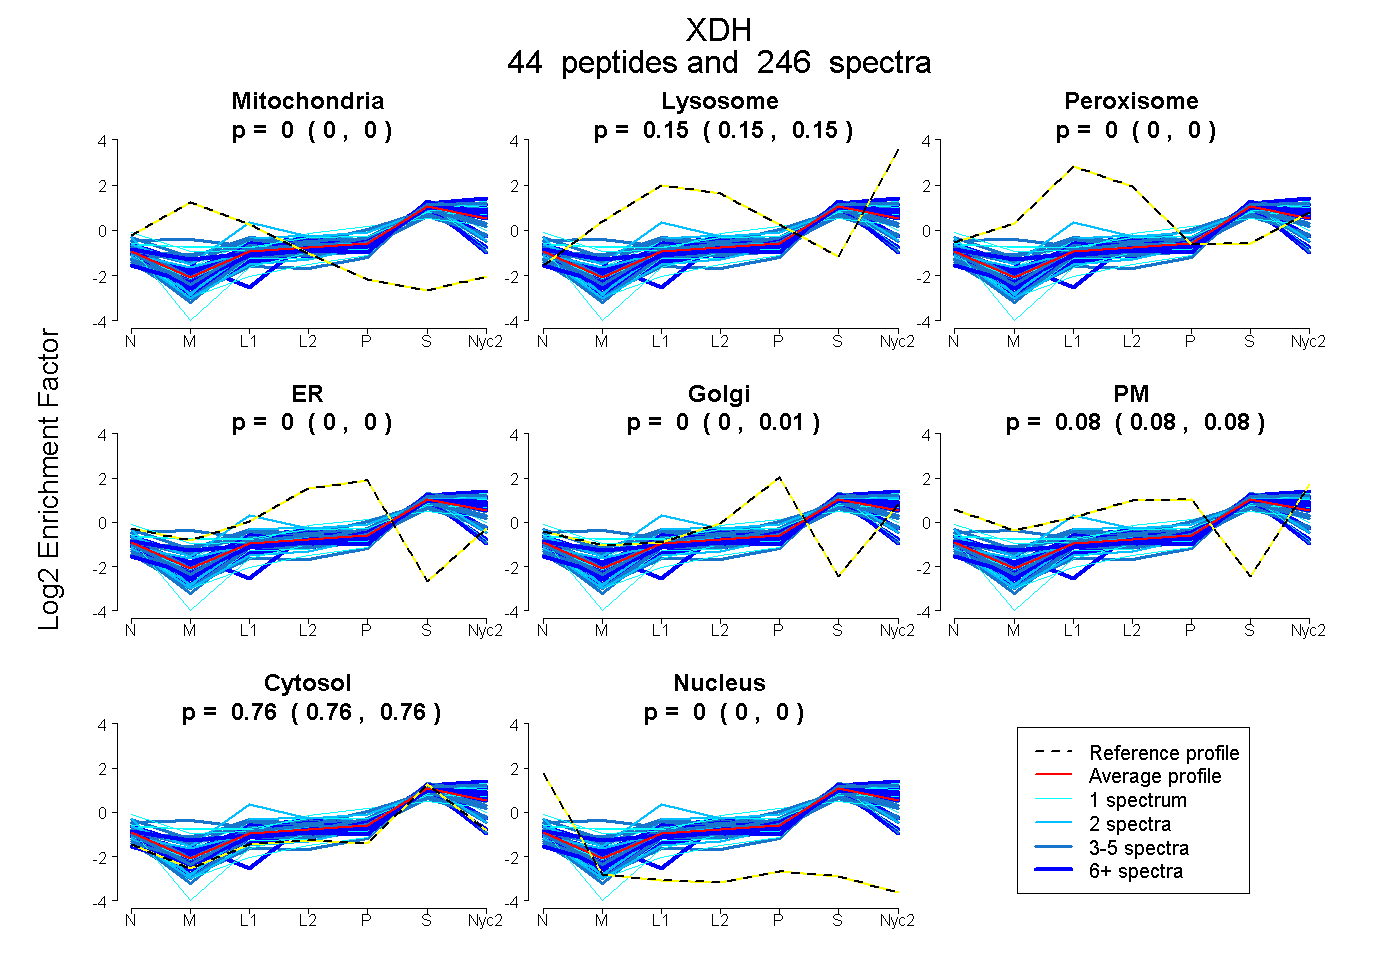 |
0.000
0.000 | 0.000 |
0.152
0.150 | 0.154 |
|
0.000
0.000 | 0.000 |
0.000
0.000 | 0.000 |
0.004
0.002 | 0.007 |
0.081
0.077 | 0.083 |
0.763
0.762 | 0.764 |
0.000
0.000 | 0.000 |
|
| | | Plot |
Mito |
|
Lyso or Perox |
|
ER |
Golgi |
PM |
Cytosol |
Nucleus |
|
| Expt B |
25
peptides |
84
spectra |
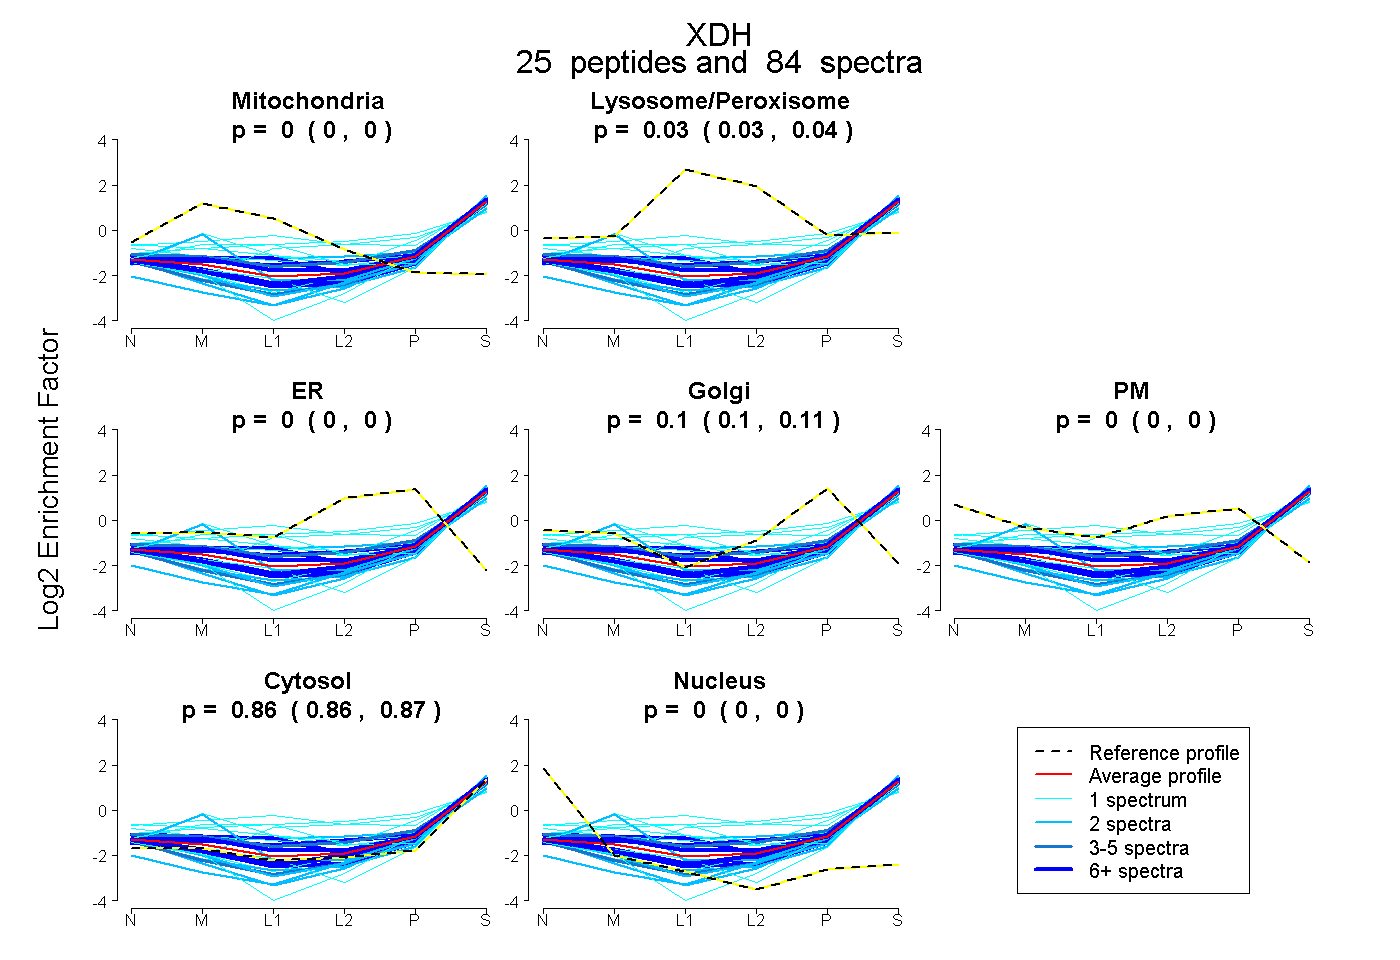 |
0.000
0.000 | 0.000 |
|
0.034
0.029 | 0.039 |
|
0.000
0.000 | 0.000 |
0.103
0.099 | 0.106 |
0.000
0.000 | 0.000 |
0.863
0.860 | 0.865 |
0.000
0.000 | 0.000 |
|
| | | Plot |
|
Lyso |
|
|
|
|
|
|
|
Other |
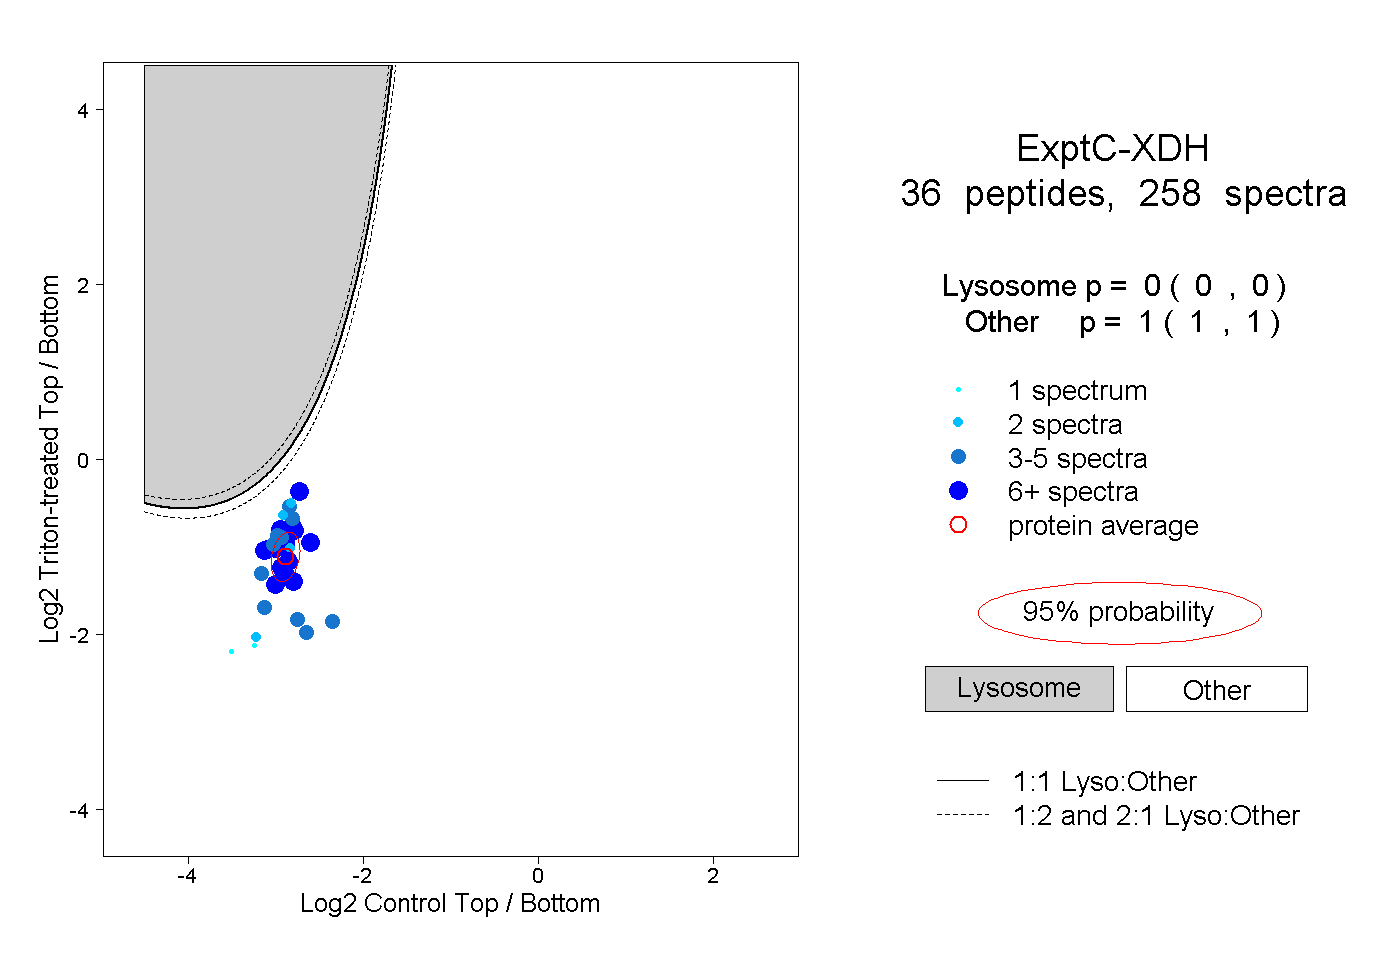
| Expt C |
36
peptides |
258
spectra |
 |
|
0.000
0.000 | 0.000 |
|
|
|
|
|
|
|
1.000
1.000 | 1.000 |
| | | Plot |
|
Lyso |
|
|
|
|
|
|
|
Other |
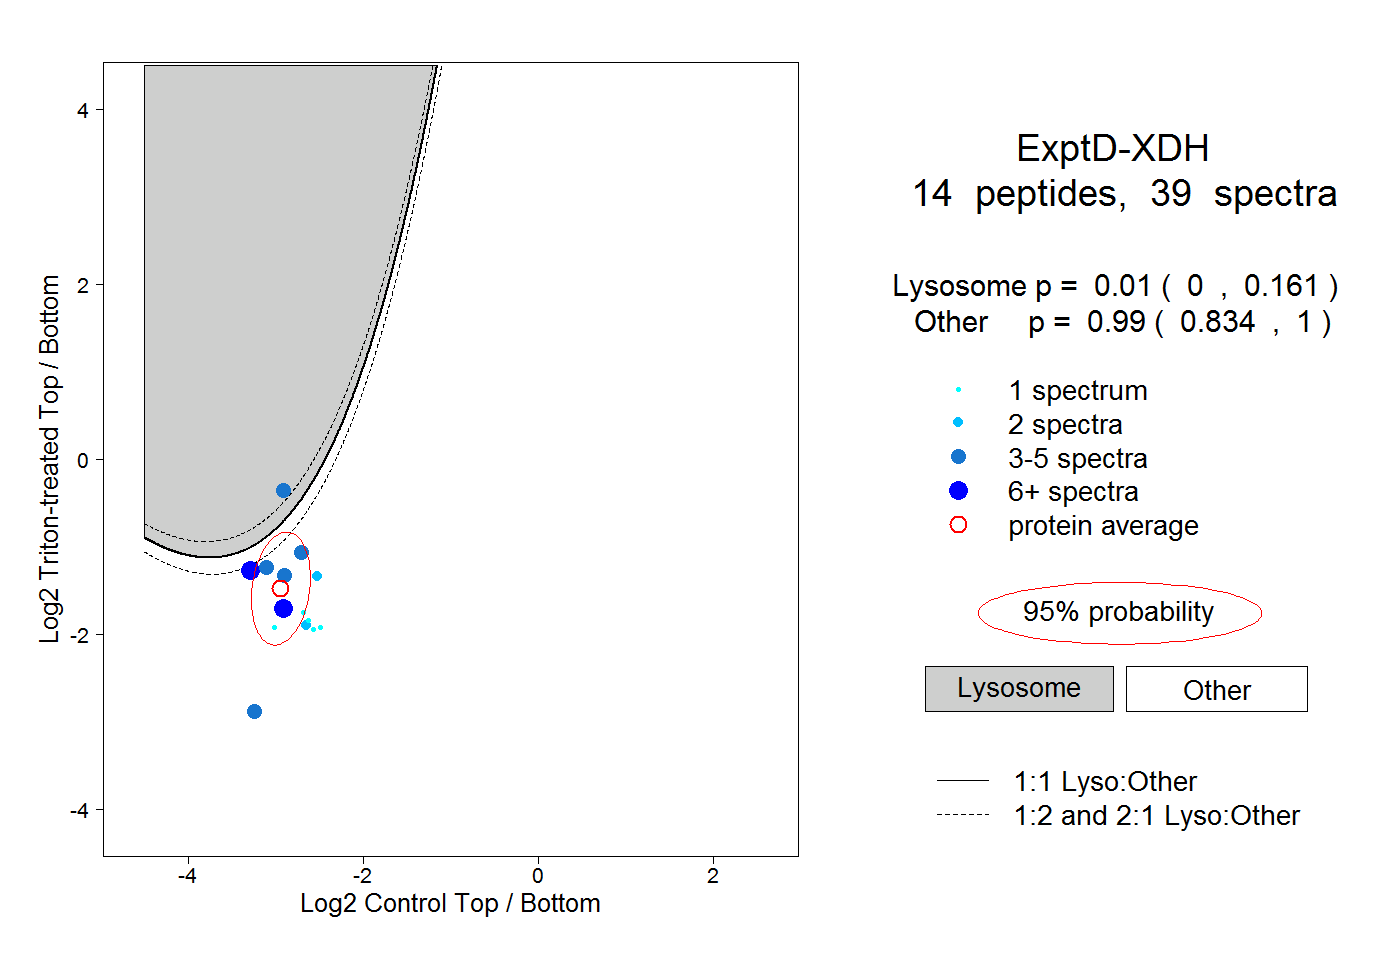
| Expt D |
14
peptides |
39
spectra |
 |
|
0.010
0.000 | 0.161 |
|
|
|
|
|
|
|
0.990
0.834 | 1.000 |
| 3 spectra, LEGFTLPR |
|
0.025 |
|
|
|
|
|
|
|
0.975 |
| 7 spectra, EGEFFSAFK |
|
0.146 |
|
|
|
|
|
|
|
0.854 |
| 1 spectrum, LTLVSR |
|
0.000 |
|
|
|
|
|
|
|
1.000 |
| 1 spectrum, ALYASK |
|
0.000 |
|
|
|
|
|
|
|
1.000 |
| 2 spectra, AQHPDAK |
|
0.001 |
|
|
|
|
|
|
|
0.999 |
| 3 spectra, MVQVASR |
|
0.092 |
|
|
|
|
|
|
|
0.908 |
| 1 spectrum, TADELVFFVNGK |
|
0.000 |
|
|
|
|
|
|
|
1.000 |
| 2 spectra, HPFLAK |
|
0.000 |
|
|
|
|
|
|
|
1.000 |
| 7 spectra, TNLPSNTAFR |
|
0.002 |
|
|
|
|
|
|
|
0.998 |
| 3 spectra, IHPVQER |
|
0.000 |
|
|
|
|
|
|
|
1.000 |
| 4 spectra, MLGVPDNR |
|
0.901 |
|
|
|
|
|
|
|
0.099 |
| 3 spectra, LVTSTR |
|
0.020 |
|
|
|
|
|
|
|
0.980 |
| 1 spectrum, NLMDIAK |
|
0.000 |
|
|
|
|
|
|
|
1.000 |
| 1 spectrum, EGDLTHFNQK |
|
0.001 |
|
|
|
|
|
|
|
0.999 |