 8
8peptides
spectra
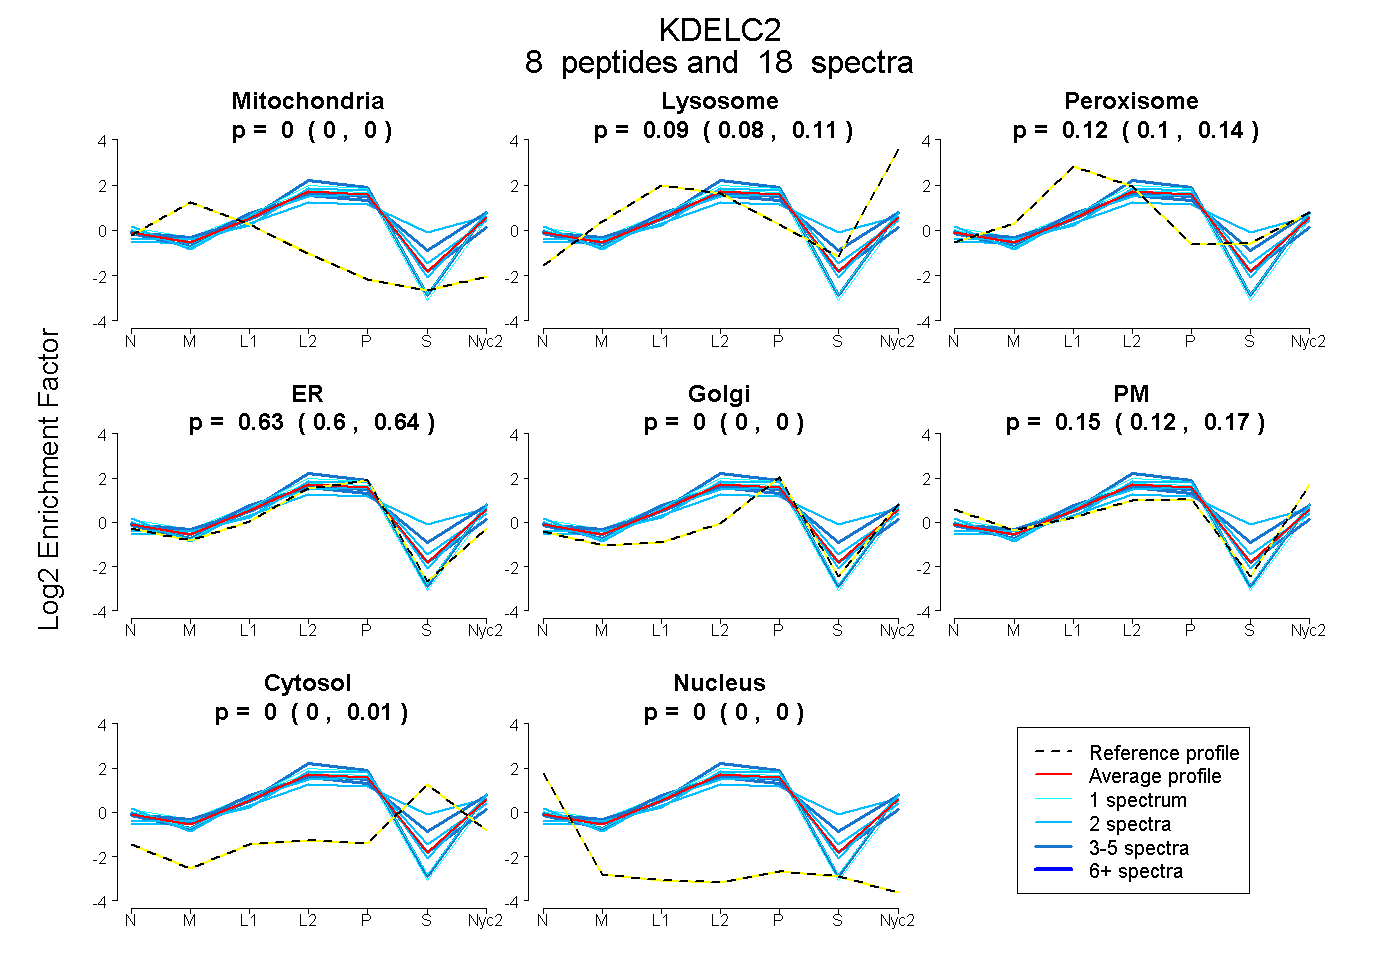
0.000 | 0.000
0.078 | 0.108
0.103 | 0.139
0.604 | 0.644
0.000 | 0.000
0.125 | 0.174
0.000 | 0.014
0.000 | 0.000
4peptides
spectra
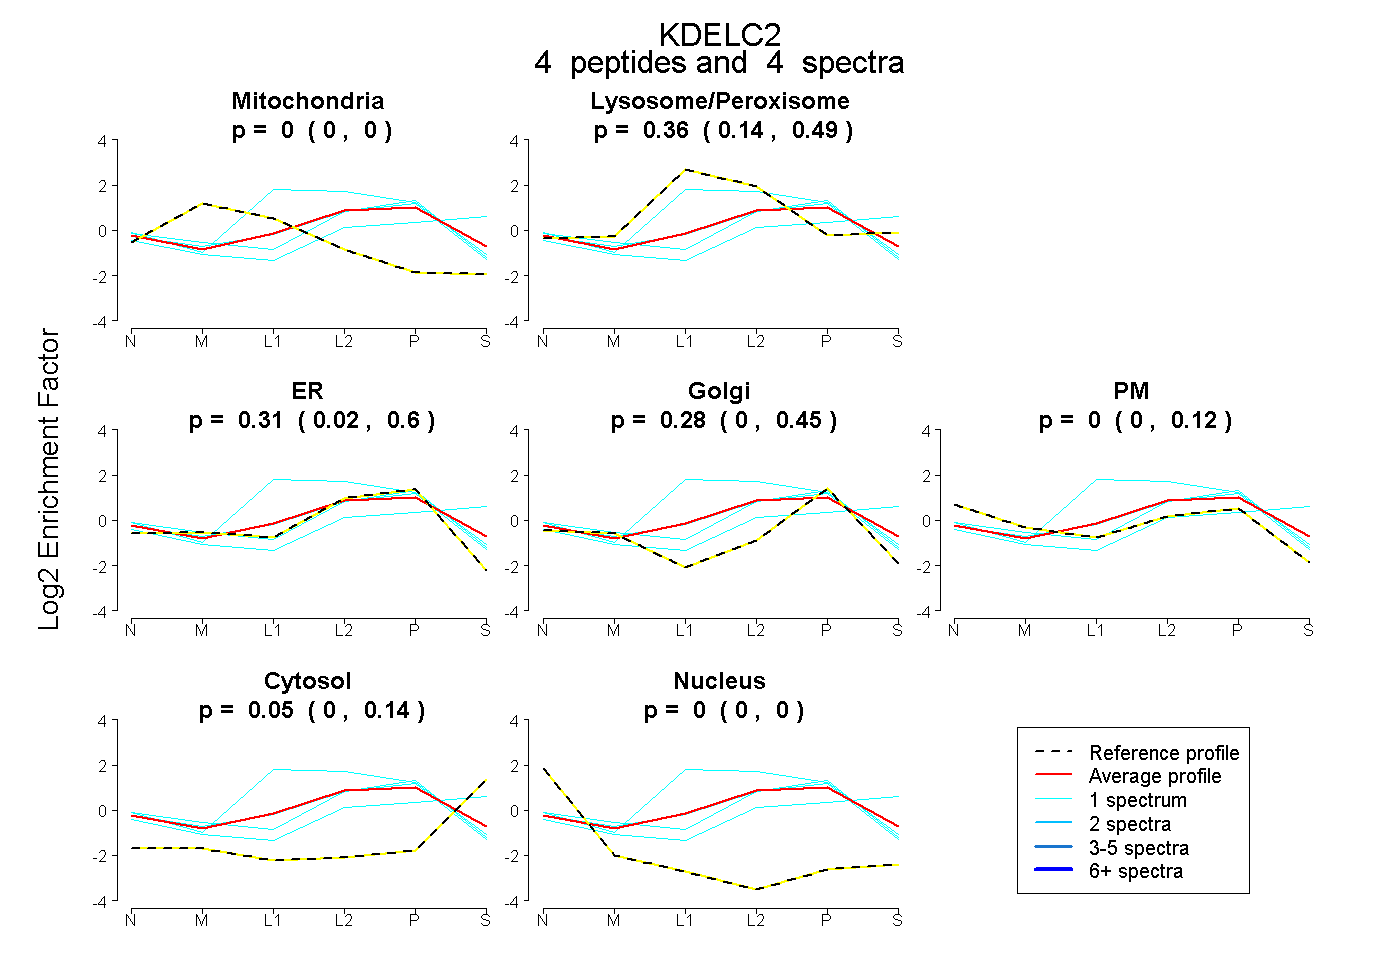
0.000 | 0.000
0.143 | 0.490
0.022 | 0.601
0.000 | 0.453
0.000 | 0.122
0.000 | 0.141
0.000 | 0.000
9peptides
spectra
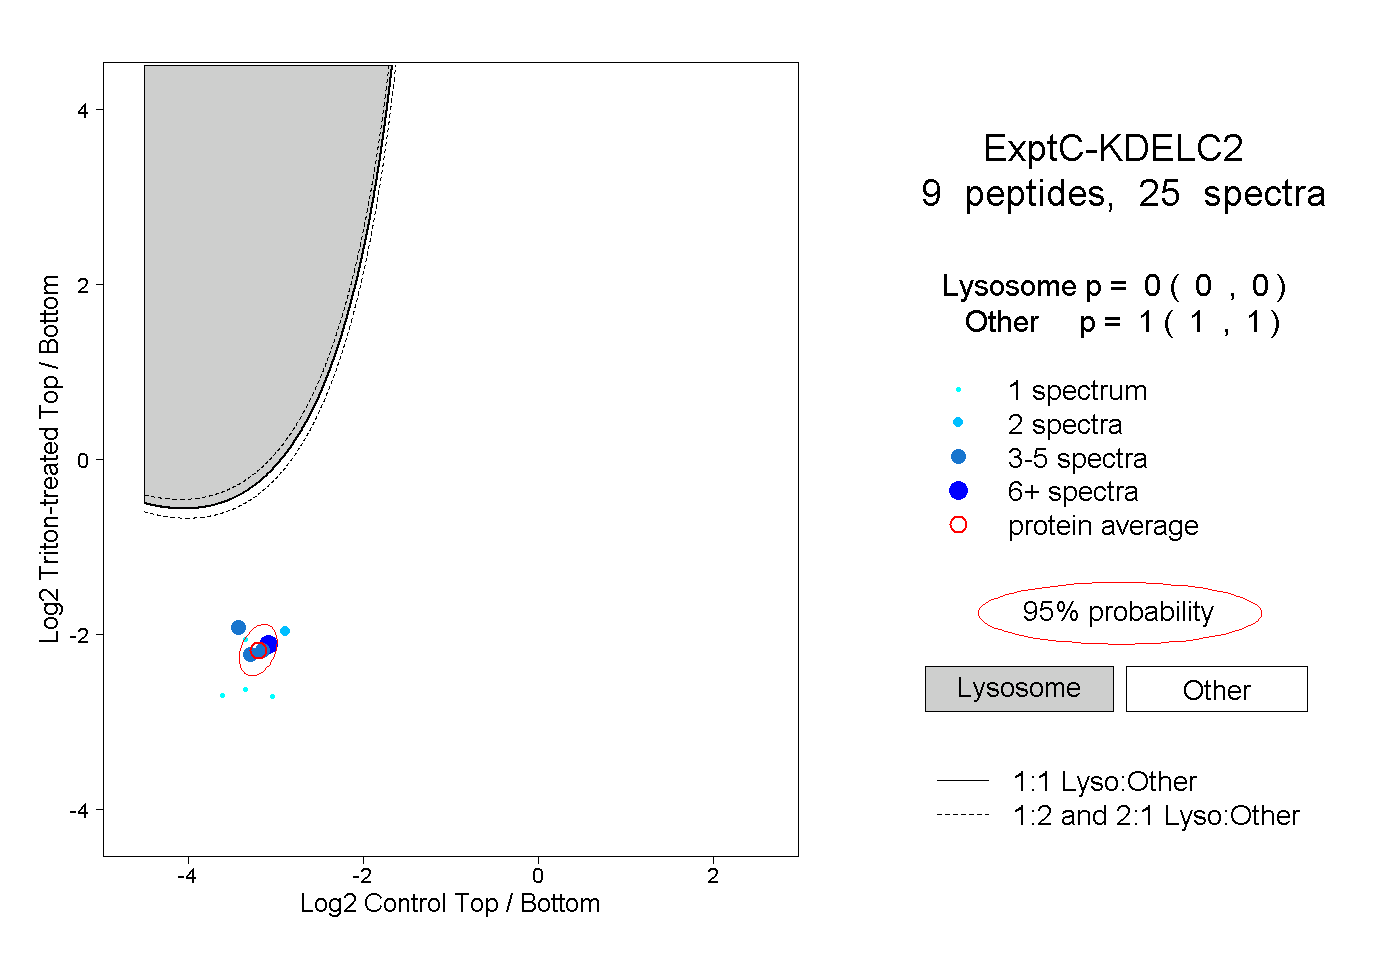
0.000 | 0.000
1.000 | 1.000
1peptide
spectrum
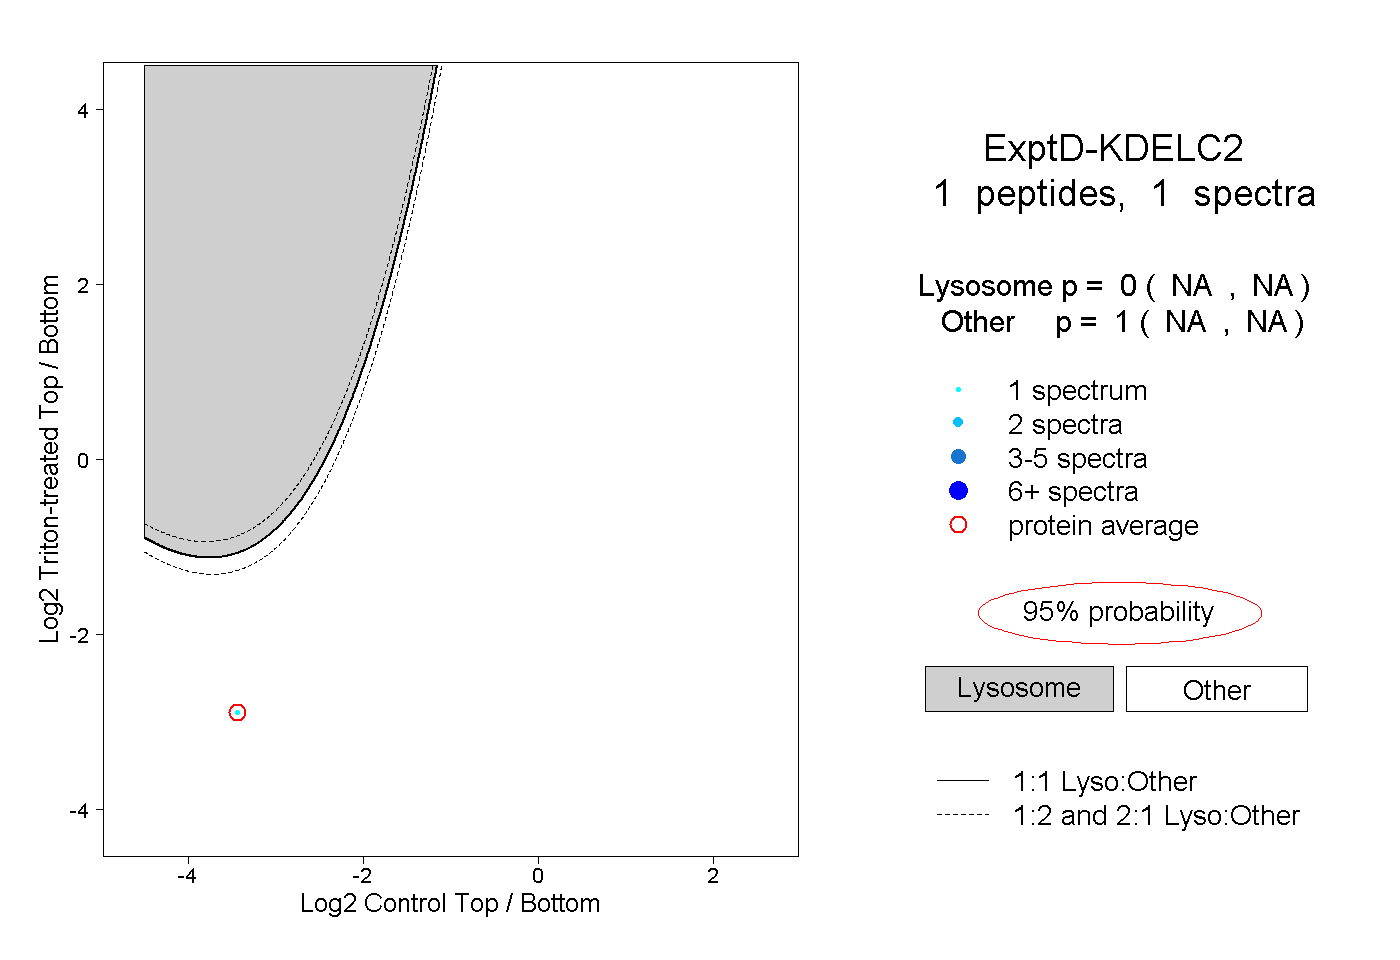
NA | NA
NA | NA