KDELC2
[ENSRNOP00000009497]
Main page
| | | Plot |
Mito |
Lyso |
|
Perox |
ER |
Golgi |
PM |
Cytosol |
Nucleus |
|
| Expt A |
 8
8
peptides |
18
spectra |
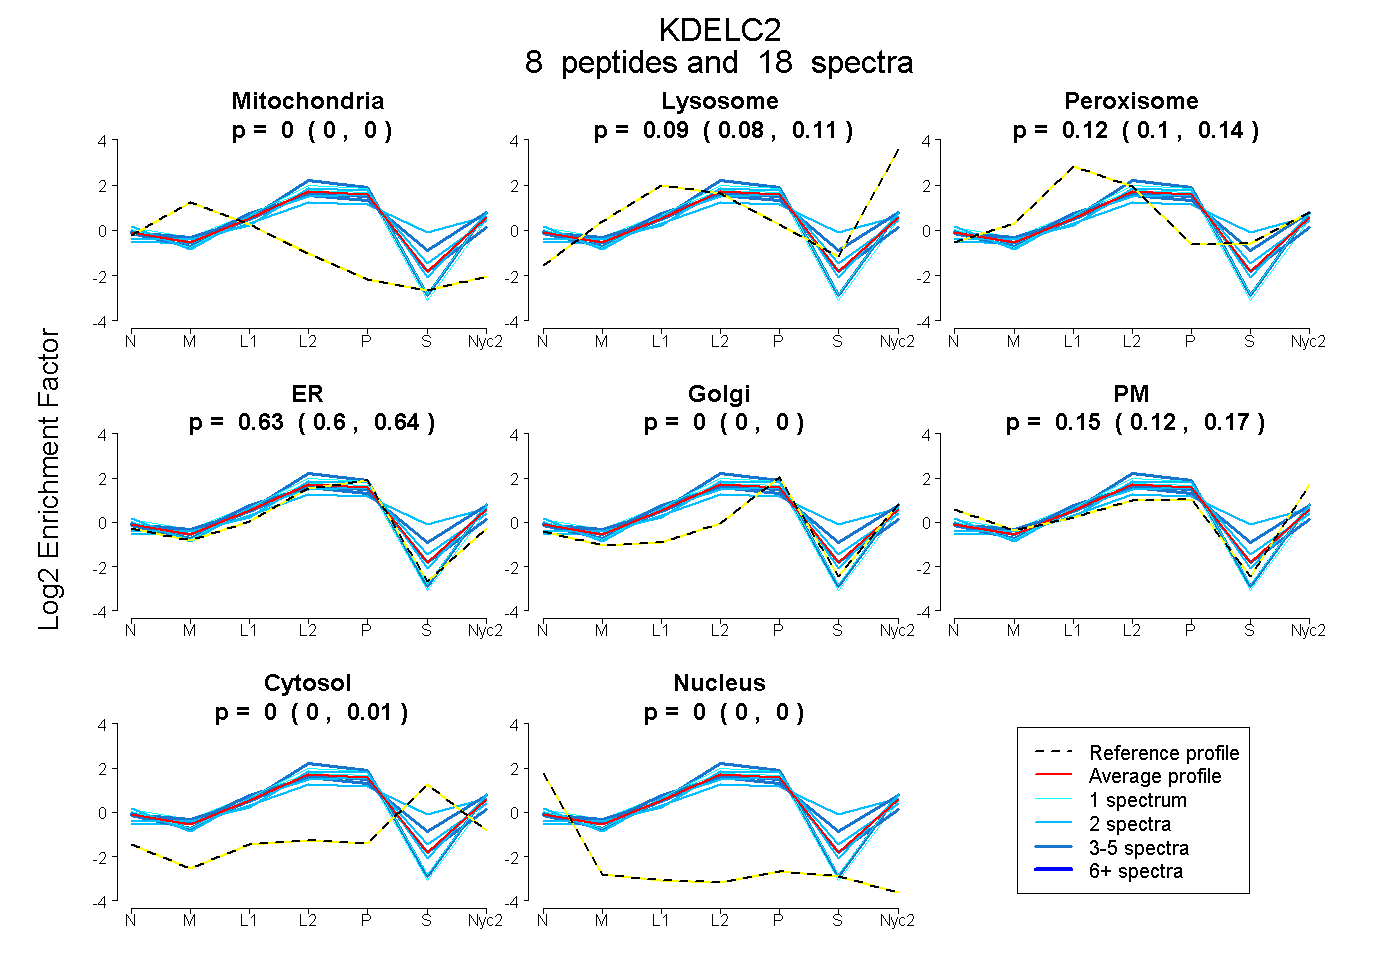 |
0.000
0.000 | 0.000 |
0.094
0.078 | 0.108 |
|
0.125
0.103 | 0.139 |
0.627
0.604 | 0.644 |
0.000
0.000 | 0.000 |
0.153
0.125 | 0.174 |
0.002
0.000 | 0.014 |
0.000
0.000 | 0.000 |
|
| | | Plot |
Mito |
|
Lyso or Perox |
|
ER |
Golgi |
PM |
Cytosol |
Nucleus |
|
| Expt B |
4
peptides |
4
spectra |
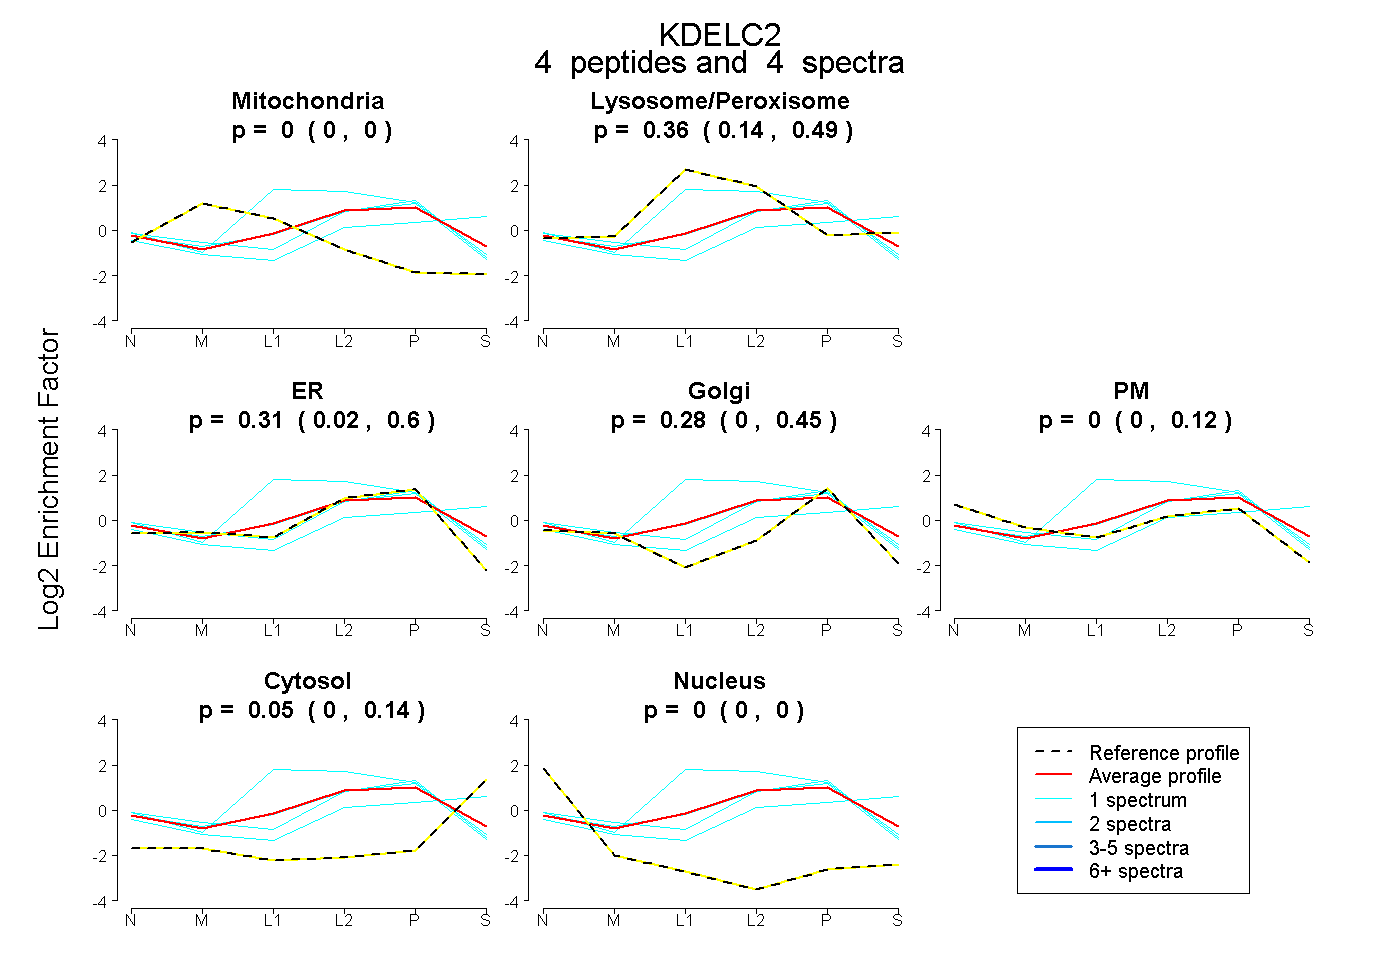 |
0.000
0.000 | 0.000 |
|
0.357
0.143 | 0.490 |
|
0.313
0.022 | 0.601 |
0.277
0.000 | 0.453 |
0.000
0.000 | 0.122 |
0.053
0.000 | 0.141 |
0.000
0.000 | 0.000 |
|
| 1 spectrum, NDGTFLVR |
0.000 |
|
0.189 |
|
0.222 |
0.136 |
0.042 |
0.412 |
0.000 |
|
| 1 spectrum, LQLVLLSK |
0.000 |
|
0.616 |
|
0.384 |
0.000 |
0.000 |
0.000 |
0.000 |
|
| 1 spectrum, EGQLTAR |
0.000 |
|
0.286 |
|
0.431 |
0.283 |
0.000 |
0.000 |
0.000 |
|
| 1 spectrum, NLSDLLEK |
0.000 |
|
0.107 |
|
0.540 |
0.123 |
0.188 |
0.043 |
0.000 |
|
| | | Plot |
|
Lyso |
|
|
|
|
|
|
|
Other |
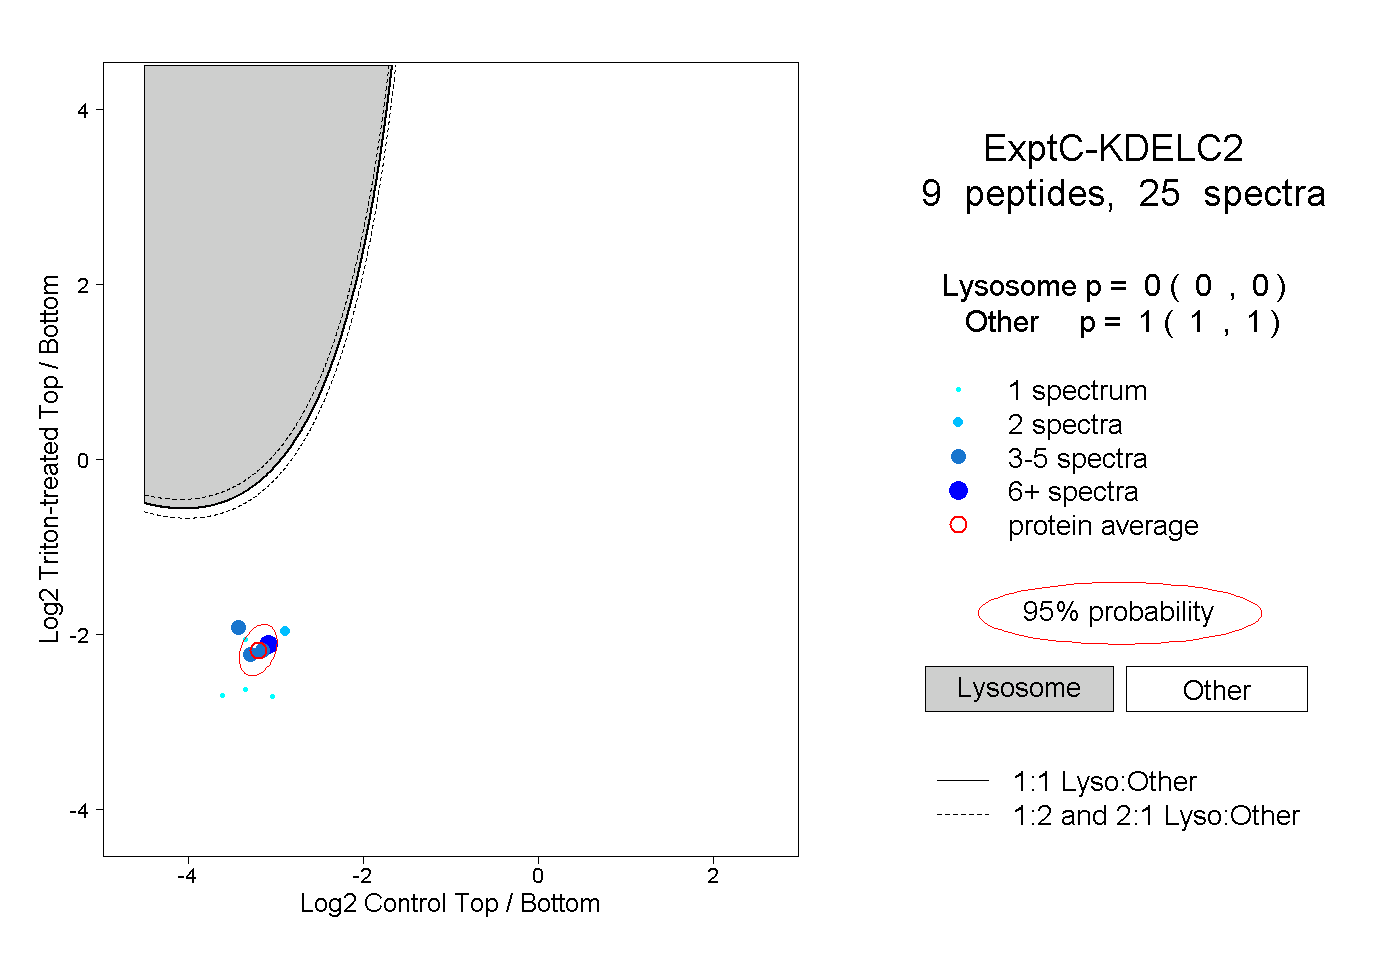
| Expt C |
9
peptides |
25
spectra |
 |
|
0.000
0.000 | 0.000 |
|
|
|
|
|
|
|
1.000
1.000 | 1.000 |
| | | Plot |
|
Lyso |
|
|
|
|
|
|
|
Other |
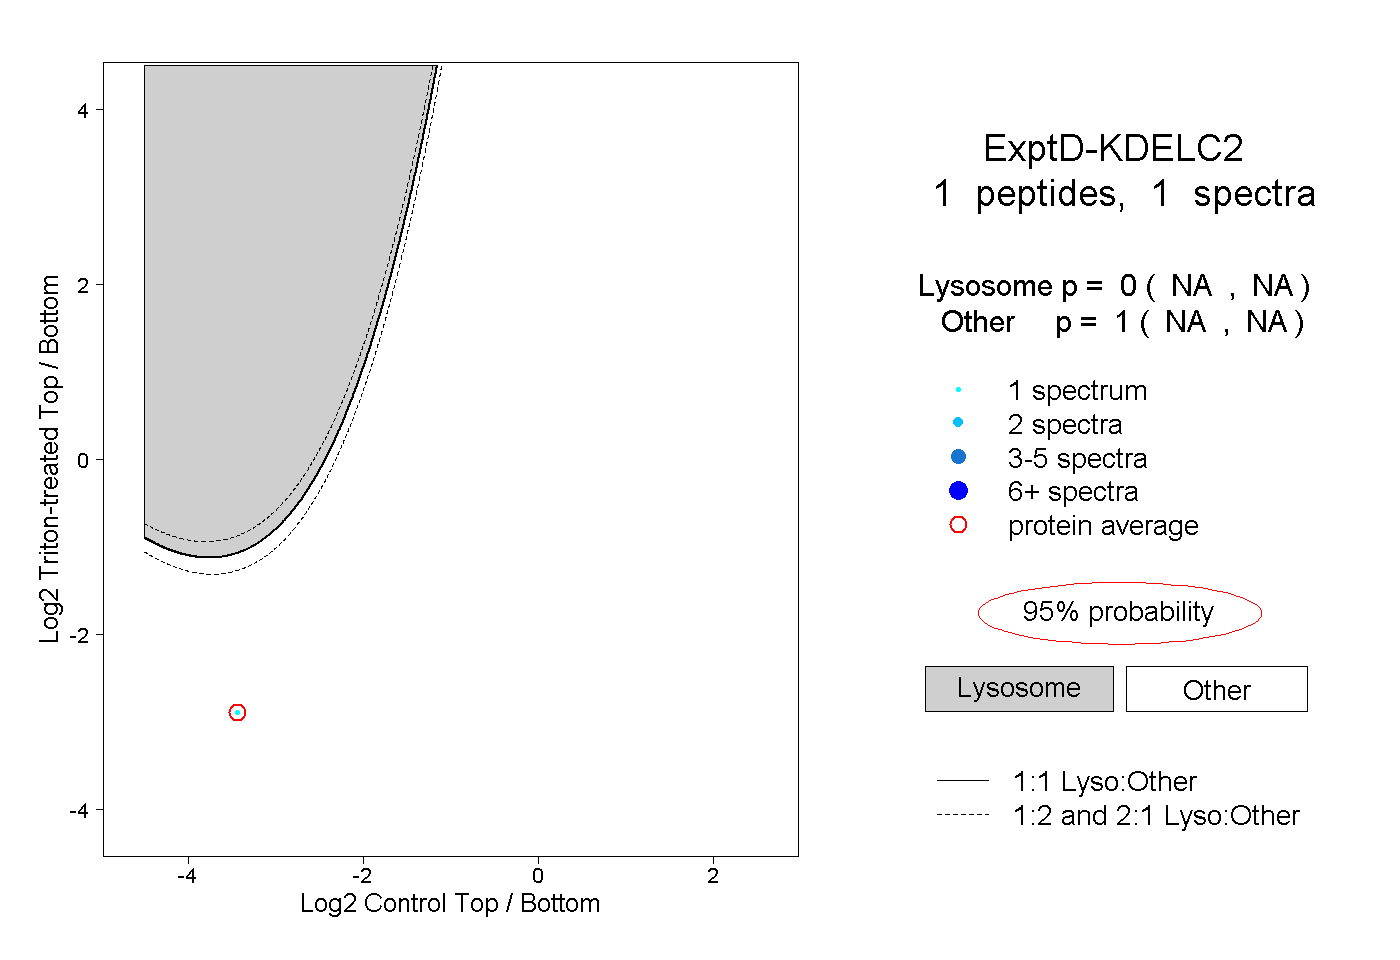
| Expt D |
1
peptide |
1
spectrum |
 |
|
0.000
NA | NA |
|
|
|
|
|
|
|
1.000
NA | NA |