 8
8peptides
spectra
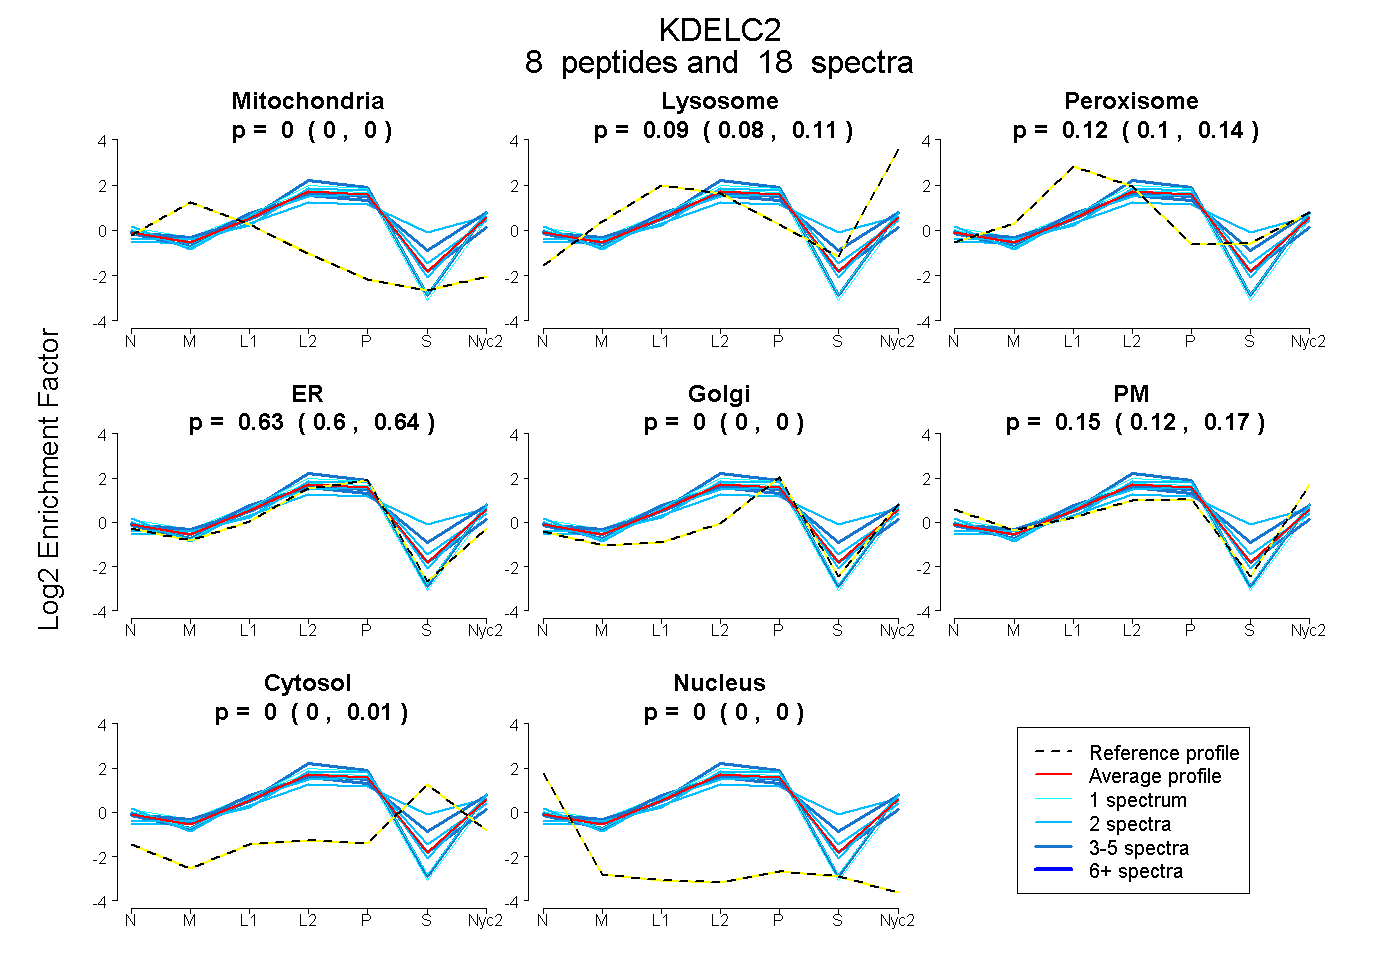
0.000 | 0.000
0.078 | 0.108
0.103 | 0.139
0.604 | 0.644
0.000 | 0.000
0.125 | 0.174
0.000 | 0.014
0.000 | 0.000
| Plot | Mito | Lyso | Perox | ER | Golgi | PM | Cytosol | Nucleus | |||||
| Expt A |
8 peptides |
18 spectra |
|
0.000 0.000 | 0.000 |
0.094 0.078 | 0.108 |
0.125 0.103 | 0.139 |
0.627 0.604 | 0.644 |
0.000 0.000 | 0.000 |
0.153 0.125 | 0.174 |
0.002 0.000 | 0.014 |
0.000 0.000 | 0.000 |
| 3 spectra, LQLVLLSK | 0.000 | 0.098 | 0.240 | 0.400 | 0.000 | 0.179 | 0.082 | 0.000 | ||
| 2 spectra, YQVNVDGTVAAYR | 0.000 | 0.000 | 0.183 | 0.545 | 0.000 | 0.220 | 0.052 | 0.000 | ||
| 1 spectrum, NLSDLLEK | 0.000 | 0.106 | 0.000 | 0.672 | 0.000 | 0.222 | 0.000 | 0.000 | ||
| 3 spectra, MFSDEILLSLAR | 0.000 | 0.136 | 0.000 | 0.745 | 0.000 | 0.119 | 0.000 | 0.000 | ||
| 1 spectrum, DLLQPPR | 0.000 | 0.018 | 0.053 | 0.633 | 0.000 | 0.296 | 0.000 | 0.000 | ||
| 4 spectra, EGQLTAR | 0.000 | 0.000 | 0.207 | 0.675 | 0.000 | 0.111 | 0.008 | 0.000 | ||
| 2 spectra, HYVPIK | 0.000 | 0.217 | 0.141 | 0.402 | 0.000 | 0.000 | 0.241 | 0.000 | ||
| 2 spectra, YFFLQSVDSDGR | 0.000 | 0.203 | 0.000 | 0.738 | 0.000 | 0.059 | 0.000 | 0.000 |
| Plot | Mito | Lyso or Perox | ER | Golgi | PM | Cytosol | Nucleus | ||||||
| Expt B |
4 peptides |
4 spectra |
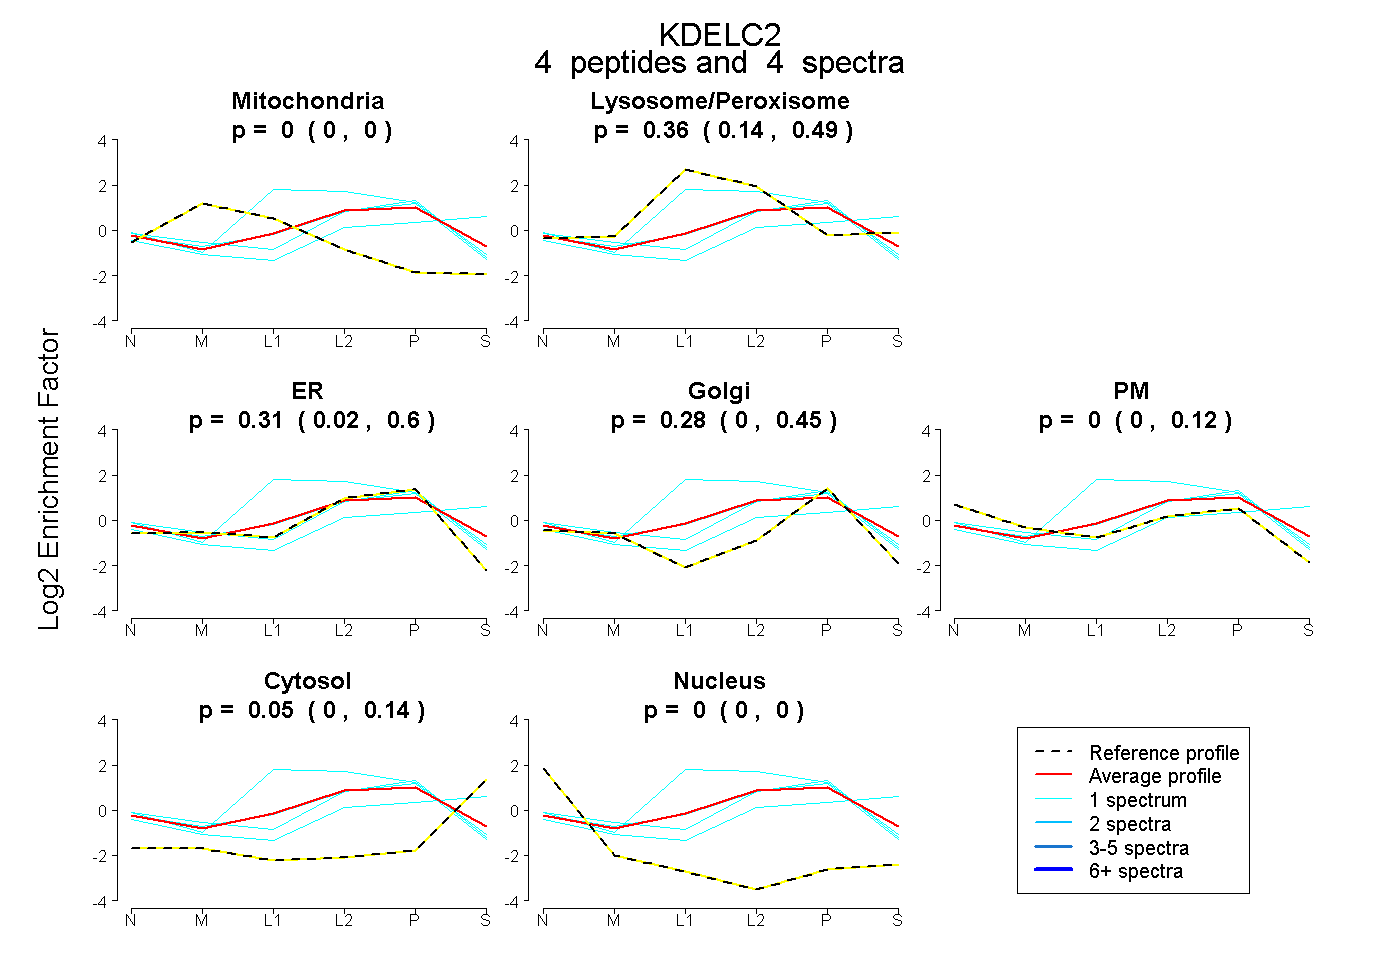 |
0.000 0.000 | 0.000 |
0.357 0.143 | 0.490 |
0.313 0.022 | 0.601 |
0.277 0.000 | 0.453 |
0.000 0.000 | 0.122 |
0.053 0.000 | 0.141 |
0.000 0.000 | 0.000 |
|||
| Plot | Lyso | Other | |||||||||||
| Expt C |
9 peptides |
25 spectra |
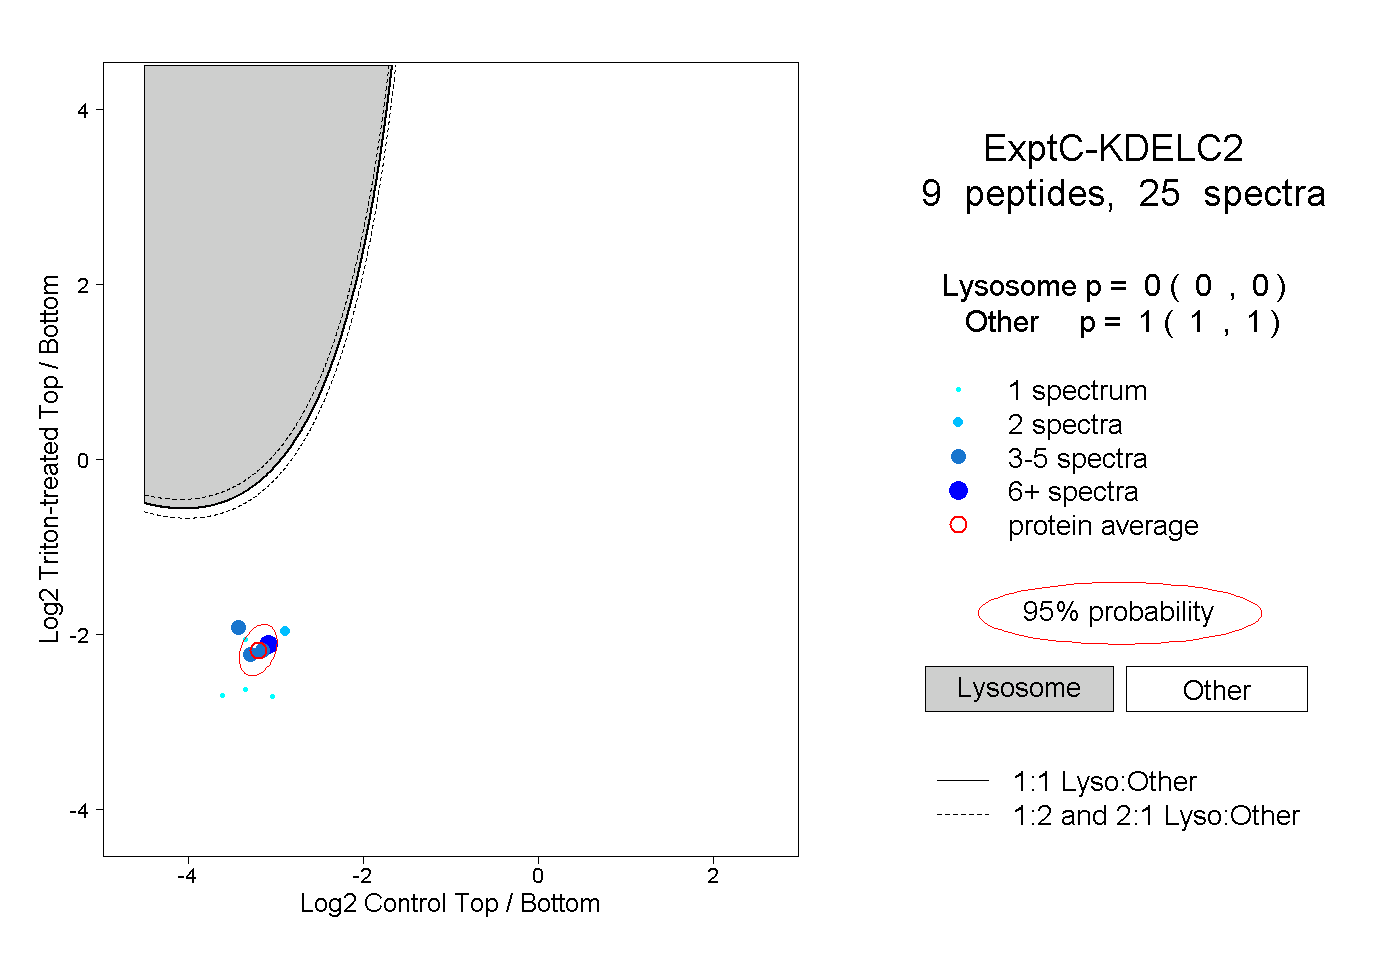 |
0.000 0.000 | 0.000 |
1.000 1.000 | 1.000 |
||||||||
| Plot | Lyso | Other | |||||||||||
| Expt D |
1 peptide |
1 spectrum |
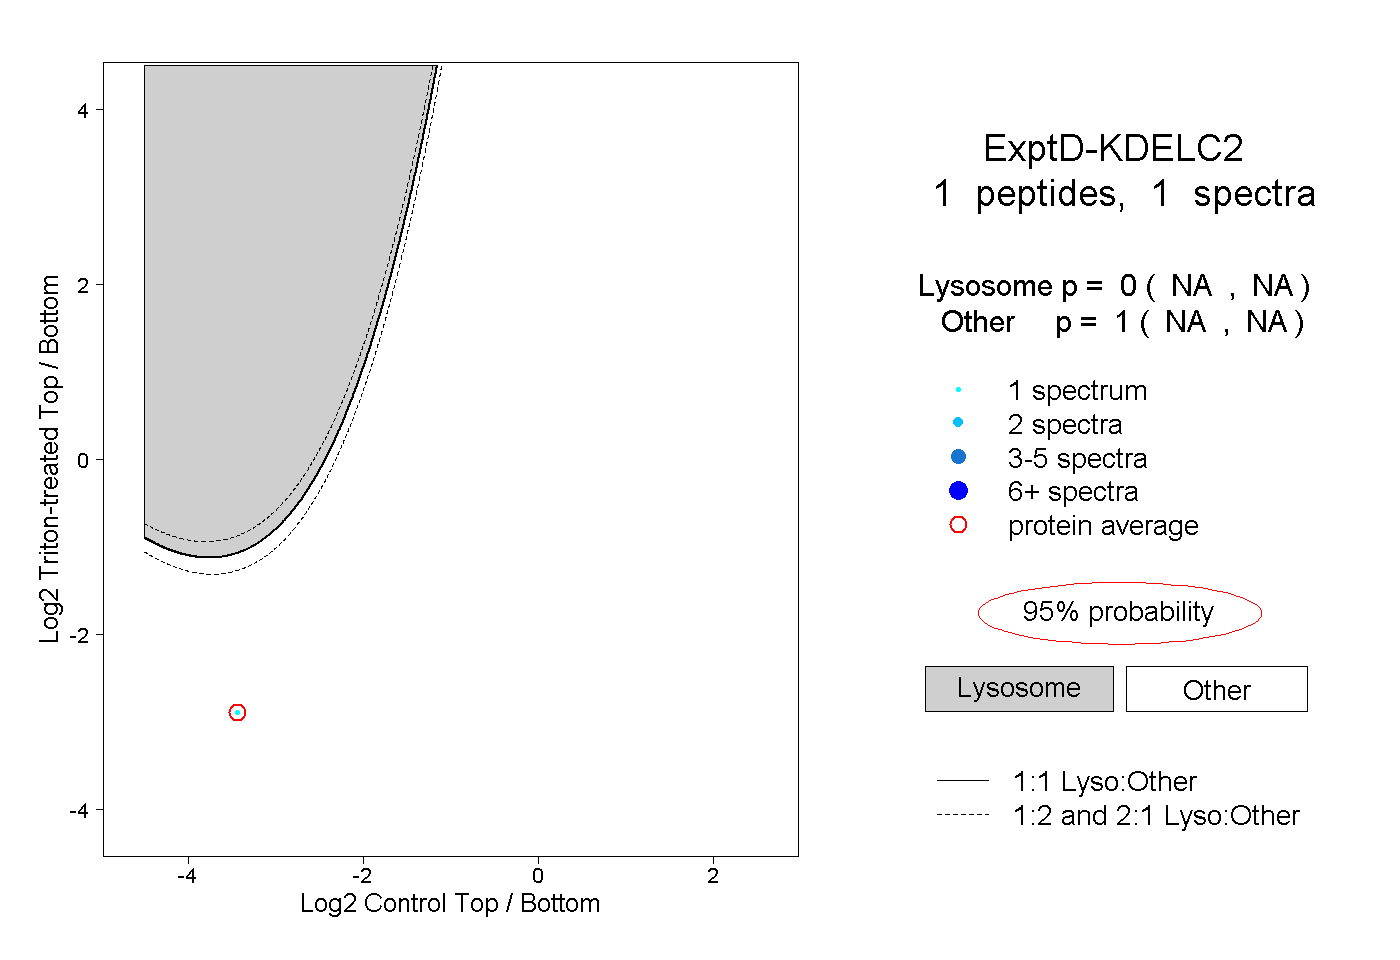 |
0.000 NA | NA |
1.000 NA | NA |