 13
13peptides
spectra
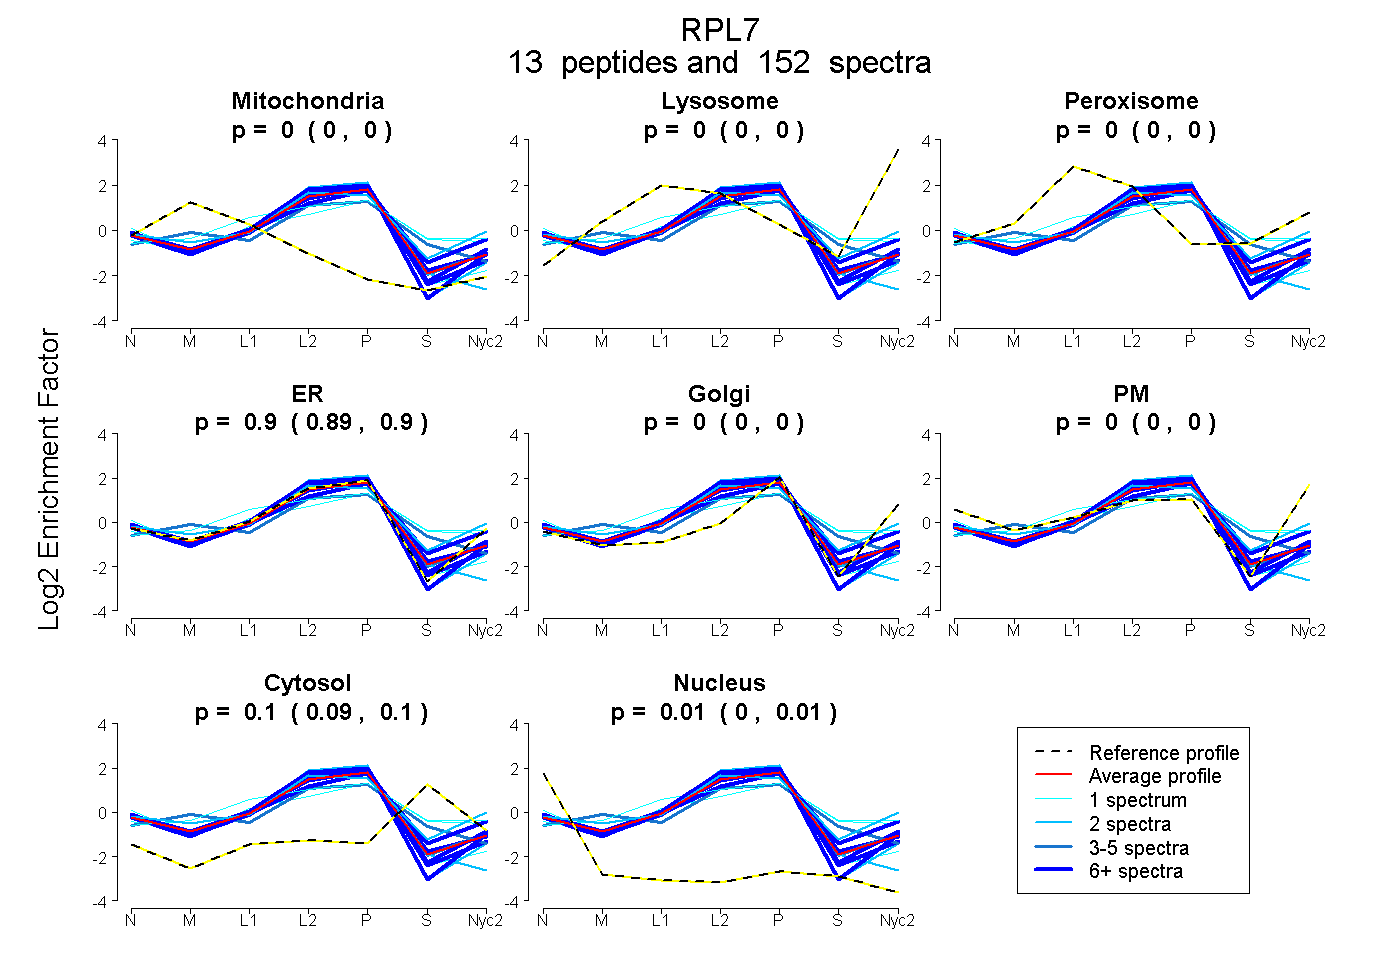
0.000 | 0.003
0.000 | 0.000
0.000 | 0.000
0.894 | 0.901
0.000 | 0.000
0.000 | 0.000
0.090 | 0.102
0.002 | 0.008
14peptides
spectra
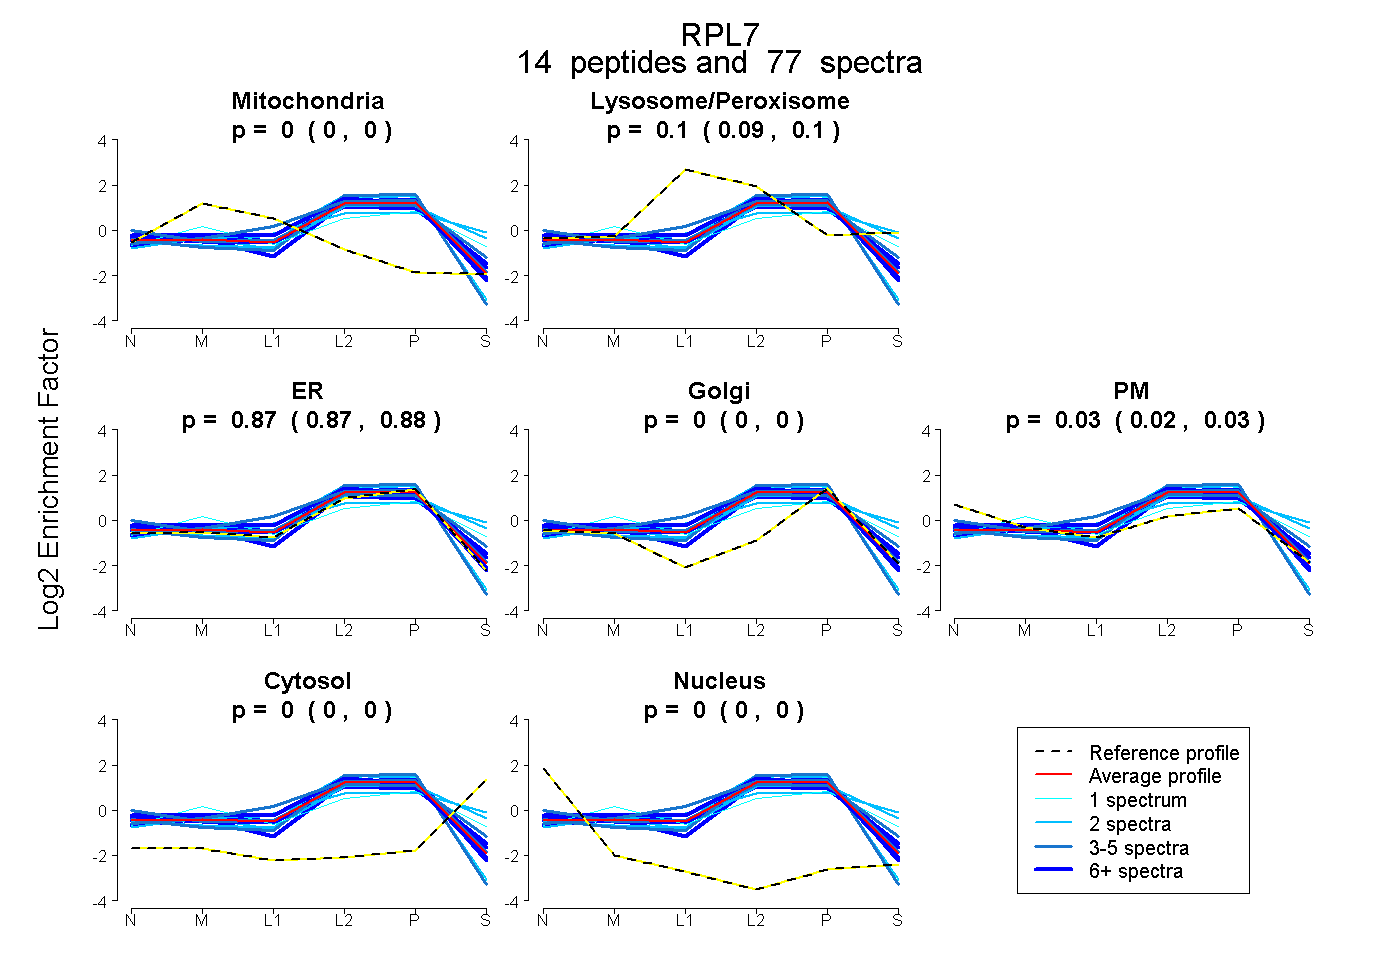
0.000 | 0.000
0.092 | 0.102
0.866 | 0.882
0.000 | 0.000
0.020 | 0.034
0.000 | 0.000
0.000 | 0.000
16peptides
spectra
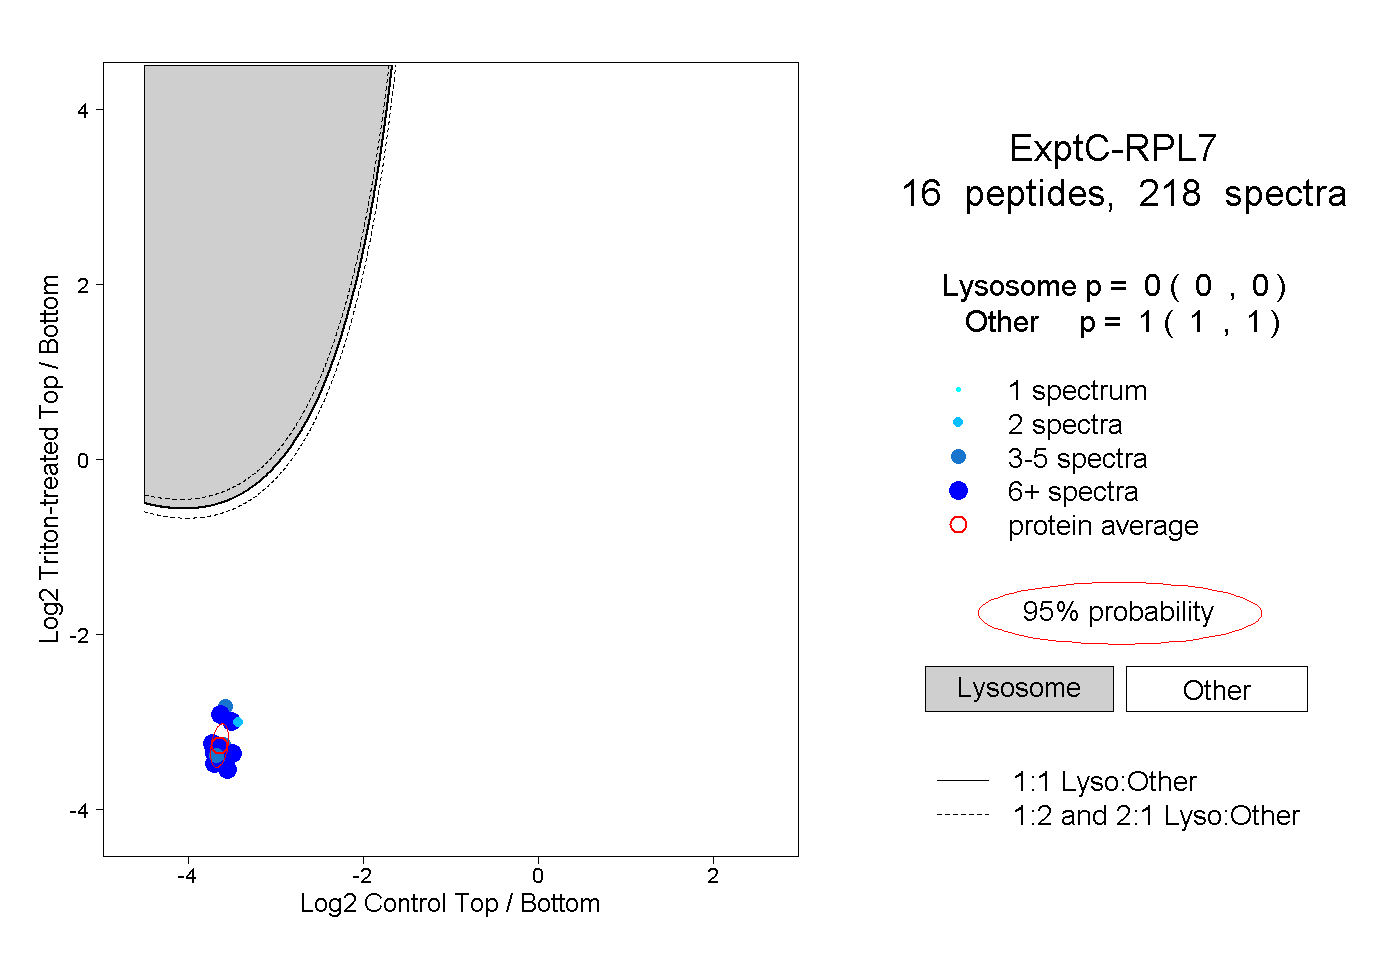
0.000 | 0.000
1.000 | 1.000
7peptides
spectra
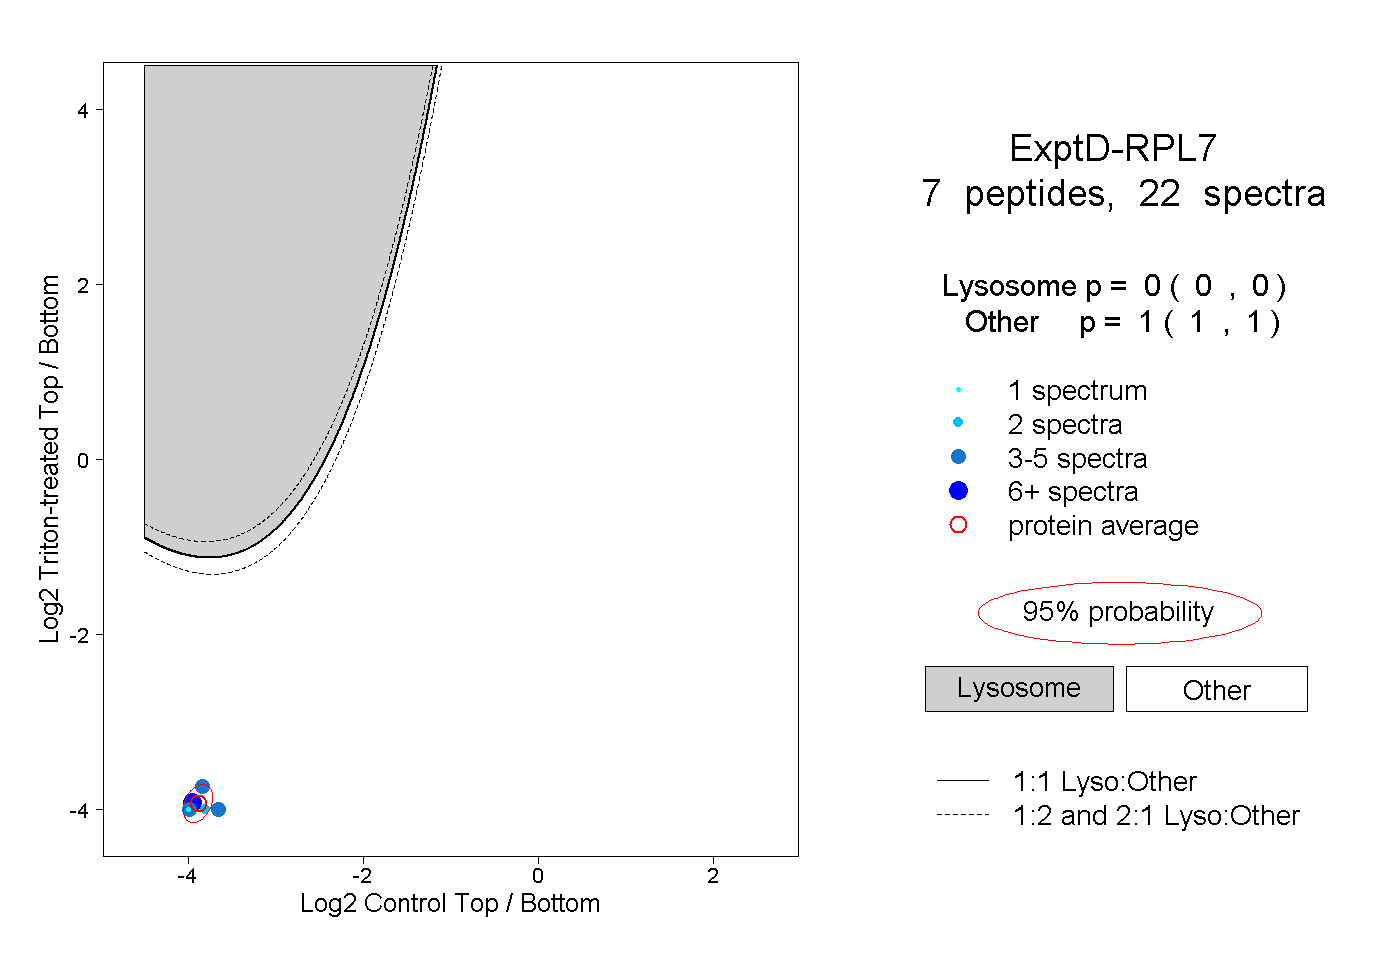
0.000 | 0.000
1.000 | 1.000