 13
13peptides
spectra
0.000 | 0.003
0.000 | 0.000
0.000 | 0.000
0.894 | 0.901
0.000 | 0.000
0.000 | 0.000
0.090 | 0.102
0.002 | 0.008
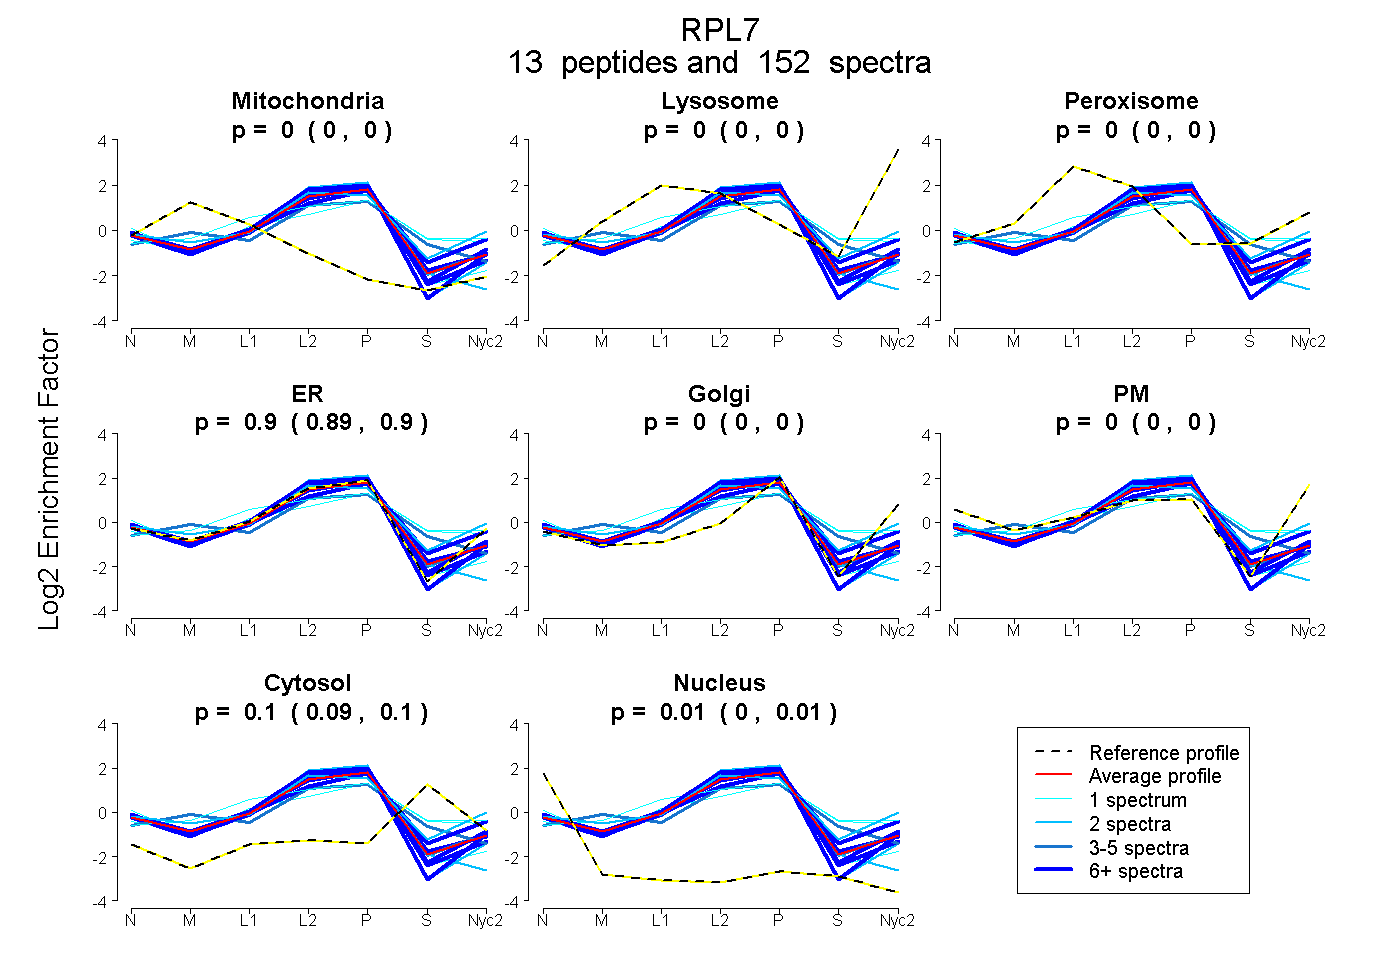
| Plot | Mito | Lyso | Perox | ER | Golgi | PM | Cytosol | Nucleus | |||||
| Expt A |
13 peptides |
152 spectra |
|
0.000 0.000 | 0.003 |
0.000 0.000 | 0.000 |
0.000 0.000 | 0.000 |
0.898 0.894 | 0.901 |
0.000 0.000 | 0.000 |
0.000 0.000 | 0.000 |
0.096 0.090 | 0.102 |
0.005 0.002 | 0.008 |
| 1 spectrum, IVEPYIAWGYPNLK | 0.000 | 0.000 | 0.141 | 0.573 | 0.000 | 0.000 | 0.286 | 0.000 | ||
| 2 spectra, GINGVSPK | 0.000 | 0.000 | 0.000 | 0.969 | 0.000 | 0.000 | 0.000 | 0.031 | ||
| 18 spectra, VLAGLIR | 0.000 | 0.000 | 0.000 | 0.981 | 0.000 | 0.000 | 0.000 | 0.019 | ||
| 2 spectra, VPAVPETLK | 0.000 | 0.019 | 0.119 | 0.717 | 0.000 | 0.032 | 0.113 | 0.000 | ||
| 4 spectra, EDQINR | 0.000 | 0.000 | 0.000 | 0.922 | 0.000 | 0.000 | 0.077 | 0.001 | ||
| 6 spectra, SVNELIYK | 0.000 | 0.000 | 0.031 | 0.806 | 0.000 | 0.000 | 0.163 | 0.000 | ||
| 43 spectra, ASVNMLR | 0.000 | 0.000 | 0.000 | 0.886 | 0.000 | 0.000 | 0.114 | 0.000 | ||
| 2 spectra, FGIICMEDLIHEIYTVGK | 0.000 | 0.000 | 0.000 | 0.878 | 0.000 | 0.000 | 0.007 | 0.115 | ||
| 1 spectrum, VAAAPGTLK | 0.000 | 0.000 | 0.296 | 0.496 | 0.000 | 0.000 | 0.209 | 0.000 | ||
| 1 spectrum, EANNFLWPFK | 0.000 | 0.000 | 0.000 | 0.943 | 0.000 | 0.000 | 0.000 | 0.057 | ||
| 33 spectra, LAFVIR | 0.000 | 0.000 | 0.000 | 0.952 | 0.000 | 0.000 | 0.038 | 0.010 | ||
| 35 spectra, IALTDNSLIAR | 0.000 | 0.000 | 0.000 | 0.952 | 0.000 | 0.000 | 0.000 | 0.048 | ||
| 4 spectra, NFAELK | 0.077 | 0.000 | 0.046 | 0.633 | 0.000 | 0.000 | 0.244 | 0.000 |
| Plot | Mito | Lyso or Perox | ER | Golgi | PM | Cytosol | Nucleus | ||||||
| Expt B |
14 peptides |
77 spectra |
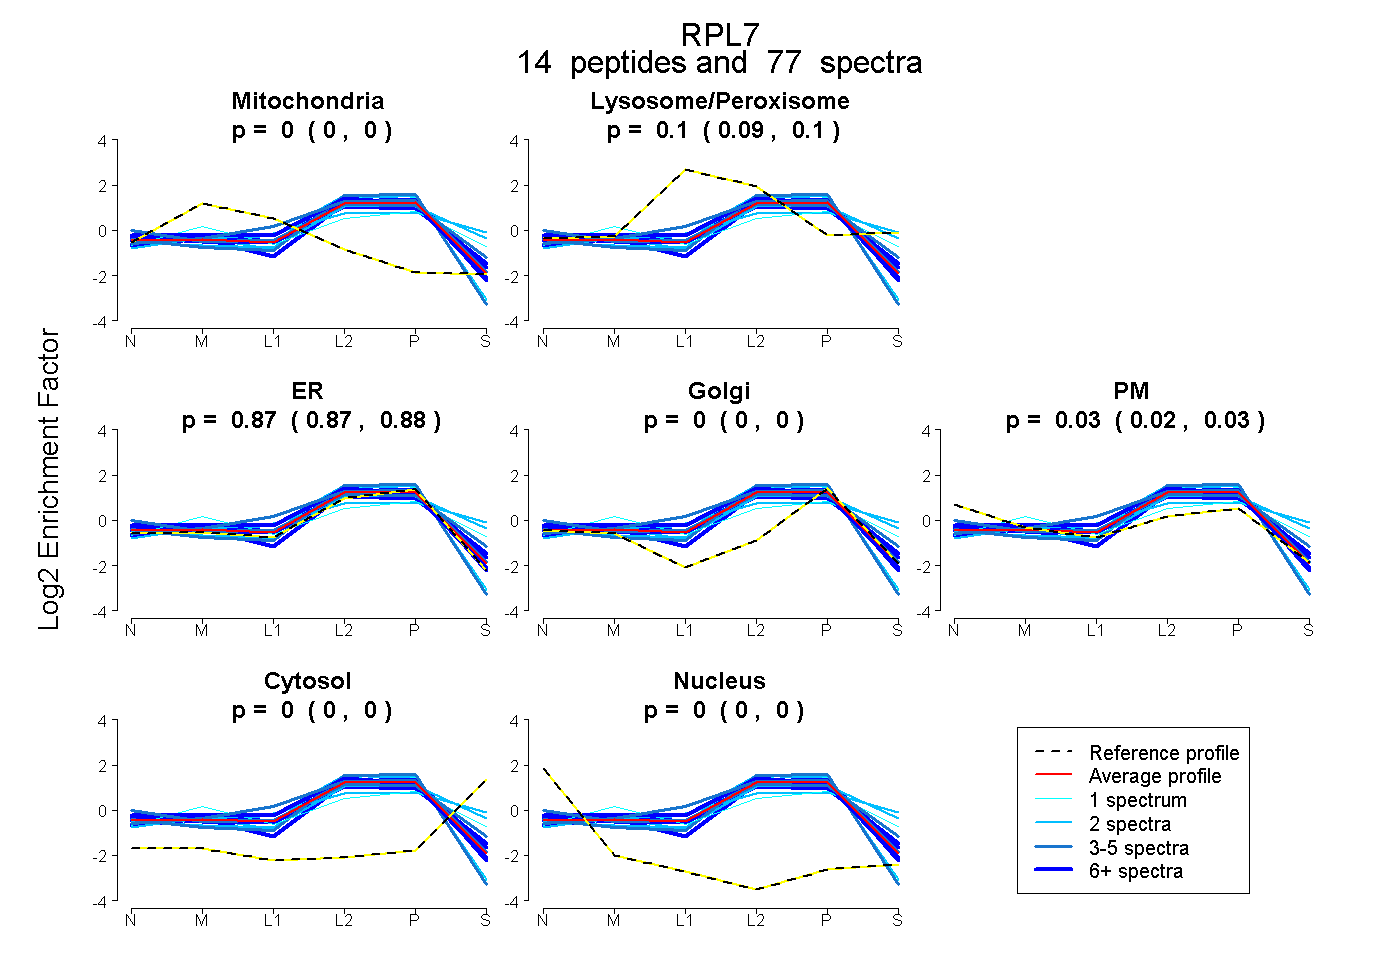 |
0.000 0.000 | 0.000 |
0.098 0.092 | 0.102 |
0.874 0.866 | 0.882 |
0.000 0.000 | 0.000 |
0.028 0.020 | 0.034 |
0.000 0.000 | 0.000 |
0.000 0.000 | 0.000 |
|||
| Plot | Lyso | Other | |||||||||||
| Expt C |
16 peptides |
218 spectra |
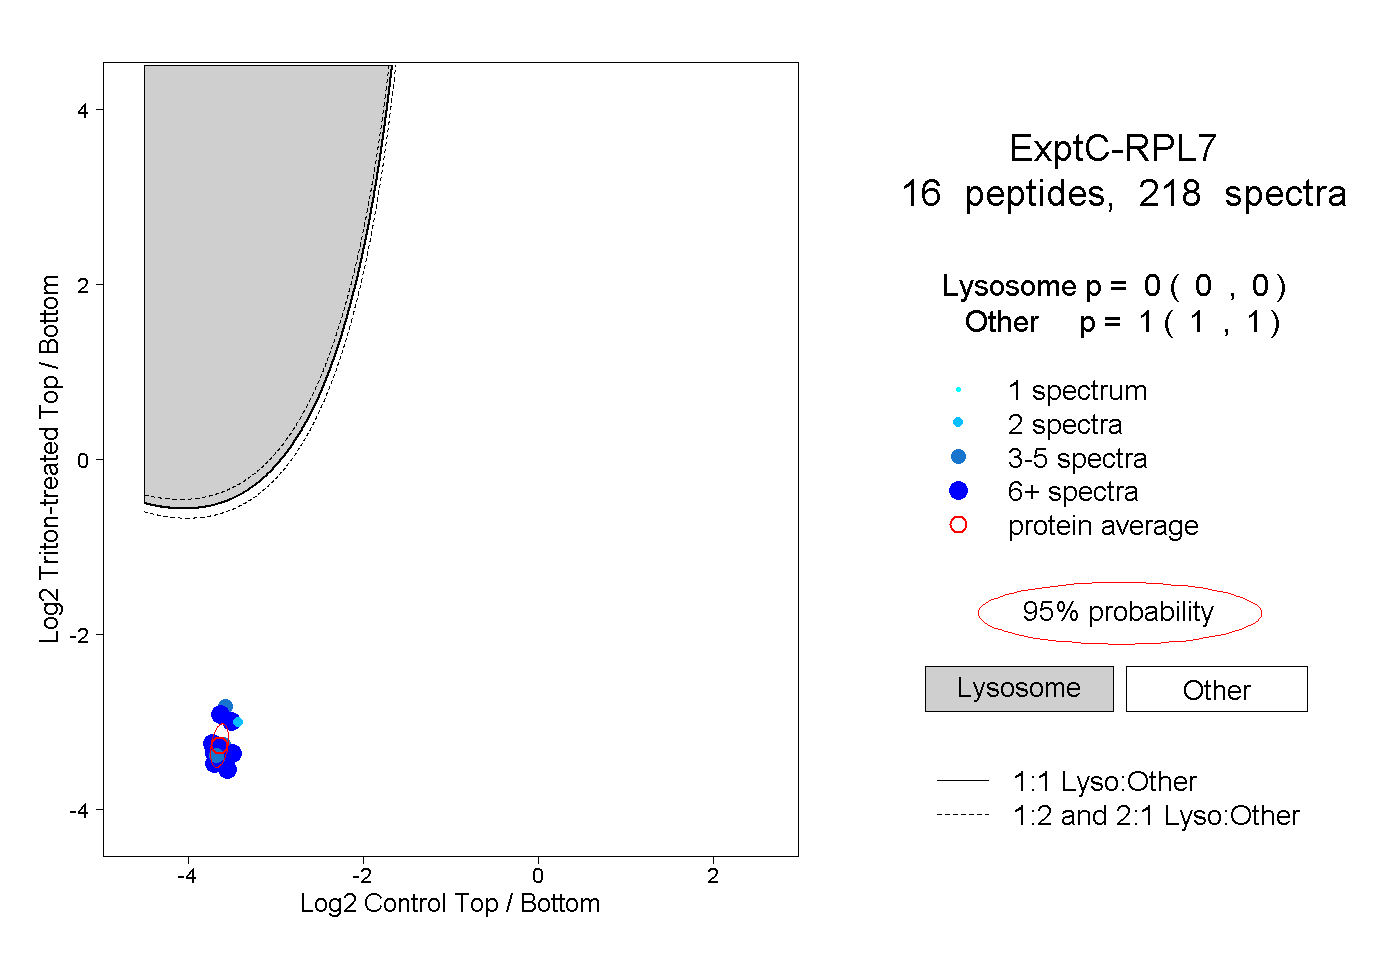 |
0.000 0.000 | 0.000 |
1.000 1.000 | 1.000 |
||||||||
| Plot | Lyso | Other | |||||||||||
| Expt D |
7 peptides |
22 spectra |
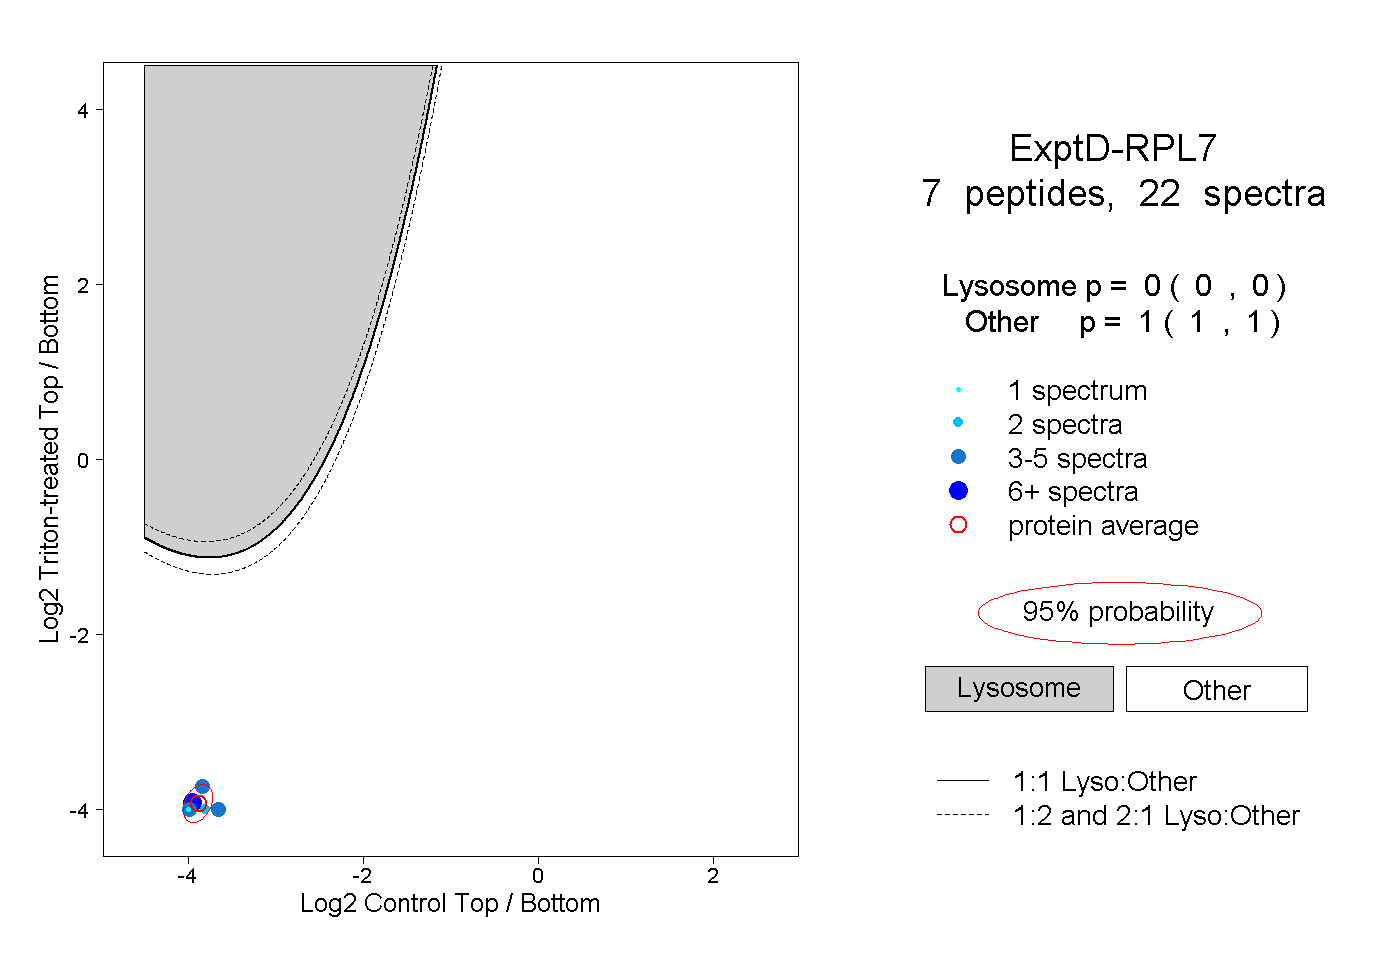 |
0.000 0.000 | 0.000 |
1.000 1.000 | 1.000 |