 8
8peptides
spectra
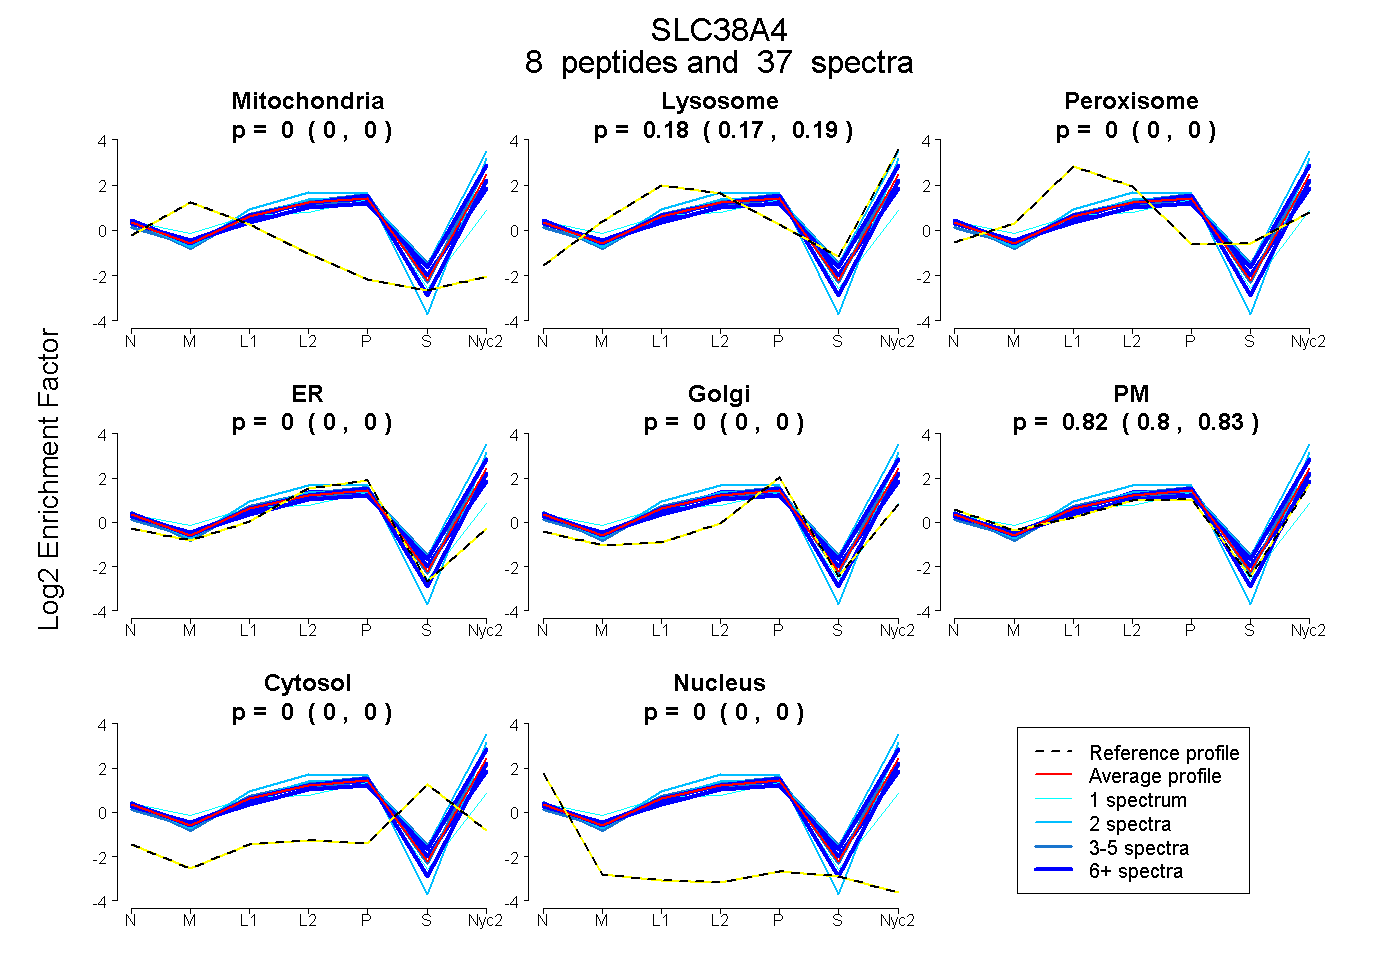
0.000 | 0.000
0.169 | 0.195
0.000 | 0.000
0.000 | 0.000
0.000 | 0.005
0.802 | 0.828
0.000 | 0.000
0.000 | 0.000
5peptides
spectra
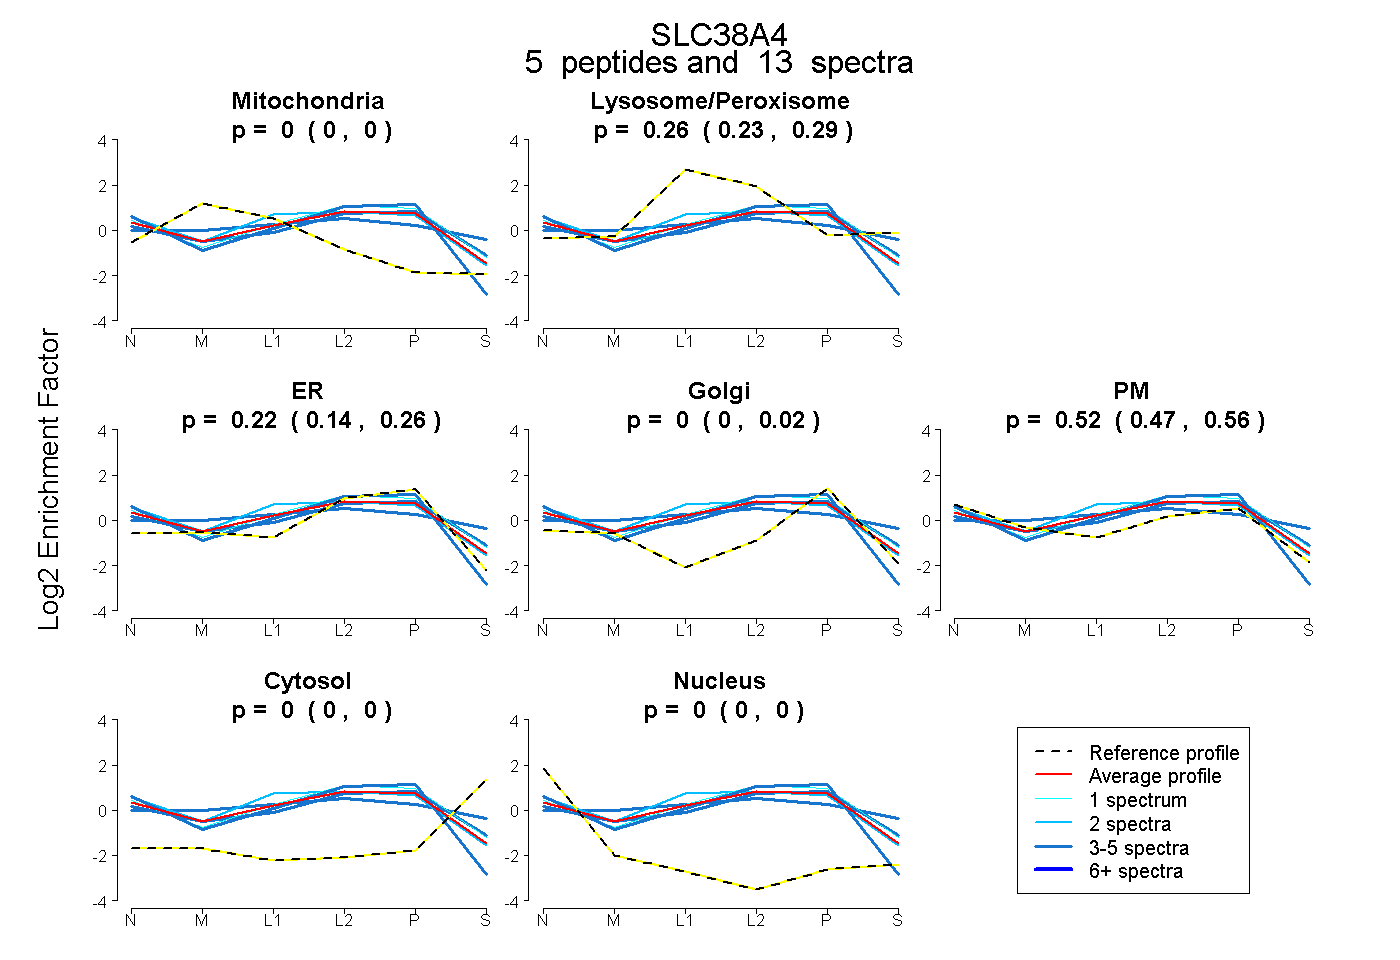
0.000 | 0.000
0.233 | 0.291
0.138 | 0.259
0.000 | 0.025
0.474 | 0.556
0.000 | 0.000
0.000 | 0.000
9peptides
spectra
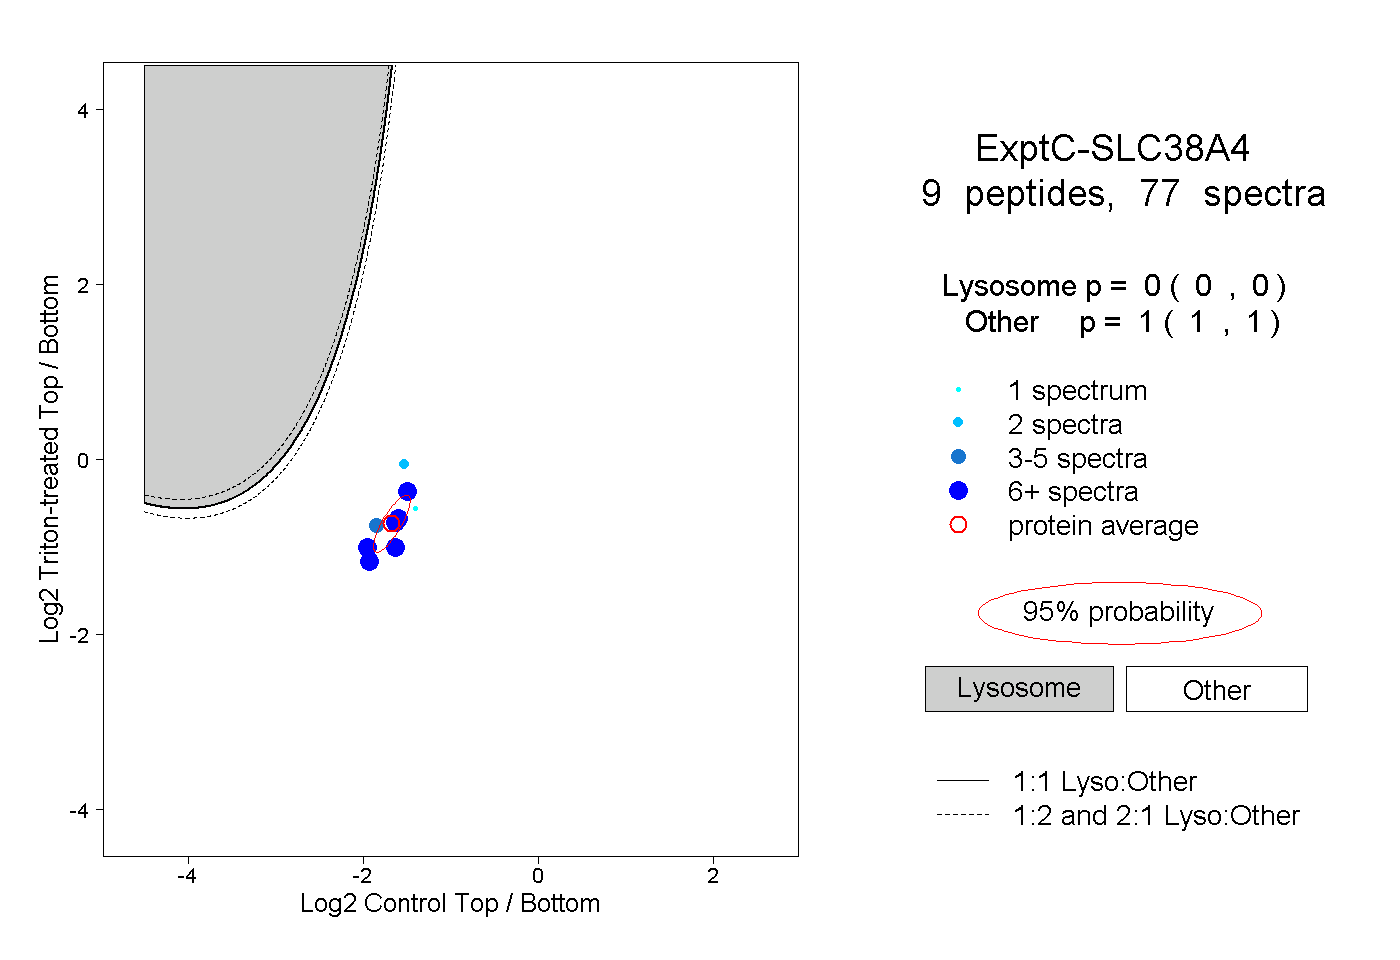
0.000 | 0.000
1.000 | 1.000
3peptides
spectra
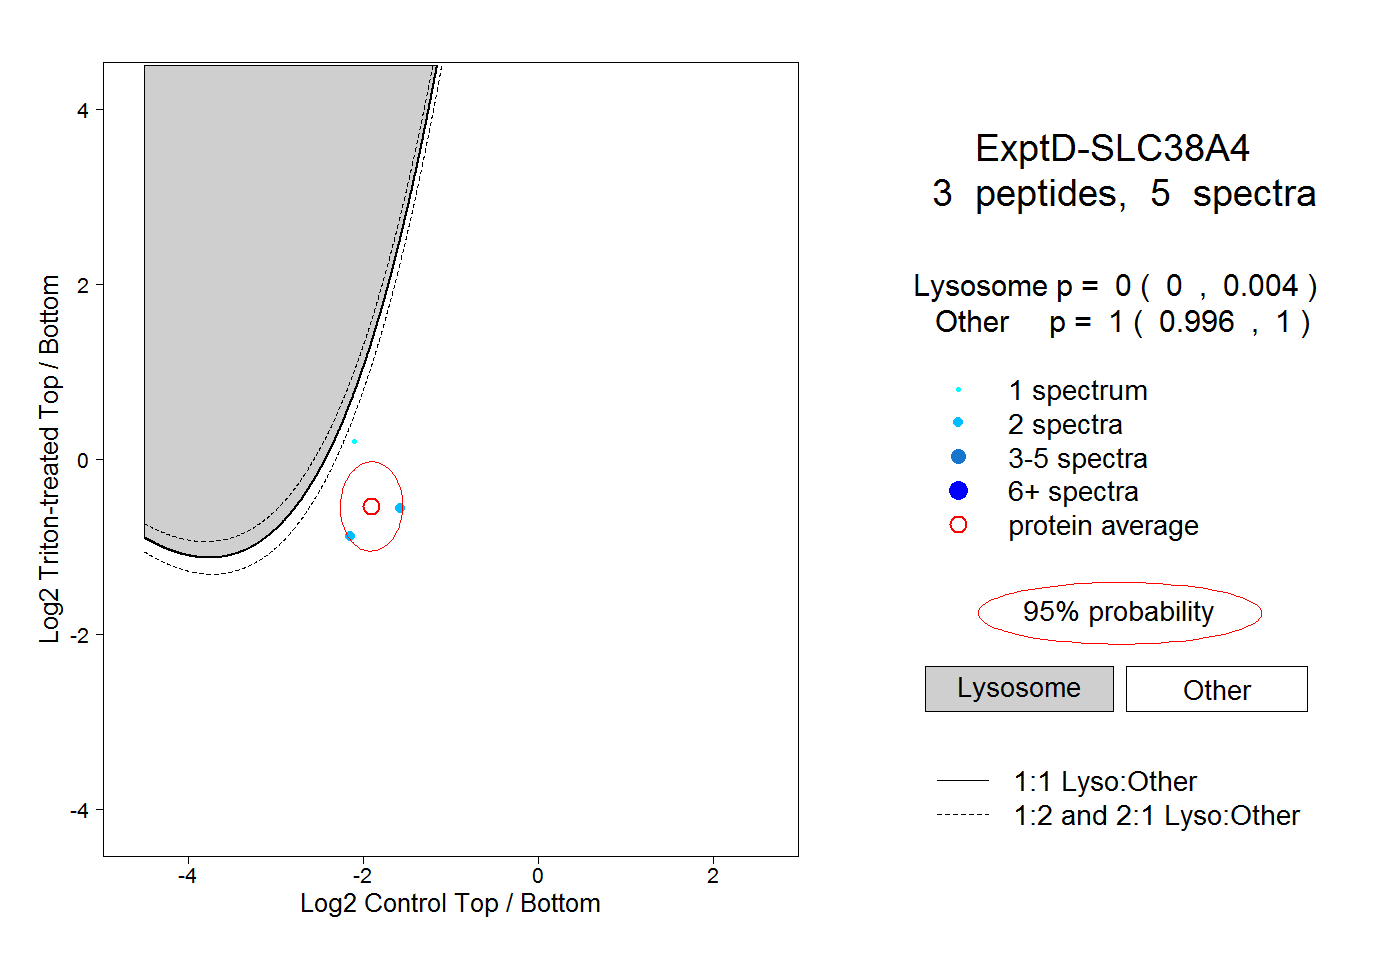
0.000 | 0.004
0.996 | 1.000