 8
8peptides
spectra
0.000 | 0.000
0.169 | 0.195
0.000 | 0.000
0.000 | 0.000
0.000 | 0.005
0.802 | 0.828
0.000 | 0.000
0.000 | 0.000
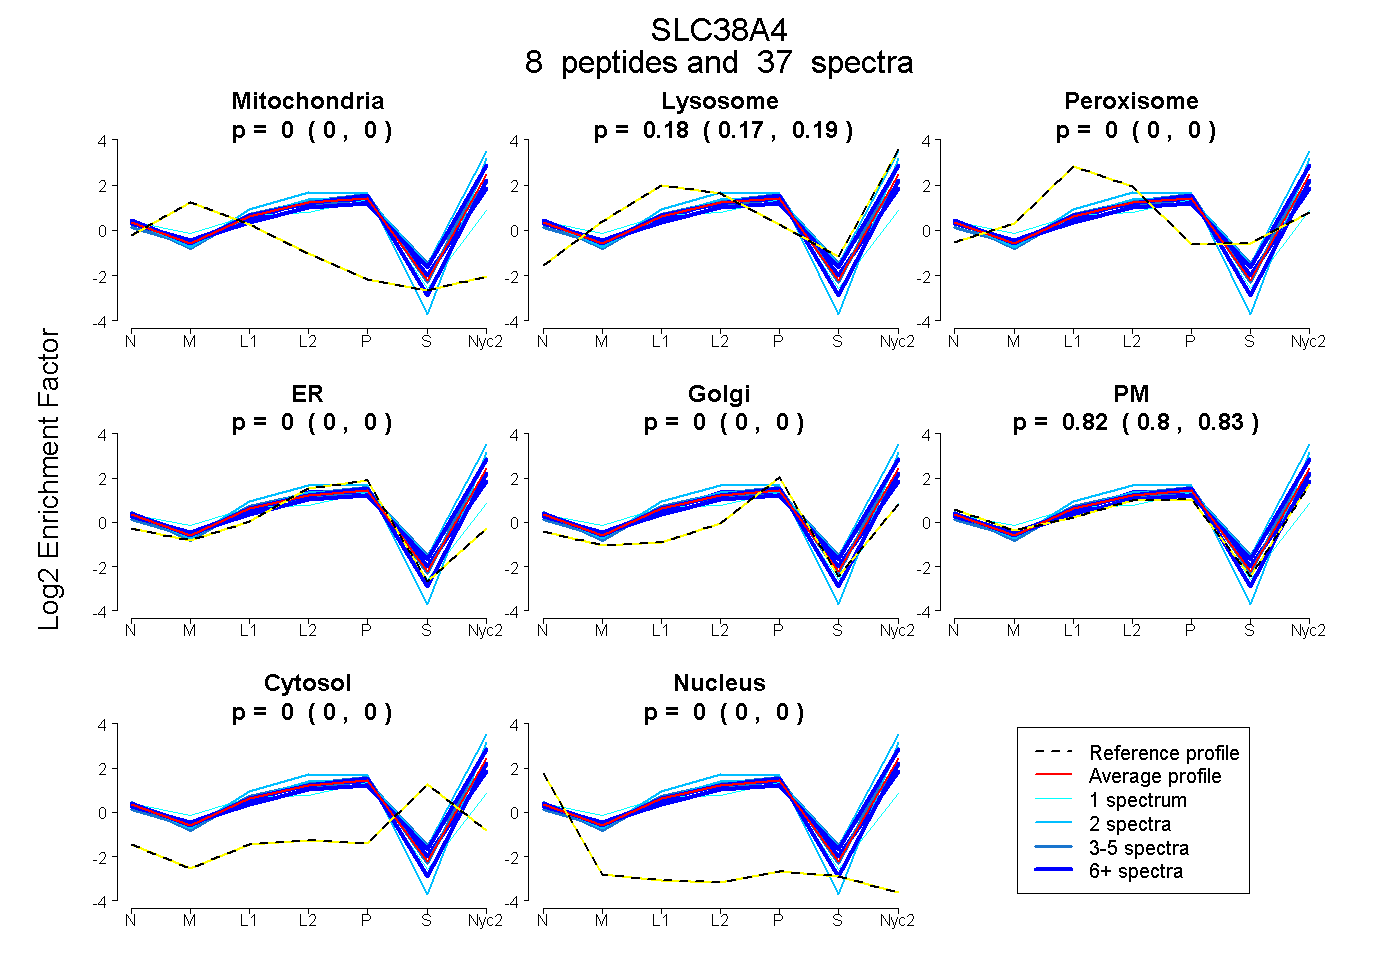
| Plot | Mito | Lyso | Perox | ER | Golgi | PM | Cytosol | Nucleus | |||||
| Expt A |
8 peptides |
37 spectra |
|
0.000 0.000 | 0.000 |
0.183 0.169 | 0.195 |
0.000 0.000 | 0.000 |
0.000 0.000 | 0.000 |
0.000 0.000 | 0.005 |
0.817 0.802 | 0.828 |
0.000 0.000 | 0.000 |
0.000 0.000 | 0.000 |
| 5 spectra, RPFSWVK | 0.000 | 0.207 | 0.000 | 0.000 | 0.000 | 0.793 | 0.000 | 0.000 | ||
| 2 spectra, VYTFDTALLMVR | 0.000 | 0.378 | 0.000 | 0.000 | 0.000 | 0.622 | 0.000 | 0.000 | ||
| 2 spectra, TSVITLLFPR | 0.000 | 0.158 | 0.000 | 0.000 | 0.000 | 0.842 | 0.000 | 0.000 | ||
| 5 spectra, AFGWPGK | 0.000 | 0.253 | 0.030 | 0.001 | 0.128 | 0.571 | 0.018 | 0.000 | ||
| 1 spectrum, GAMDSQFANEDAESQK | 0.058 | 0.000 | 0.043 | 0.266 | 0.000 | 0.632 | 0.000 | 0.000 | ||
| 6 spectra, YELPEVIR | 0.000 | 0.259 | 0.000 | 0.000 | 0.023 | 0.718 | 0.000 | 0.000 | ||
| 9 spectra, YFVFNSR | 0.000 | 0.074 | 0.000 | 0.006 | 0.000 | 0.920 | 0.000 | 0.000 | ||
| 7 spectra, EGGSLIYEK | 0.000 | 0.164 | 0.000 | 0.133 | 0.000 | 0.703 | 0.000 | 0.000 |
| Plot | Mito | Lyso or Perox | ER | Golgi | PM | Cytosol | Nucleus | ||||||
| Expt B |
5 peptides |
13 spectra |
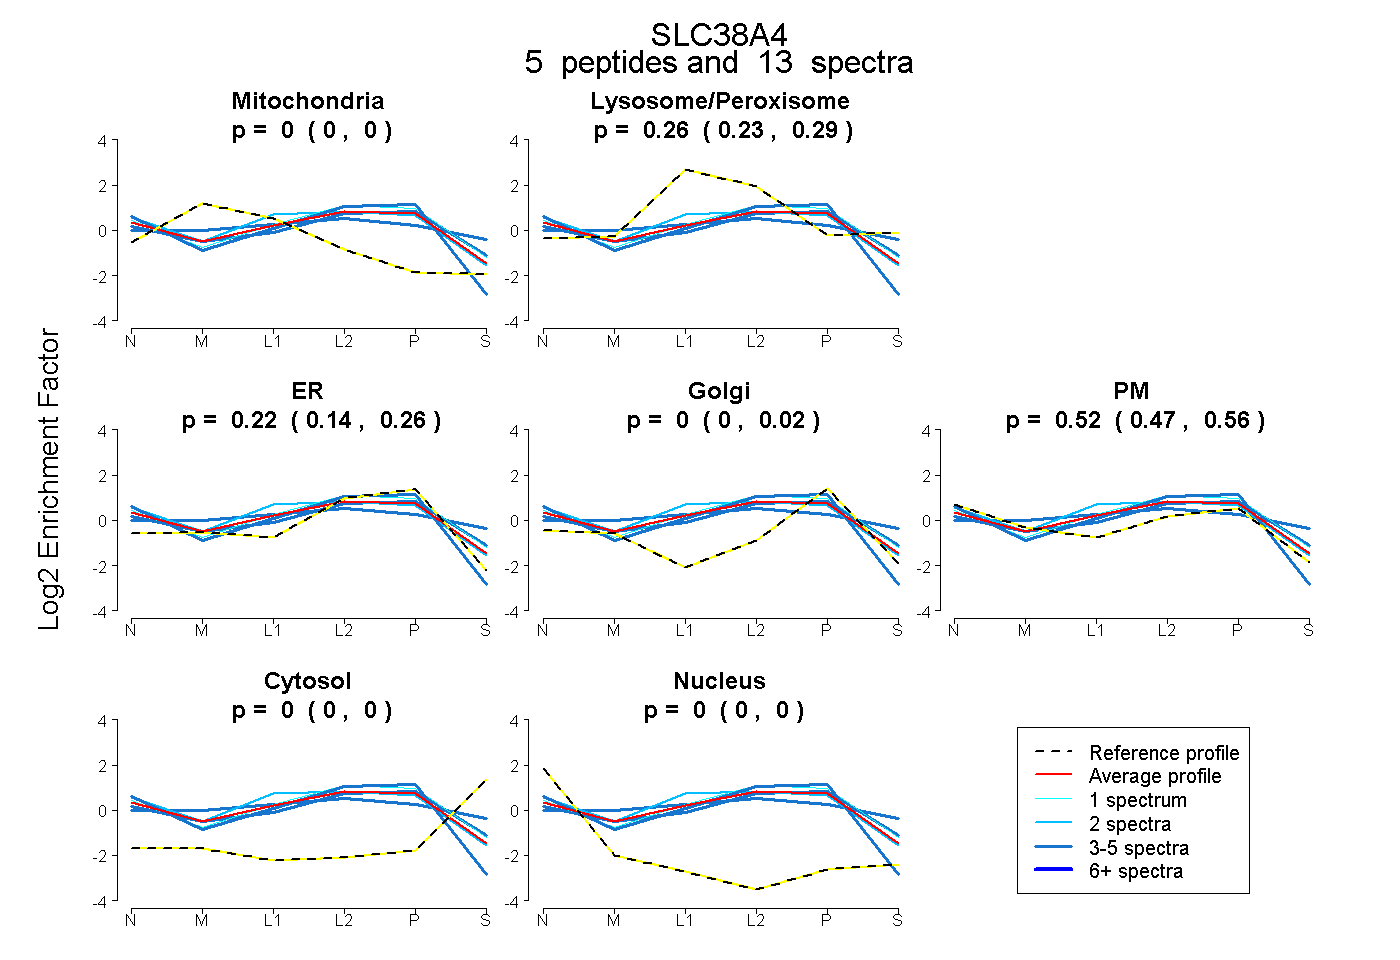 |
0.000 0.000 | 0.000 |
0.263 0.233 | 0.291 |
0.216 0.138 | 0.259 |
0.000 0.000 | 0.025 |
0.521 0.474 | 0.556 |
0.000 0.000 | 0.000 |
0.000 0.000 | 0.000 |
|||
| Plot | Lyso | Other | |||||||||||
| Expt C |
9 peptides |
77 spectra |
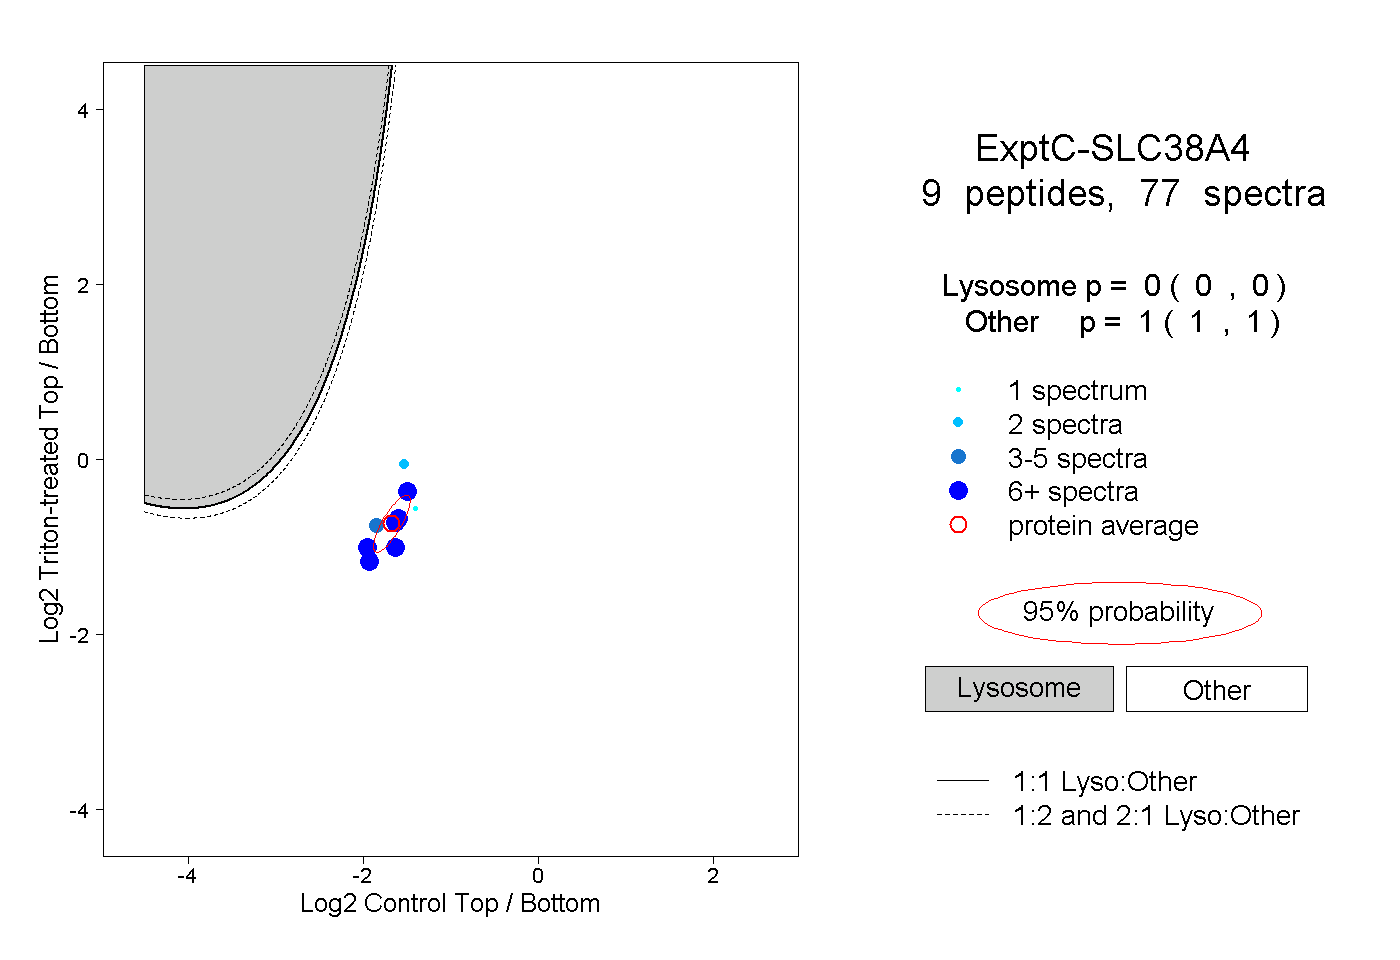 |
0.000 0.000 | 0.000 |
1.000 1.000 | 1.000 |
||||||||
| Plot | Lyso | Other | |||||||||||
| Expt D |
3 peptides |
5 spectra |
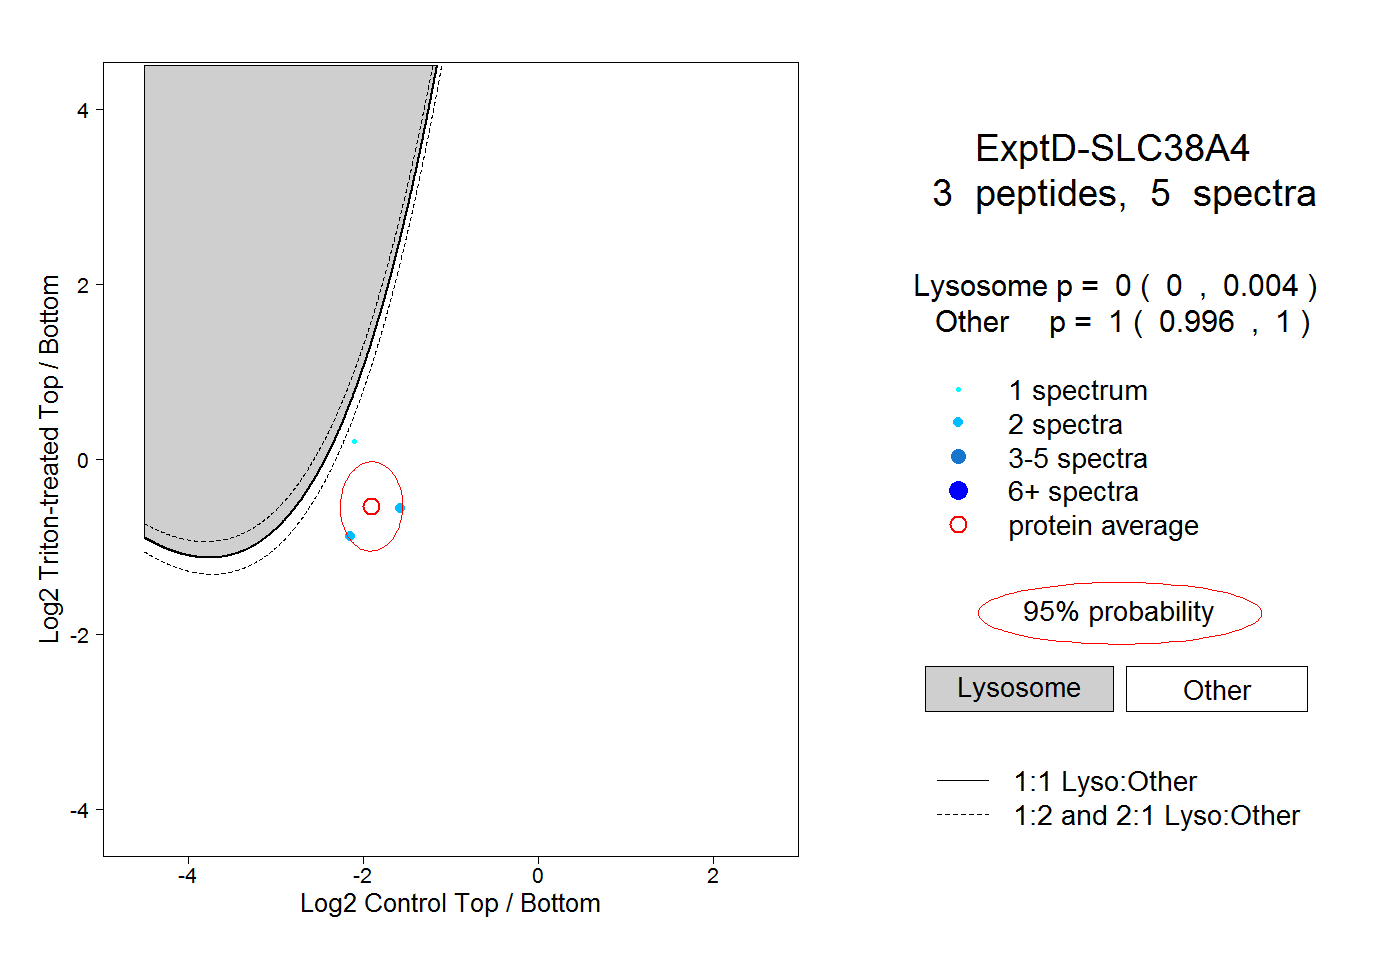 |
0.000 0.000 | 0.004 |
1.000 0.996 | 1.000 |