SLC38A4
[ENSRNOP00000009187]
Main page
| | | Plot |
Mito |
Lyso |
|
Perox |
ER |
Golgi |
PM |
Cytosol |
Nucleus |
|
| Expt A |
 8
8
peptides |
37
spectra |
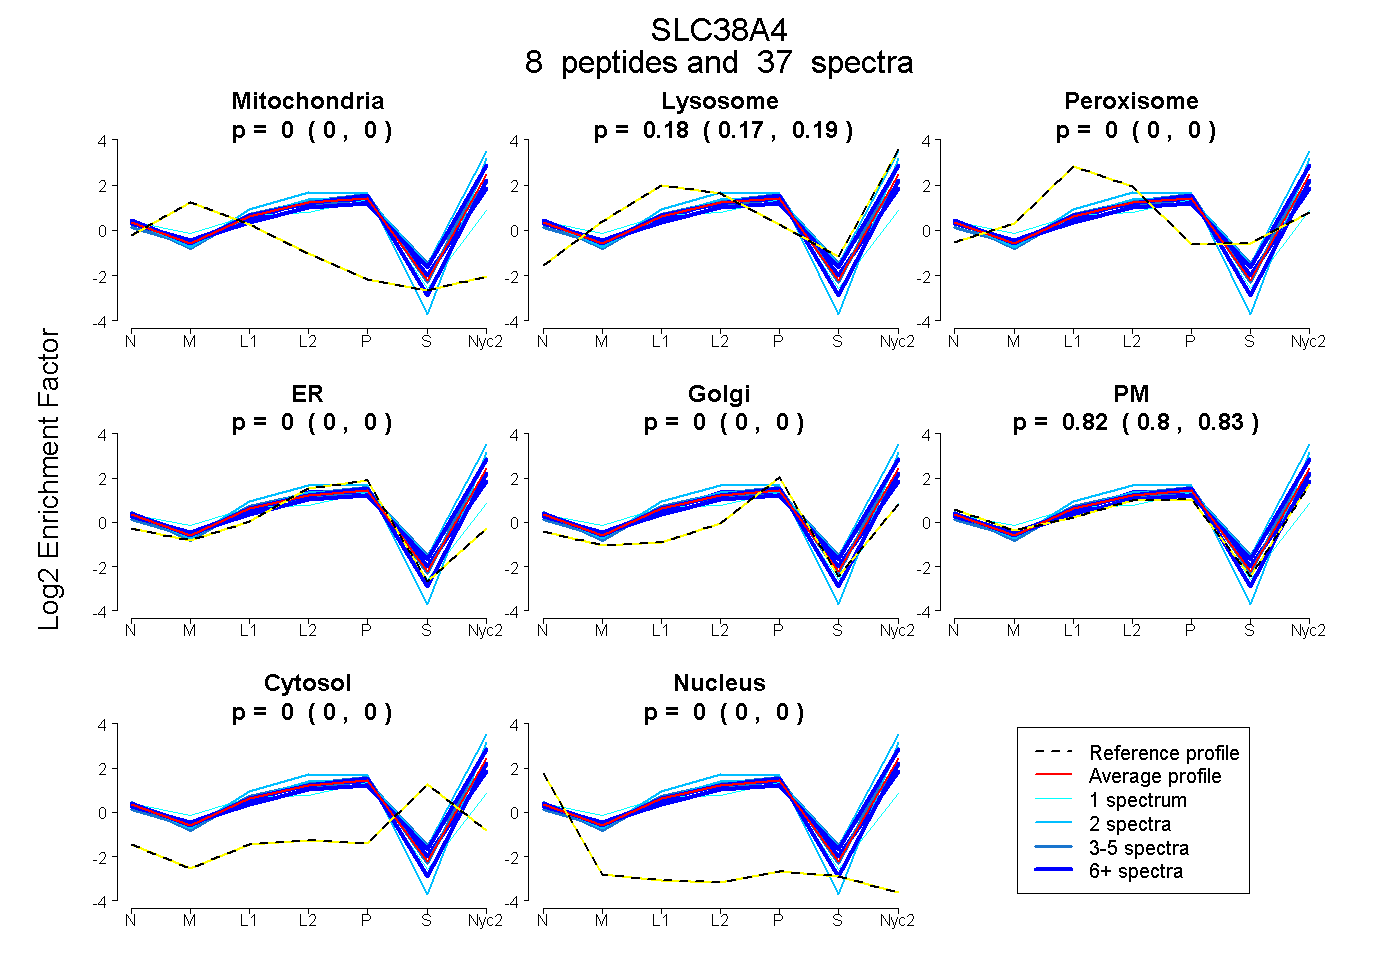 |
0.000
0.000 | 0.000 |
0.183
0.169 | 0.195 |
|
0.000
0.000 | 0.000 |
0.000
0.000 | 0.000 |
0.000
0.000 | 0.005 |
0.817
0.802 | 0.828 |
0.000
0.000 | 0.000 |
0.000
0.000 | 0.000 |
|
| | | Plot |
Mito |
|
Lyso or Perox |
|
ER |
Golgi |
PM |
Cytosol |
Nucleus |
|
| Expt B |
5
peptides |
13
spectra |
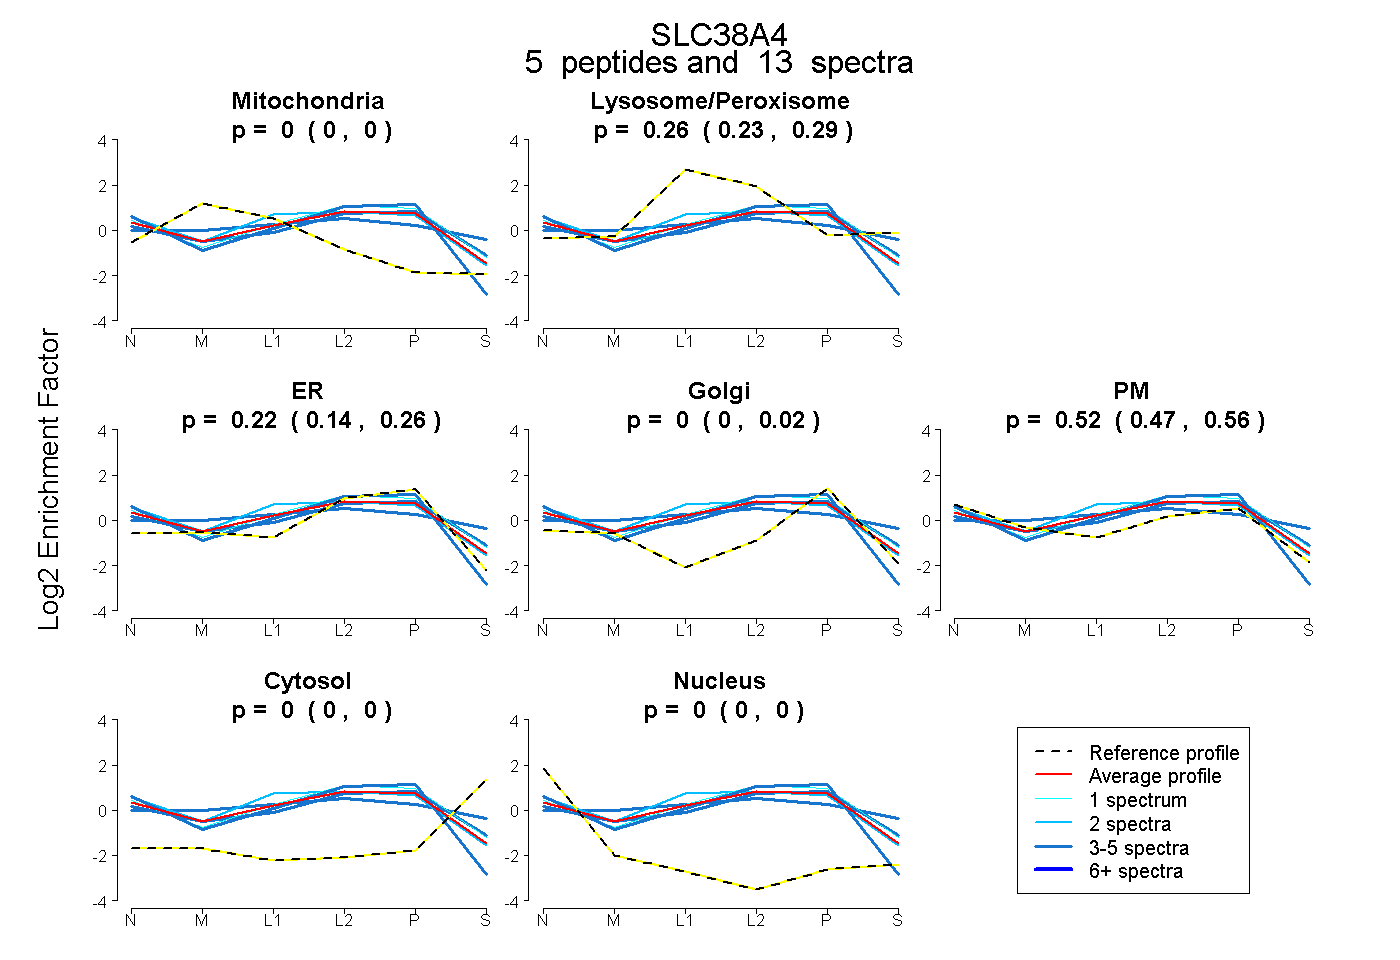 |
0.000
0.000 | 0.000 |
|
0.263
0.233 | 0.291 |
|
0.216
0.138 | 0.259 |
0.000
0.000 | 0.025 |
0.521
0.474 | 0.556 |
0.000
0.000 | 0.000 |
0.000
0.000 | 0.000 |
|
| 2 spectra, RPFSWVK |
0.000 |
|
0.343 |
|
0.078 |
0.000 |
0.579 |
0.000 |
0.000 |
|
| 3 spectra, AFGWPGK |
0.000 |
|
0.418 |
|
0.000 |
0.115 |
0.352 |
0.115 |
0.000 |
|
| 4 spectra, YFVFNSR |
0.000 |
|
0.087 |
|
0.523 |
0.000 |
0.390 |
0.000 |
0.000 |
|
| 1 spectrum, YELPEVIR |
0.000 |
|
0.294 |
|
0.287 |
0.000 |
0.419 |
0.000 |
0.000 |
|
| 3 spectra, EGGSLIYEK |
0.000 |
|
0.299 |
|
0.133 |
0.198 |
0.371 |
0.000 |
0.000 |
|
| | | Plot |
|
Lyso |
|
|
|
|
|
|
|
Other |
| Expt C |
9
peptides |
77
spectra |
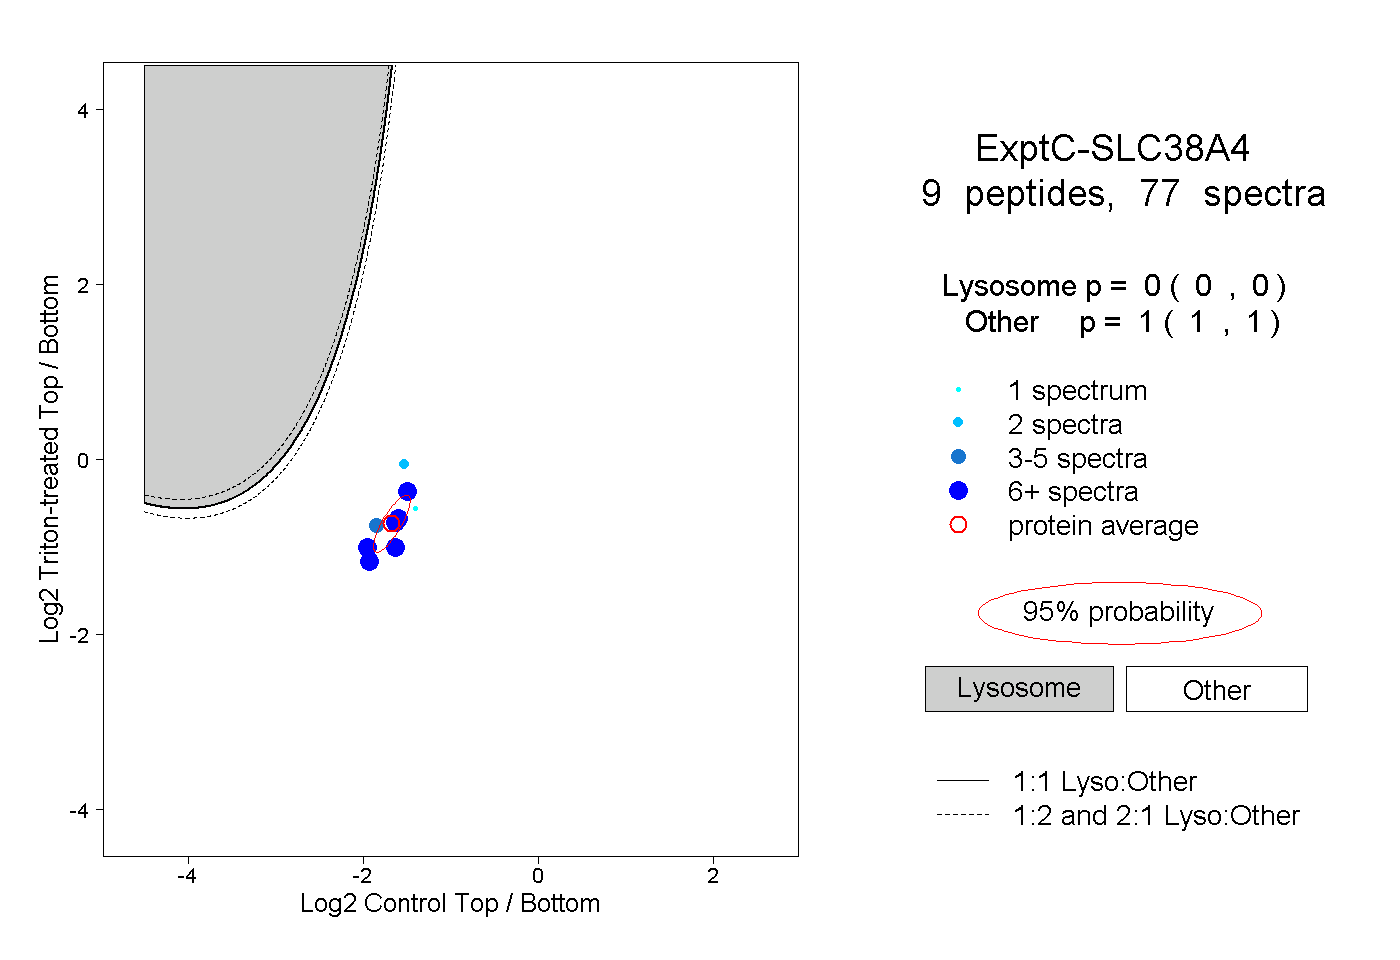 |
|
0.000
0.000 | 0.000 |
|
|
|
|
|
|
|
1.000
1.000 | 1.000 |
| | | Plot |
|
Lyso |
|
|
|
|
|
|
|
Other |
| Expt D |
3
peptides |
5
spectra |
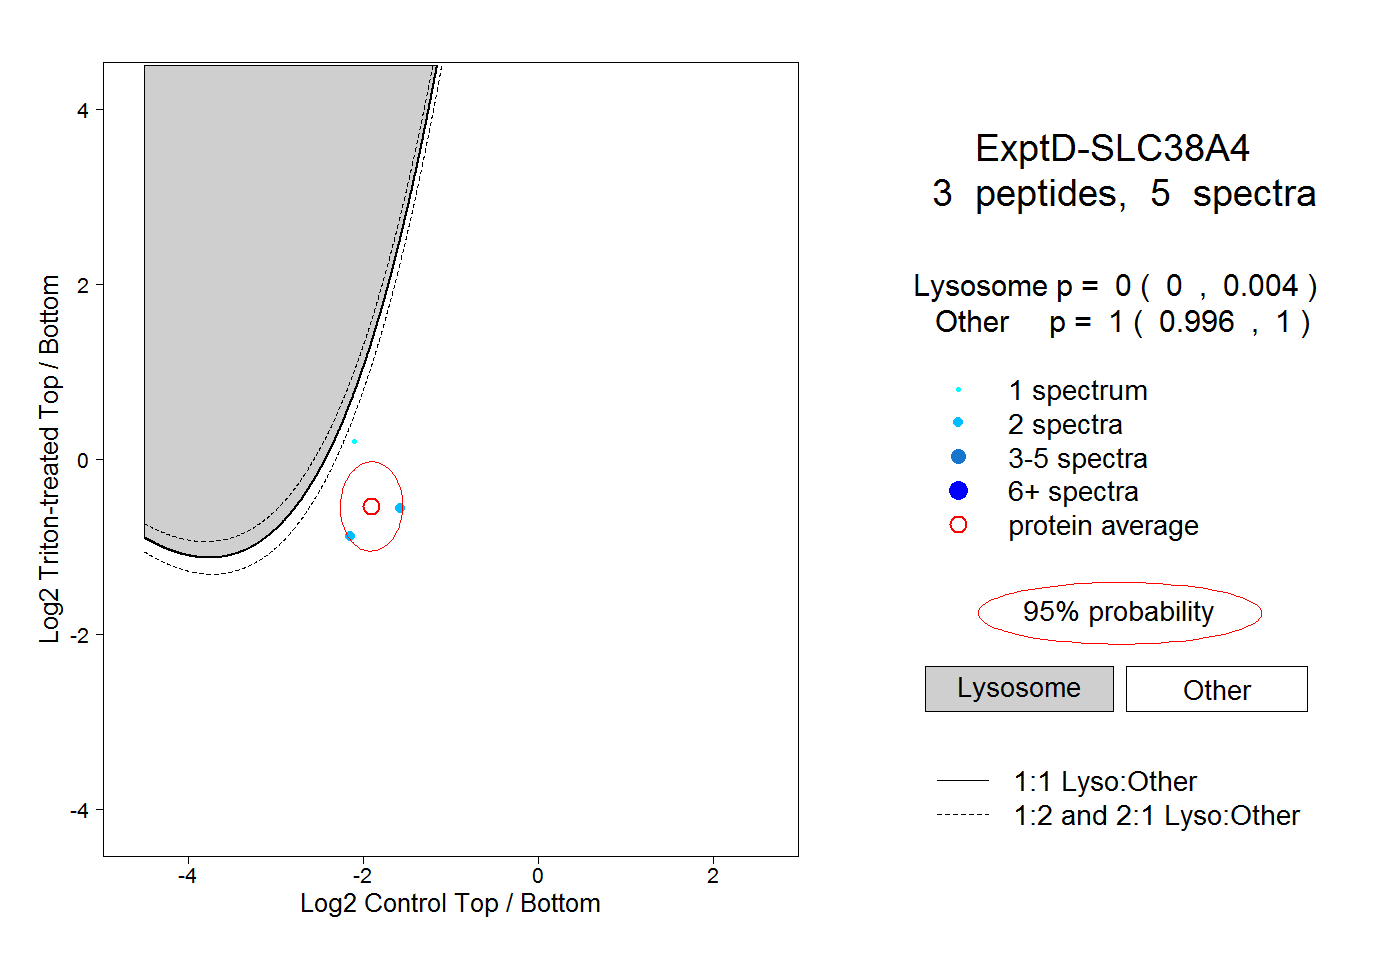 |
|
0.000
0.000 | 0.004 |
|
|
|
|
|
|
|
1.000
0.996 | 1.000 |