 9
9peptides
spectra
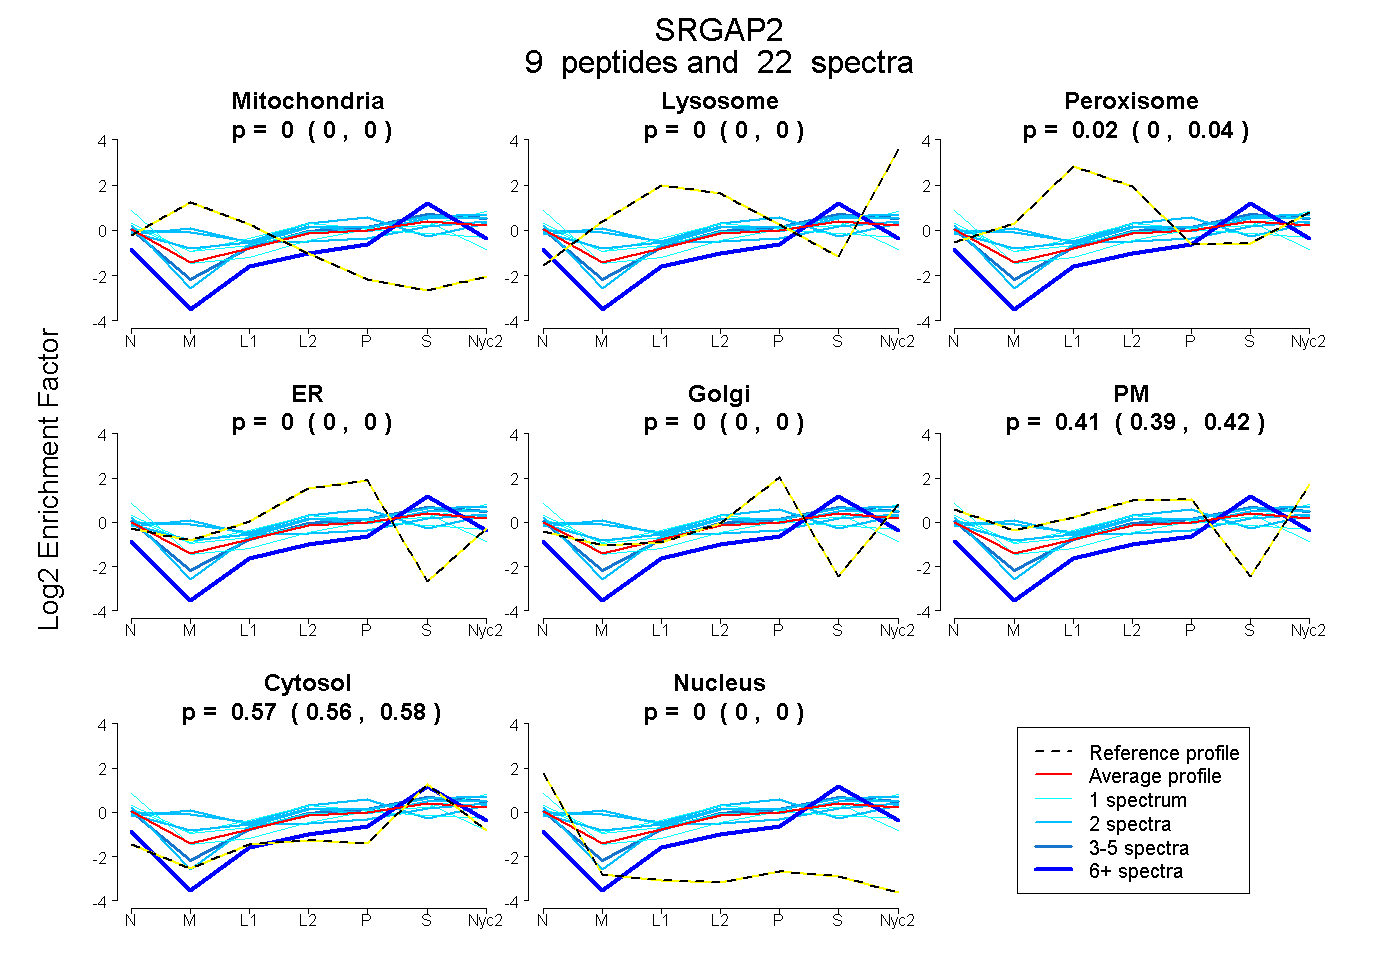
0.000 | 0.000
0.000 | 0.000
0.005 | 0.040
0.000 | 0.000
0.000 | 0.000
0.391 | 0.420
0.555 | 0.581
0.000 | 0.000
2peptides
spectra
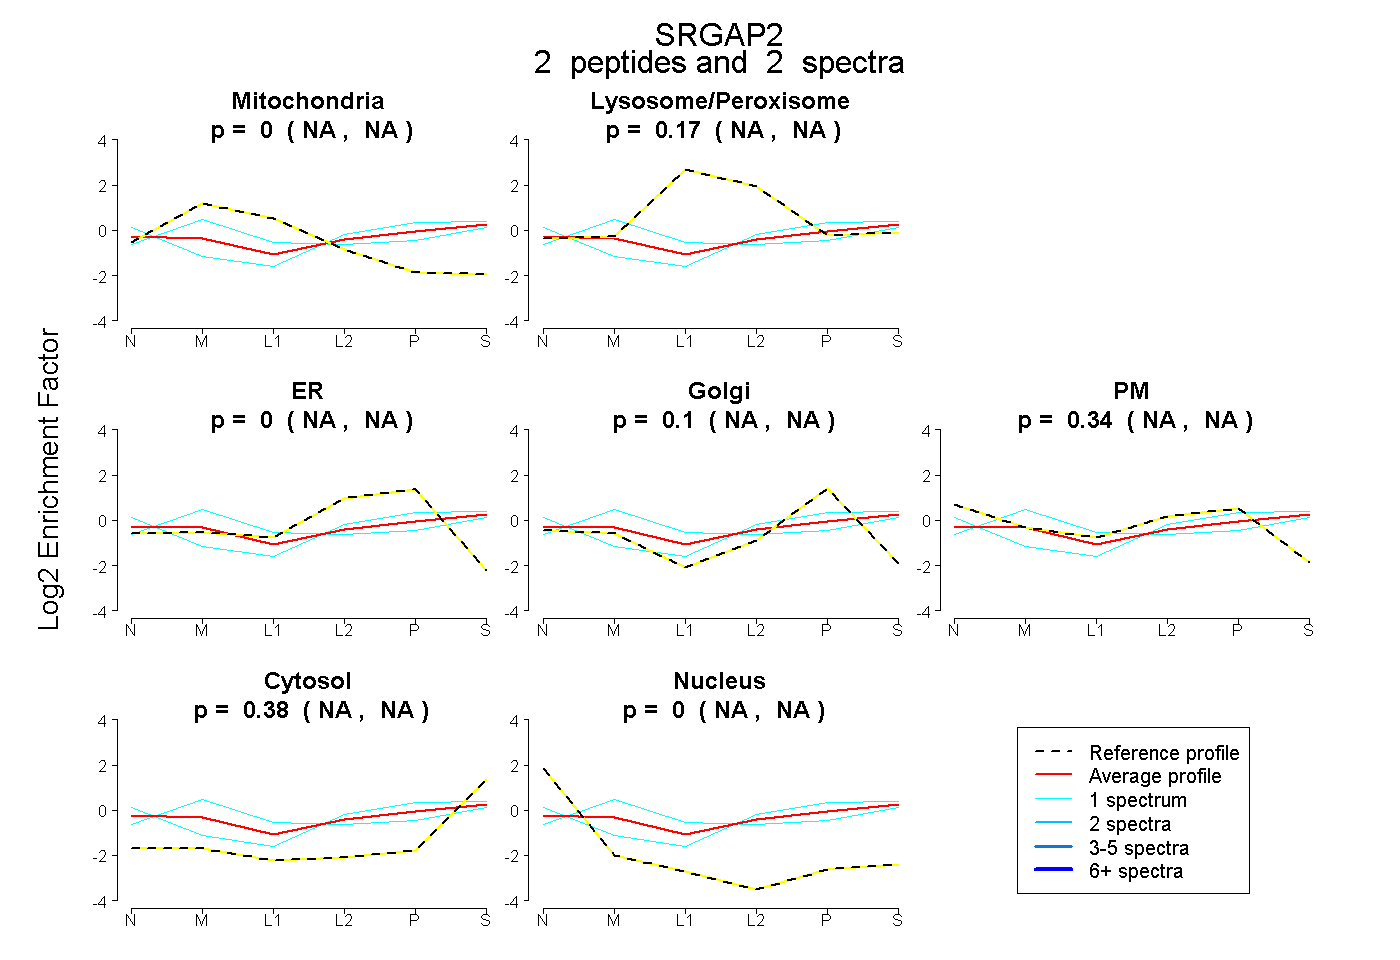
NA | NA
NA | NA
NA | NA
NA | NA
NA | NA
NA | NA
NA | NA
7peptides
spectra
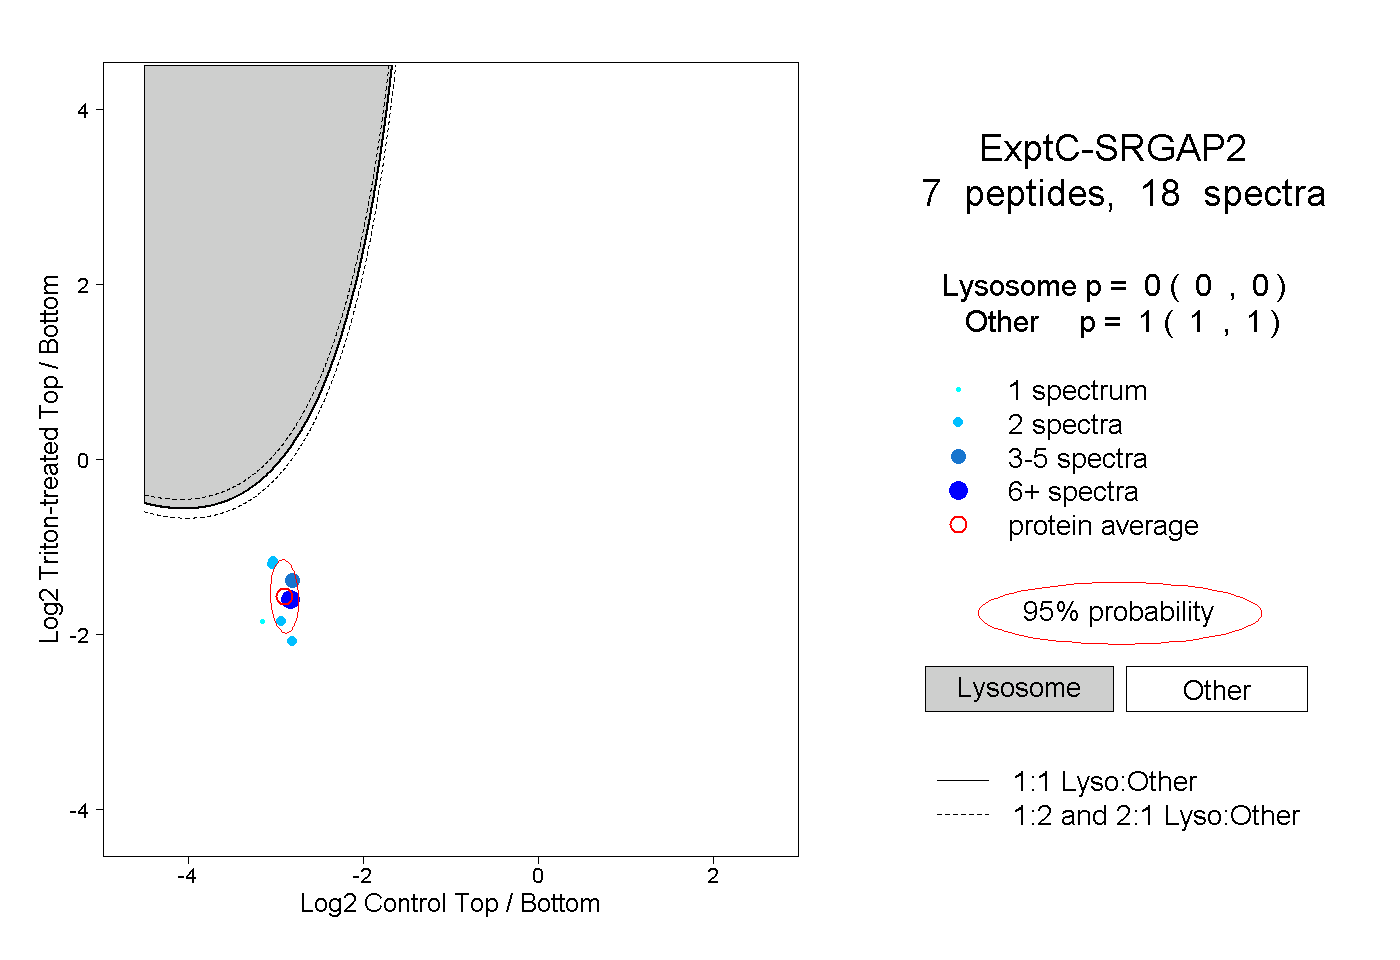
0.000 | 0.000
1.000 | 1.000
1peptide
spectrum
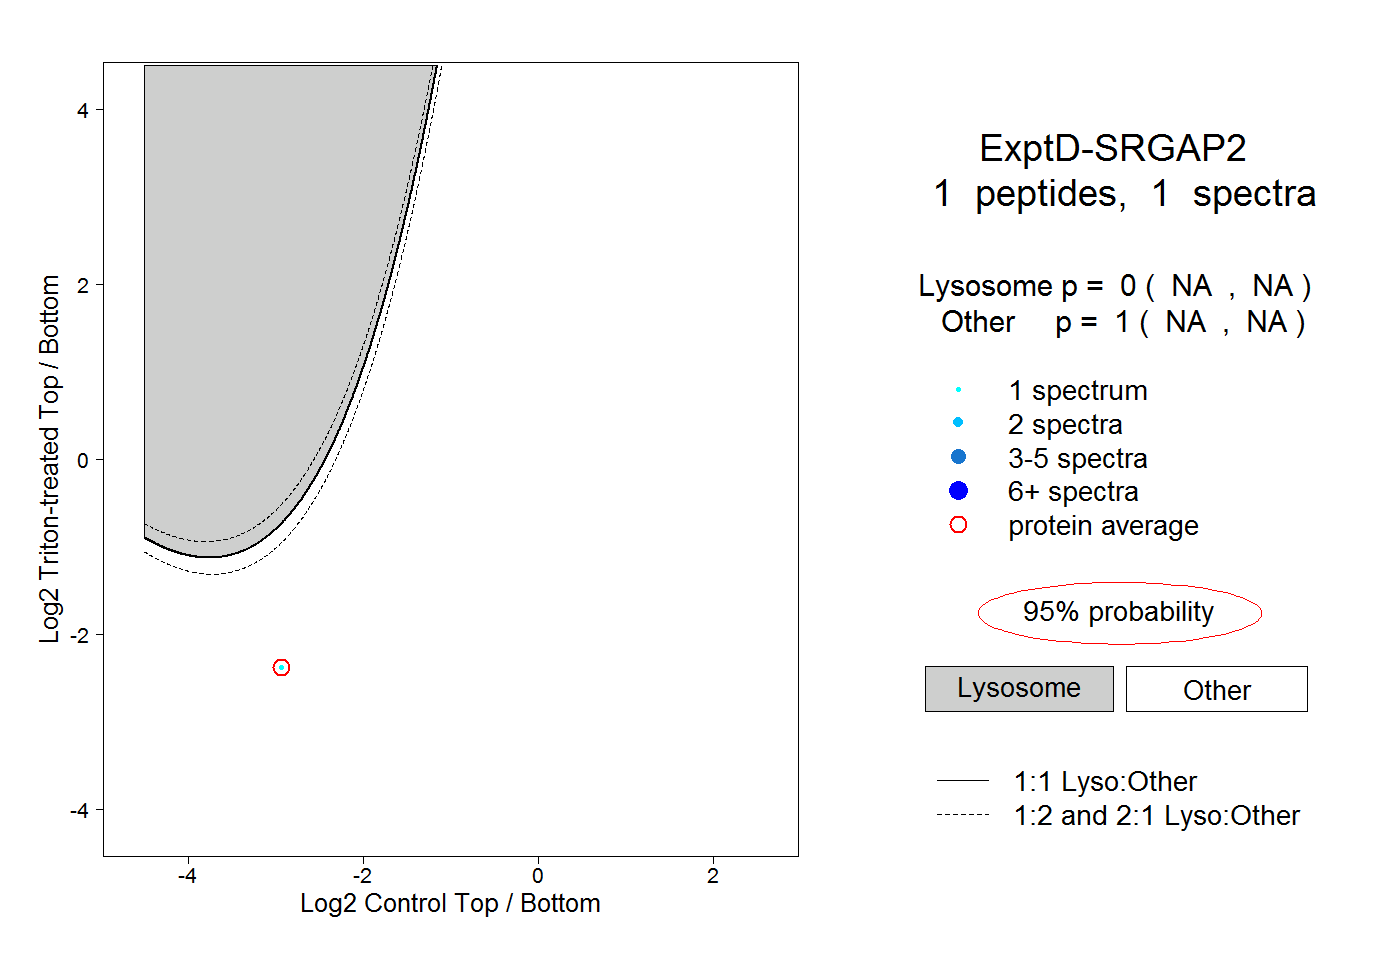
NA | NA
NA | NA