 9
9peptides
spectra
0.000 | 0.000
0.000 | 0.000
0.005 | 0.040
0.000 | 0.000
0.000 | 0.000
0.391 | 0.420
0.555 | 0.581
0.000 | 0.000
2peptides
spectra
NA | NA
NA | NA
NA | NA
NA | NA
NA | NA
NA | NA
NA | NA
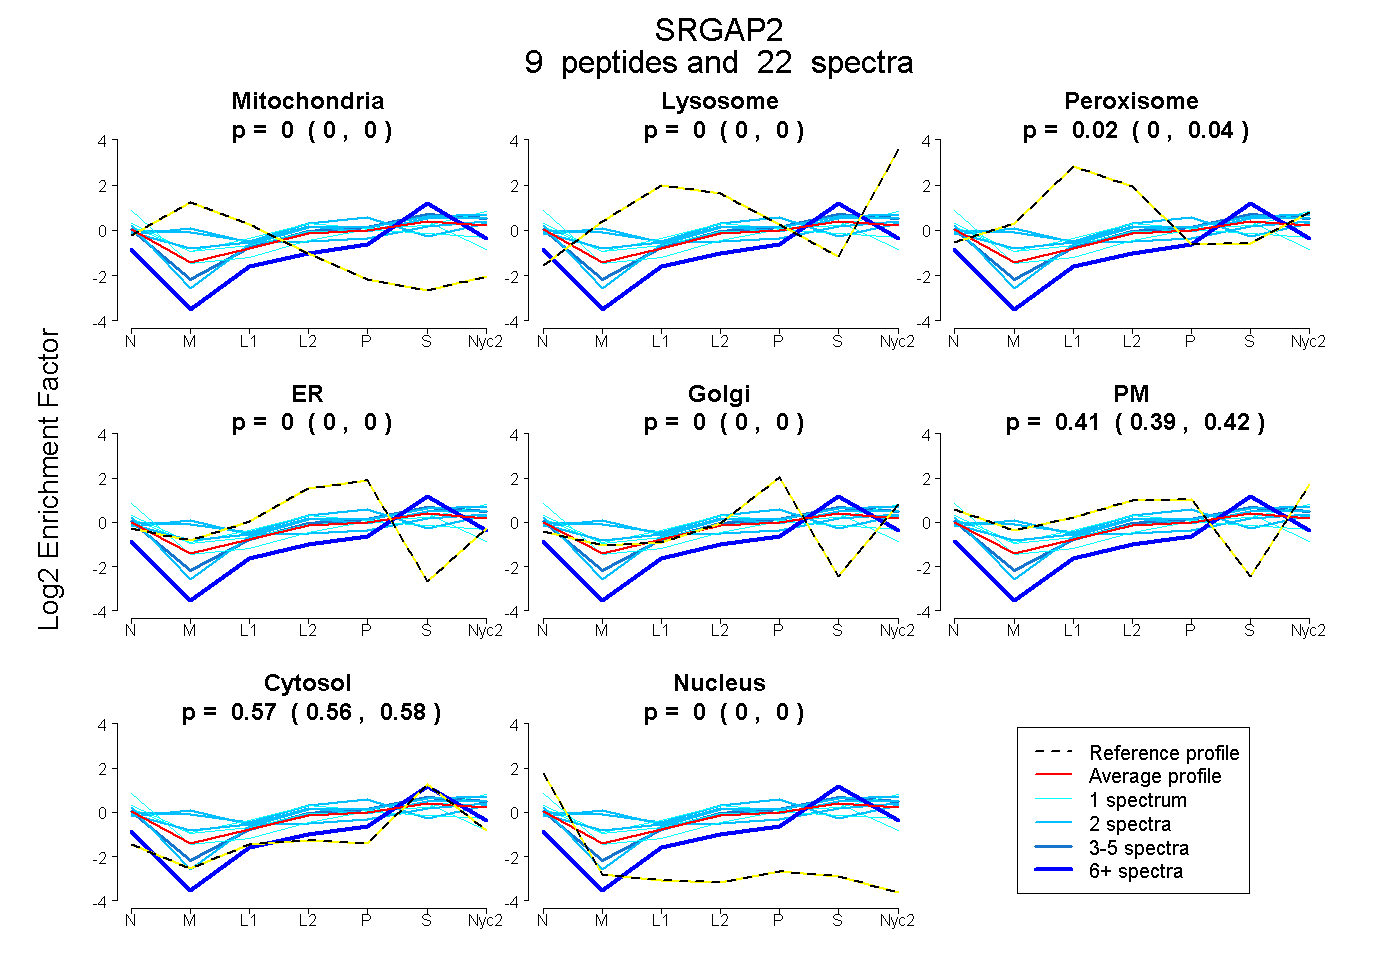
| Plot | Mito | Lyso | Perox | ER | Golgi | PM | Cytosol | Nucleus | |||||
| Expt A |
9 peptides |
22 spectra |
|
0.000 0.000 | 0.000 |
0.000 0.000 | 0.000 |
0.024 0.005 | 0.040 |
0.000 0.000 | 0.000 |
0.000 0.000 | 0.000 |
0.406 0.391 | 0.420 |
0.570 0.555 | 0.581 |
0.000 0.000 | 0.000 |
||
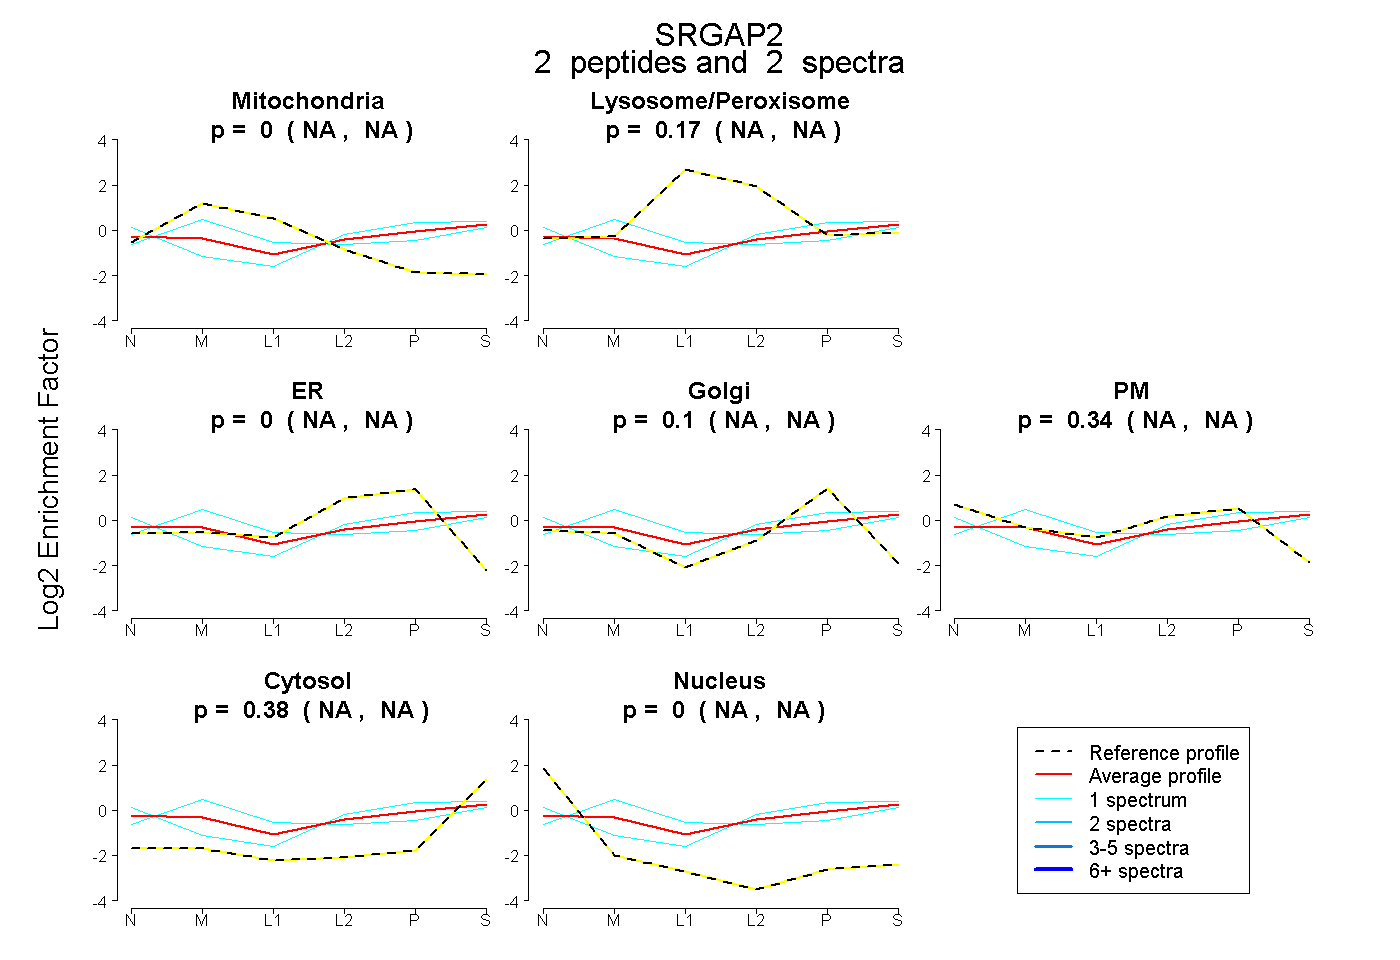
| Plot | Mito | Lyso or Perox | ER | Golgi | PM | Cytosol | Nucleus | ||||||
| Expt B |
2 peptides |
2 spectra |
|
0.000 NA | NA |
0.172 NA | NA |
0.000 NA | NA |
0.104 NA | NA |
0.345 NA | NA |
0.380 NA | NA |
0.000 NA | NA |
| 1 spectrum, FVQVSEDSGR | 0.000 | 0.079 | 0.003 | 0.112 | 0.427 | 0.379 | 0.000 | |||
| 1 spectrum, TIIIQHENIFPNPR | 0.260 | 0.225 | 0.000 | 0.211 | 0.000 | 0.305 | 0.000 |
| Plot | Lyso | Other | |||||||||||
| Expt C |
7 peptides |
18 spectra |
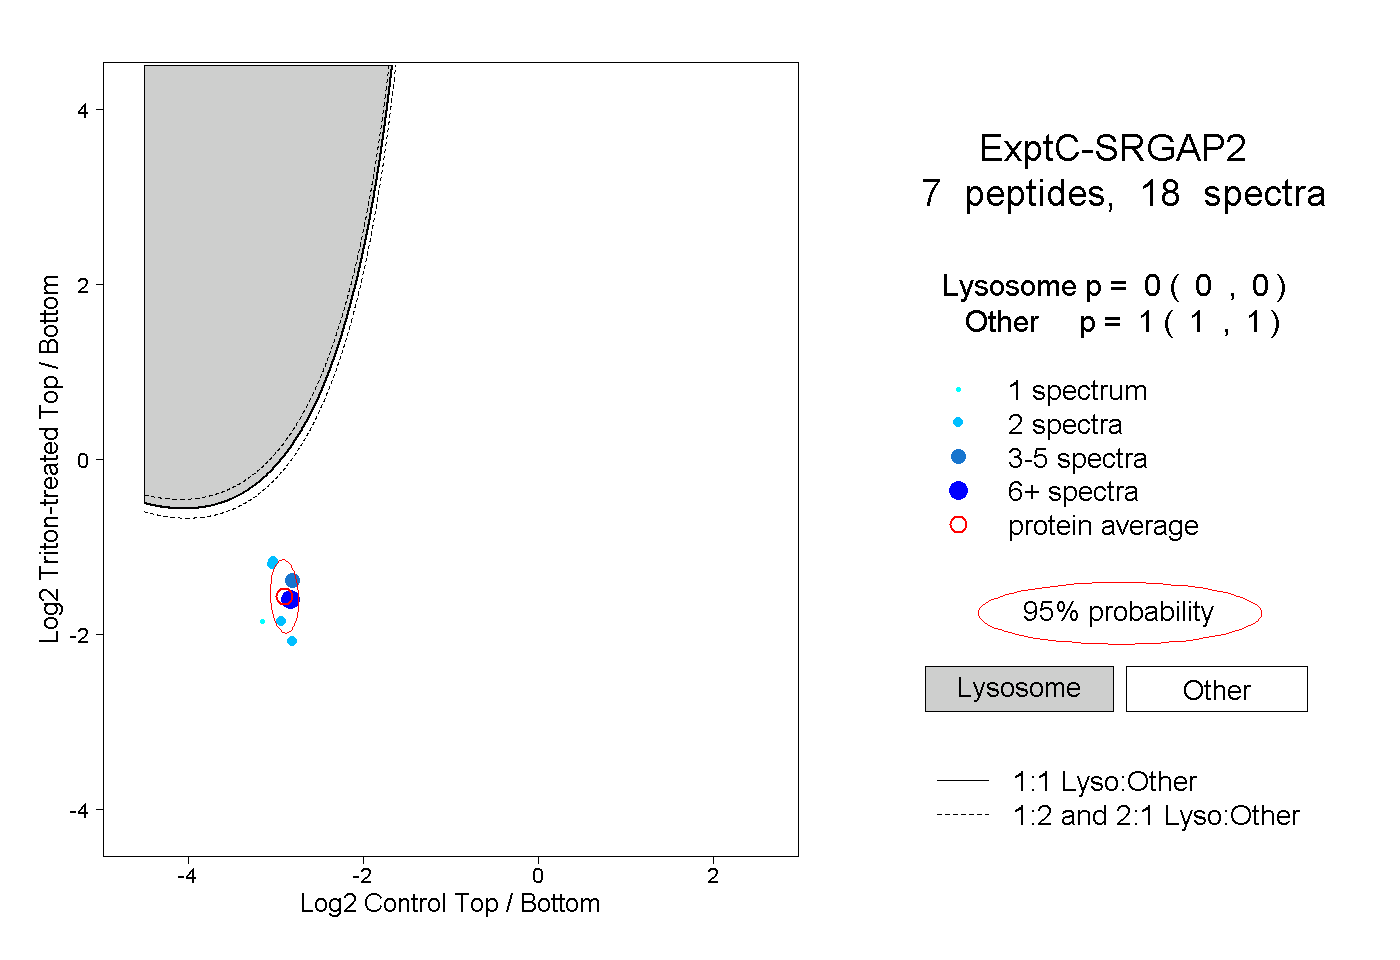 |
0.000 0.000 | 0.000 |
1.000 1.000 | 1.000 |
||||||||
| Plot | Lyso | Other | |||||||||||
| Expt D |
1 peptide |
1 spectrum |
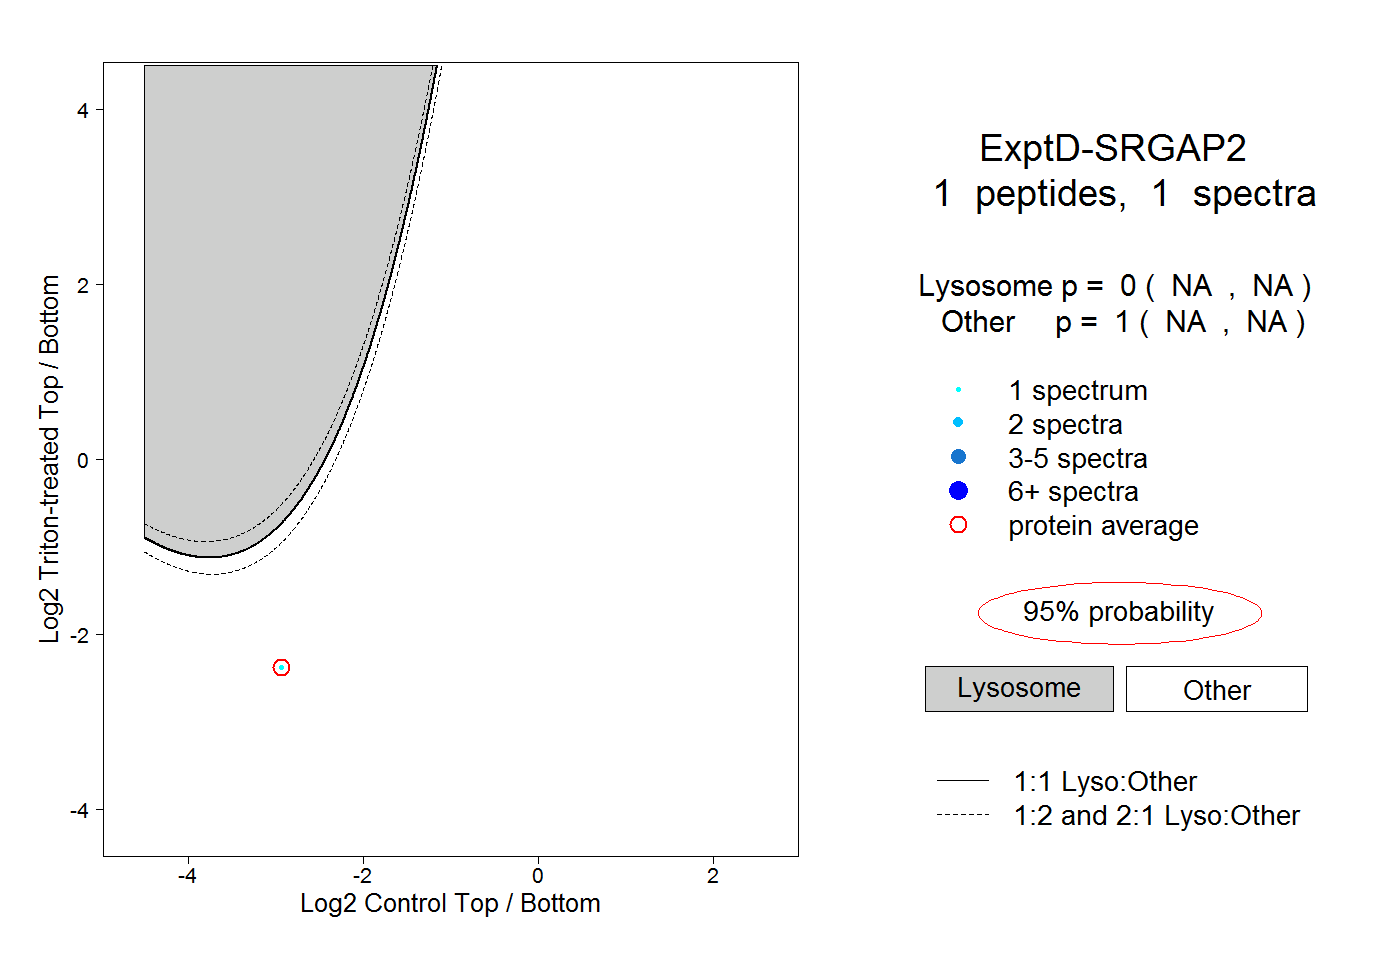 |
0.000 NA | NA |
1.000 NA | NA |