 9
9peptides
spectra
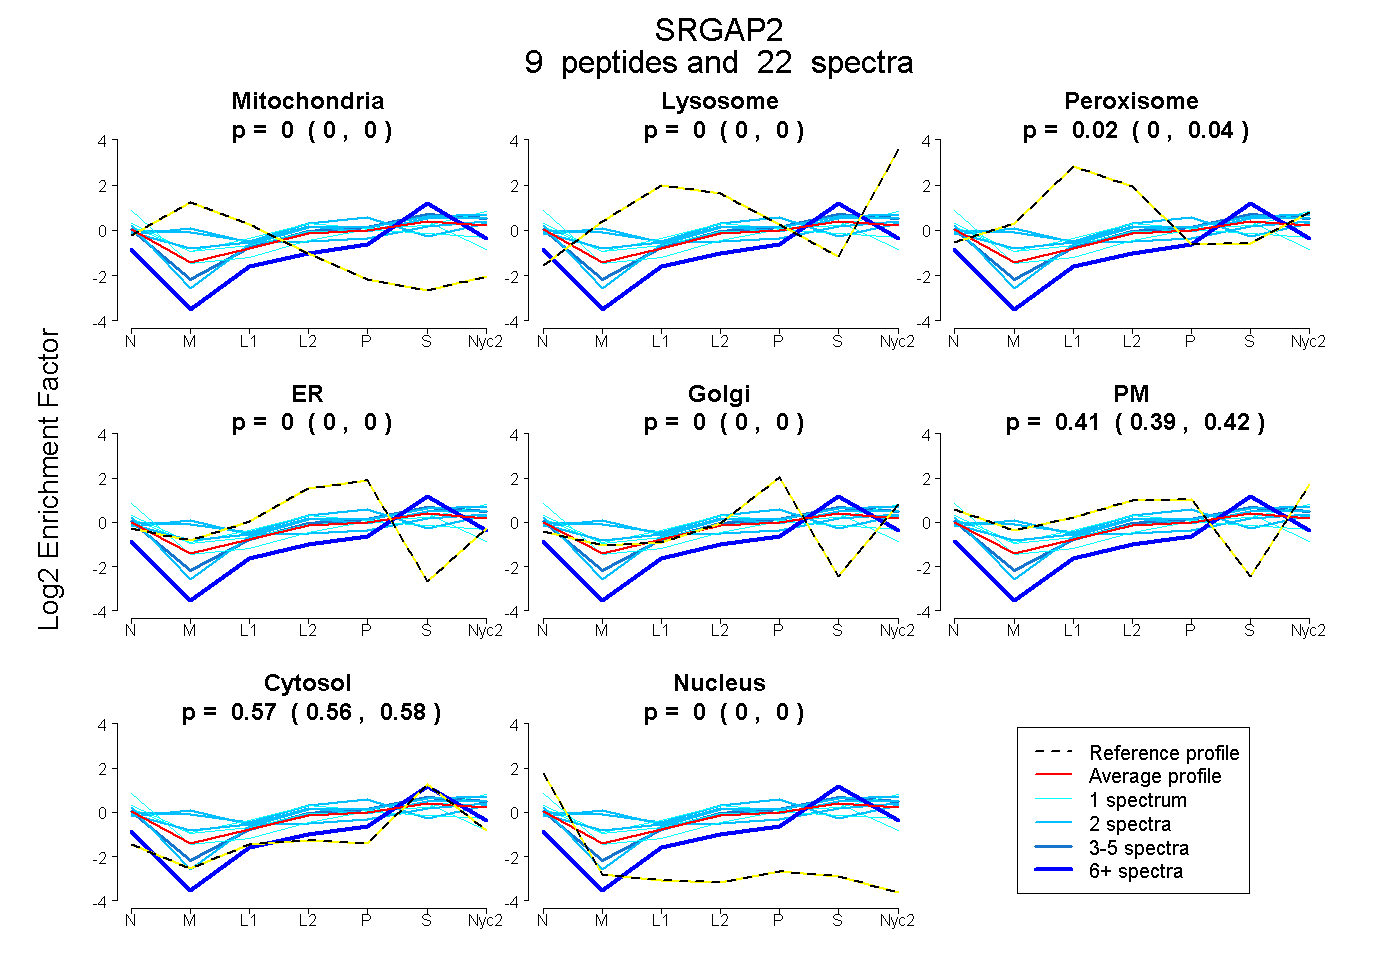
0.000 | 0.000
0.000 | 0.000
0.005 | 0.040
0.000 | 0.000
0.000 | 0.000
0.391 | 0.420
0.555 | 0.581
0.000 | 0.000
| Plot | Mito | Lyso | Perox | ER | Golgi | PM | Cytosol | Nucleus | |||||
| Expt A |
9 peptides |
22 spectra |
|
0.000 0.000 | 0.000 |
0.000 0.000 | 0.000 |
0.024 0.005 | 0.040 |
0.000 0.000 | 0.000 |
0.000 0.000 | 0.000 |
0.406 0.391 | 0.420 |
0.570 0.555 | 0.581 |
0.000 0.000 | 0.000 |
| 2 spectra, HDLLQK | 0.036 | 0.000 | 0.171 | 0.000 | 0.198 | 0.300 | 0.295 | 0.000 | ||
| 2 spectra, EVGQQLQDDLMK | 0.172 | 0.151 | 0.000 | 0.000 | 0.000 | 0.250 | 0.427 | 0.000 | ||
| 1 spectrum, TLGESQR | 0.000 | 0.000 | 0.000 | 0.000 | 0.000 | 0.439 | 0.427 | 0.134 | ||
| 2 spectra, SPDSTANVR | 0.000 | 0.000 | 0.000 | 0.000 | 0.000 | 0.417 | 0.583 | 0.000 | ||
| 2 spectra, TIIIQHENIFPNPR | 0.000 | 0.016 | 0.136 | 0.000 | 0.000 | 0.355 | 0.492 | 0.000 | ||
| 7 spectra, TSPAK | 0.000 | 0.000 | 0.000 | 0.000 | 0.088 | 0.000 | 0.912 | 0.000 | ||
| 4 spectra, ASDDWWEGR | 0.000 | 0.000 | 0.000 | 0.000 | 0.000 | 0.394 | 0.606 | 0.000 | ||
| 1 spectrum, DQNVLSPVNCWNLLLNQVK | 0.003 | 0.000 | 0.160 | 0.217 | 0.000 | 0.064 | 0.492 | 0.064 | ||
| 1 spectrum, NEYLLALEATNASVFK | 0.000 | 0.000 | 0.124 | 0.000 | 0.000 | 0.460 | 0.416 | 0.000 |
| Plot | Mito | Lyso or Perox | ER | Golgi | PM | Cytosol | Nucleus | ||||||
| Expt B |
2 peptides |
2 spectra |
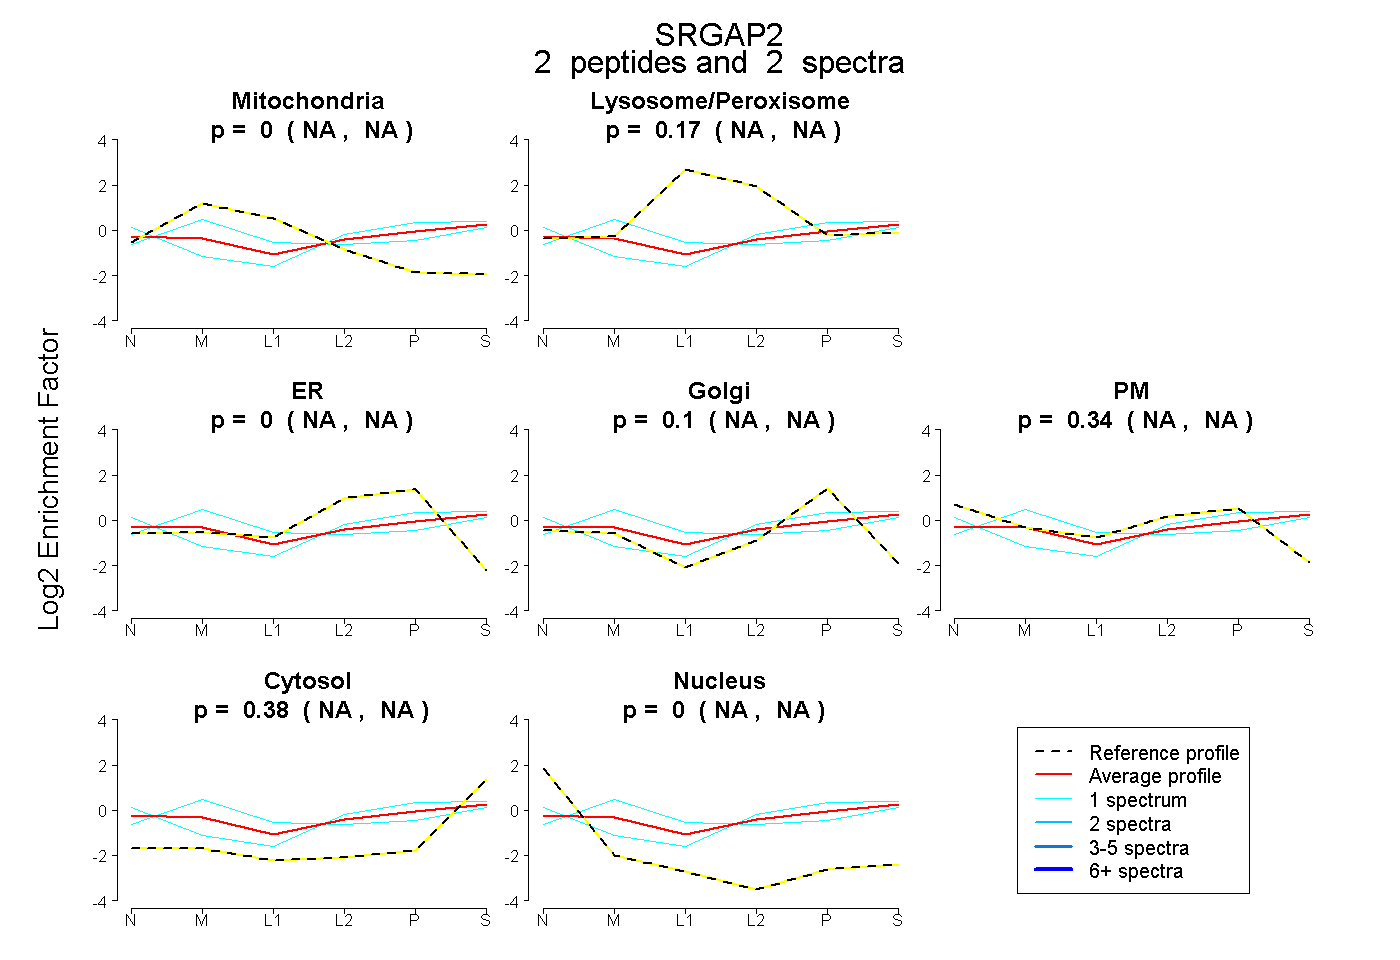 |
0.000 NA | NA |
0.172 NA | NA |
0.000 NA | NA |
0.104 NA | NA |
0.345 NA | NA |
0.380 NA | NA |
0.000 NA | NA |
|||
| Plot | Lyso | Other | |||||||||||
| Expt C |
7 peptides |
18 spectra |
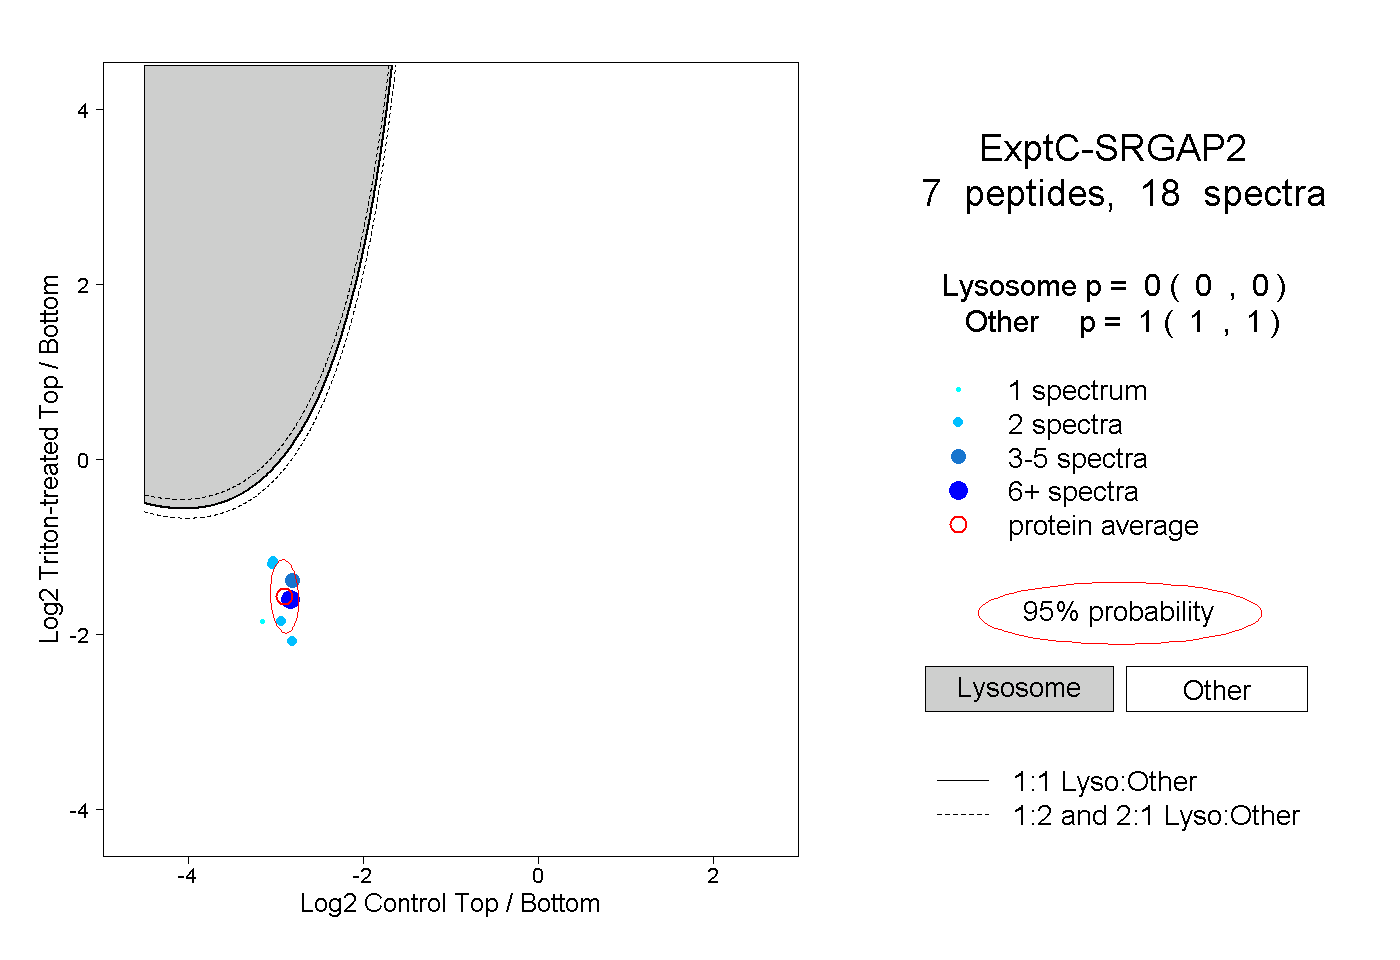 |
0.000 0.000 | 0.000 |
1.000 1.000 | 1.000 |
||||||||
| Plot | Lyso | Other | |||||||||||
| Expt D |
1 peptide |
1 spectrum |
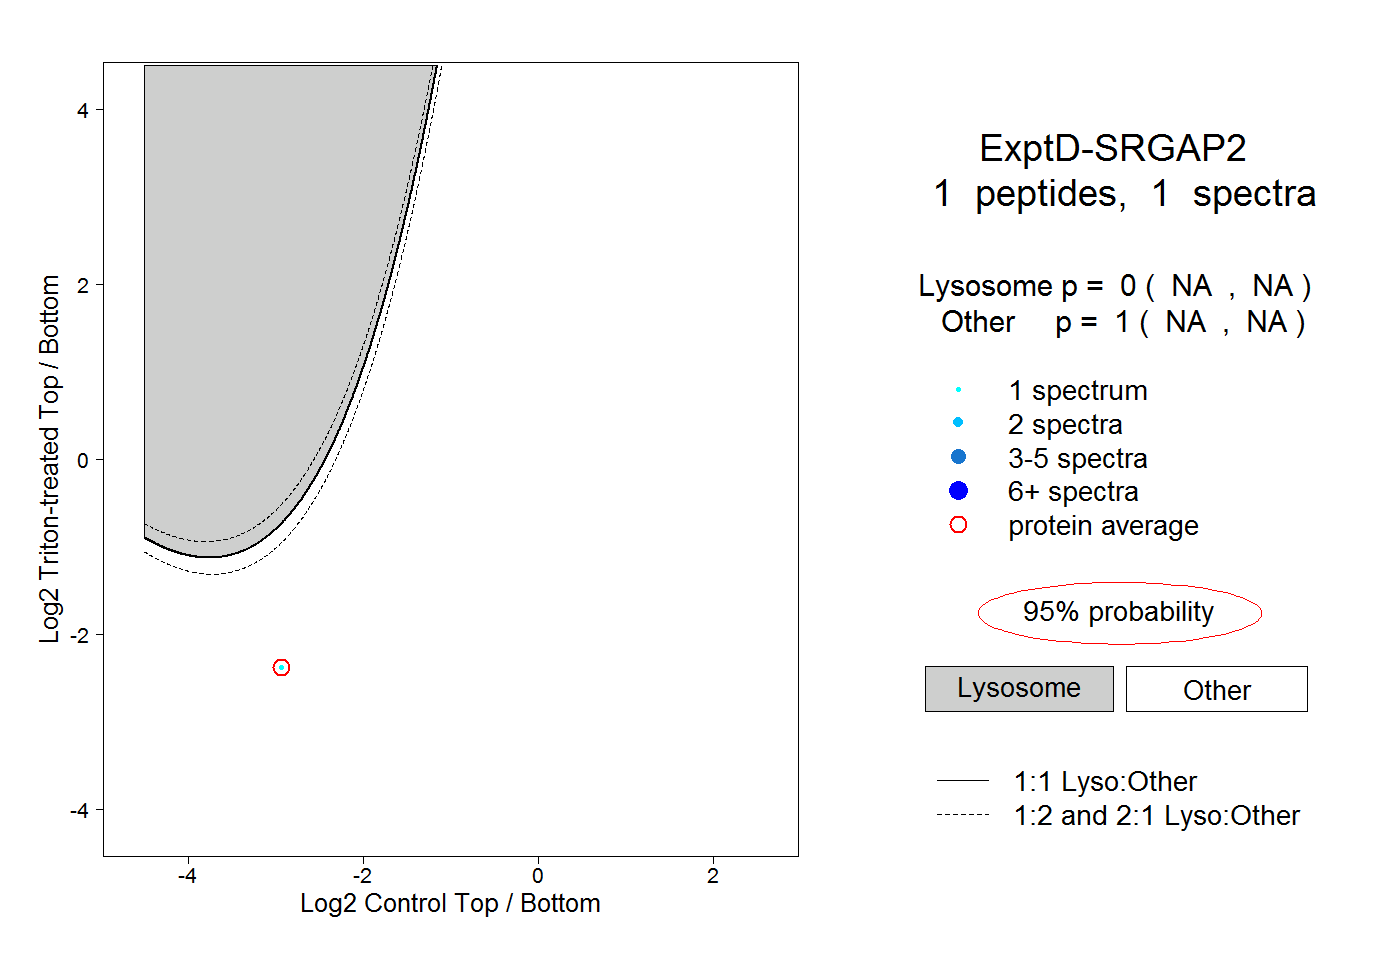 |
0.000 NA | NA |
1.000 NA | NA |