 28
28peptides
spectra
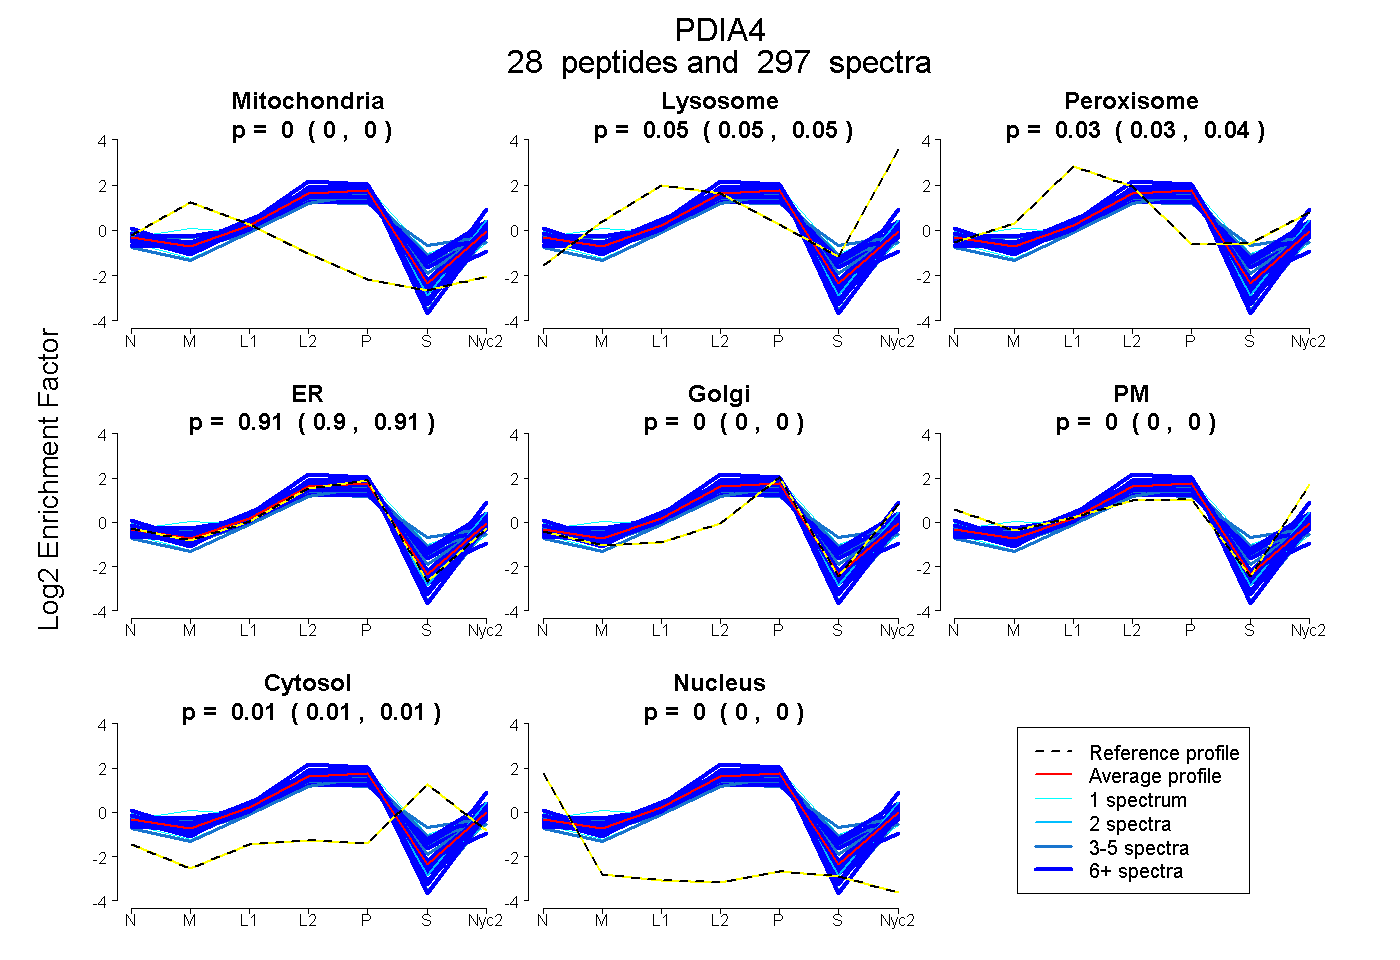
0.000 | 0.000
0.048 | 0.052
0.033 | 0.036
0.904 | 0.909
0.000 | 0.000
0.000 | 0.000
0.007 | 0.010
0.000 | 0.000
29peptides
spectra
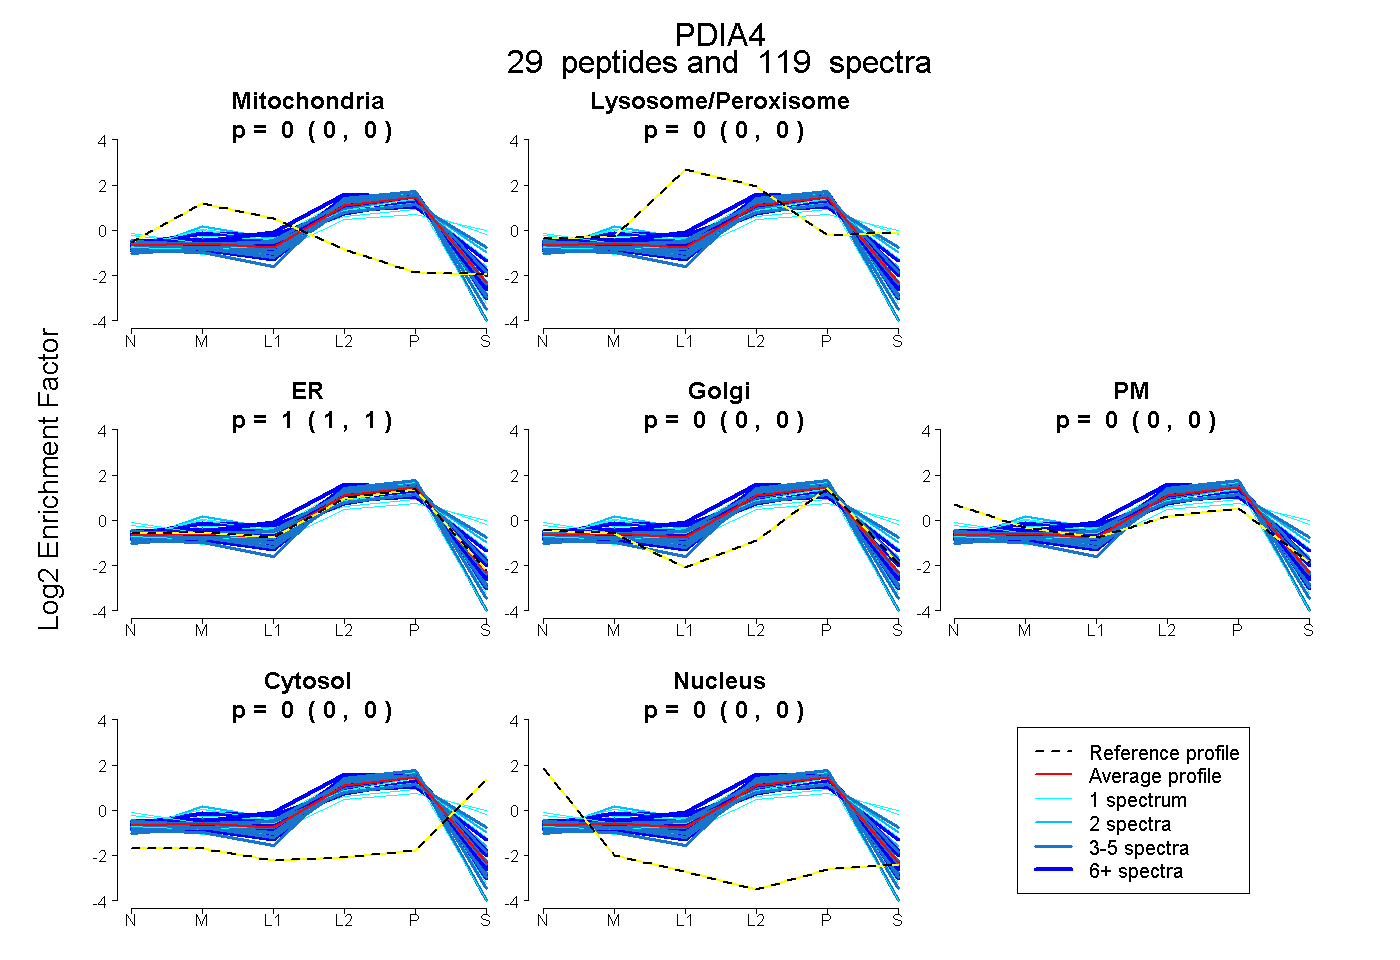
0.000 | 0.000
0.000 | 0.000
1.000 | 1.000
0.000 | 0.000
0.000 | 0.000
0.000 | 0.000
0.000 | 0.000
31peptides
spectra
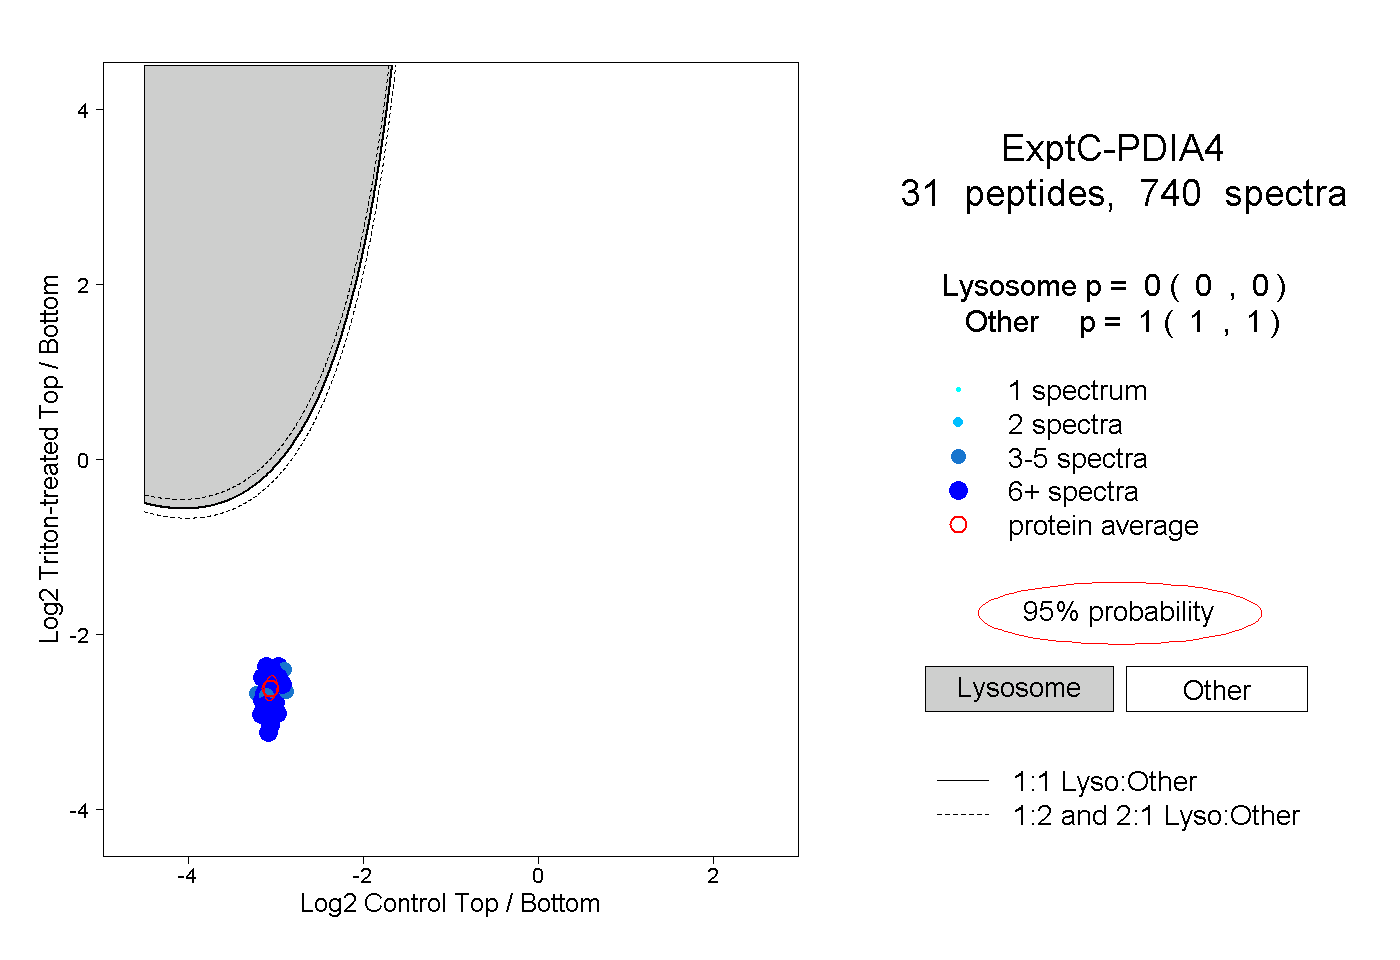
0.000 | 0.000
1.000 | 1.000
27peptides
spectra
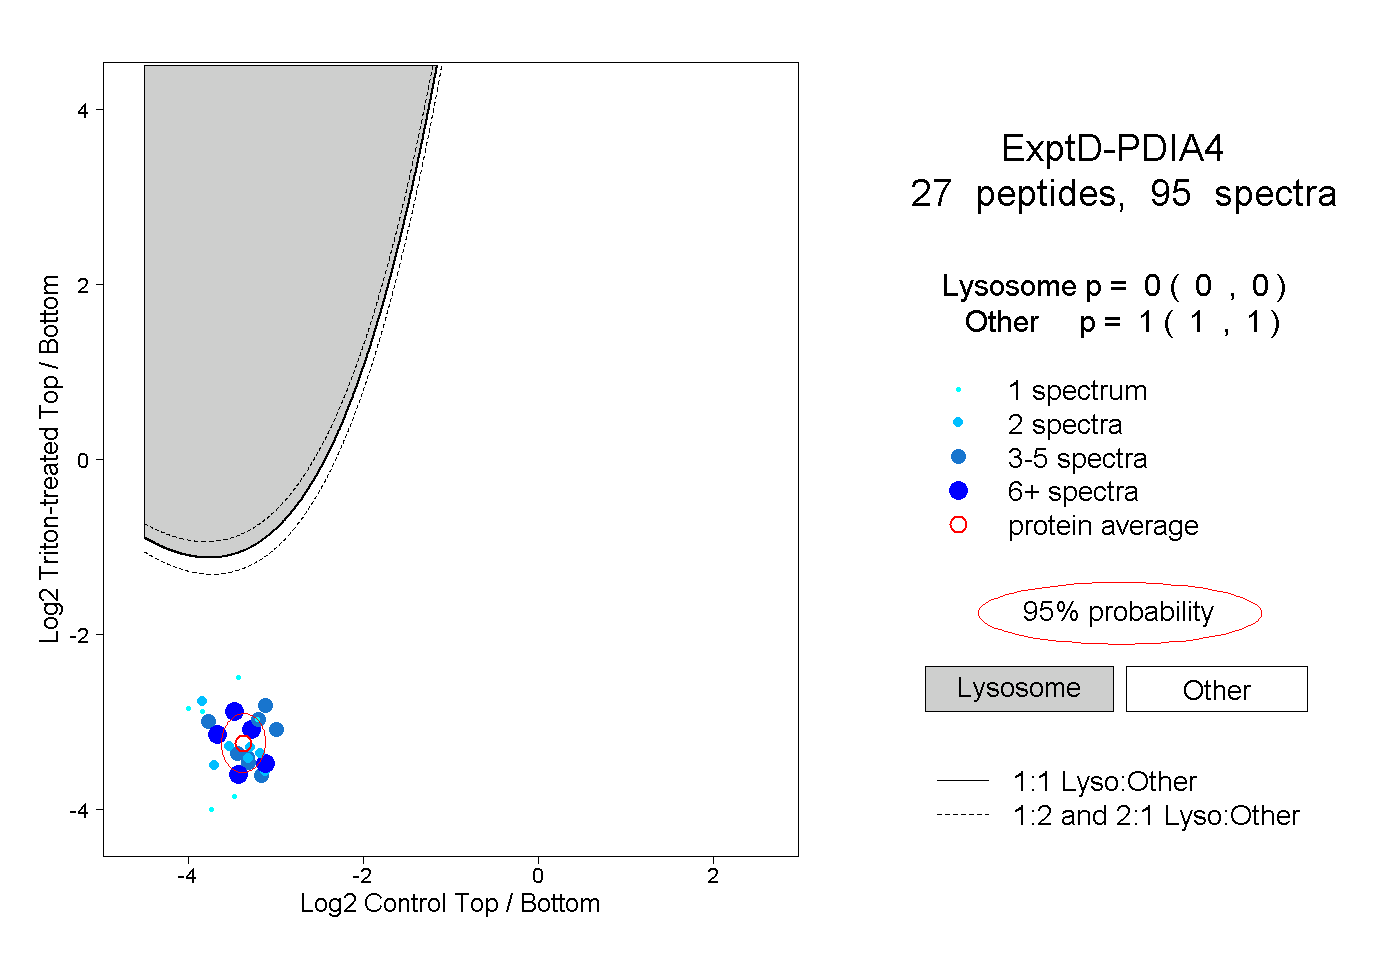
0.000 | 0.000
1.000 | 1.000