 14
14peptides
spectra

0.000 | 0.000
0.007 | 0.029
0.009 | 0.039
0.012 | 0.056
0.000 | 0.038
0.000 | 0.000
0.894 | 0.908
0.000 | 0.000
7peptides
spectra
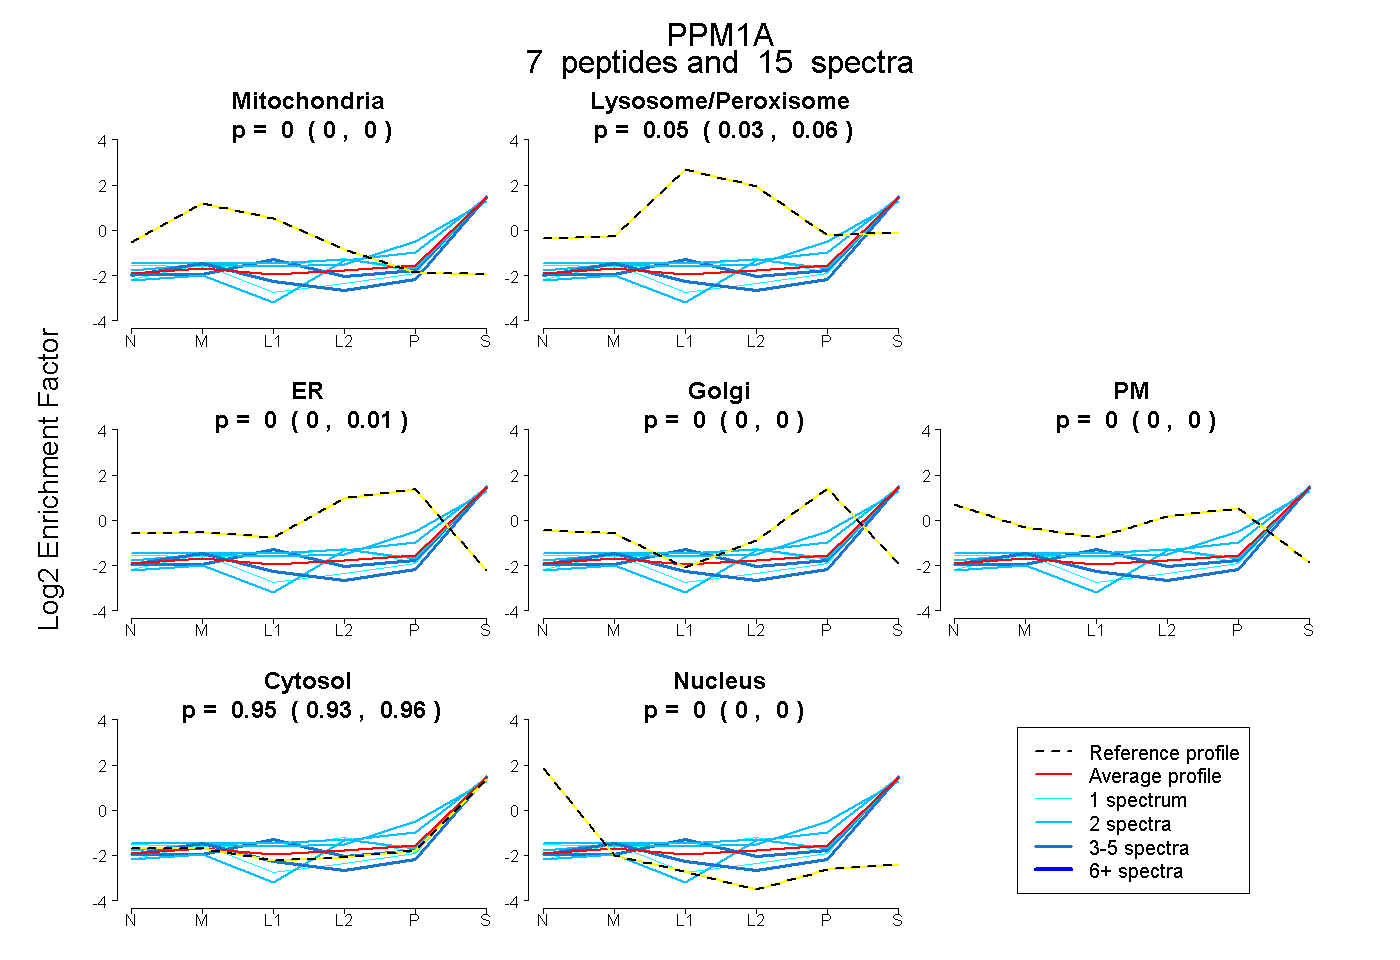
0.000 | 0.000
0.026 | 0.063
0.000 | 0.011
0.000 | 0.000
0.000 | 0.000
0.933 | 0.965
0.000 | 0.000
10peptides
spectra
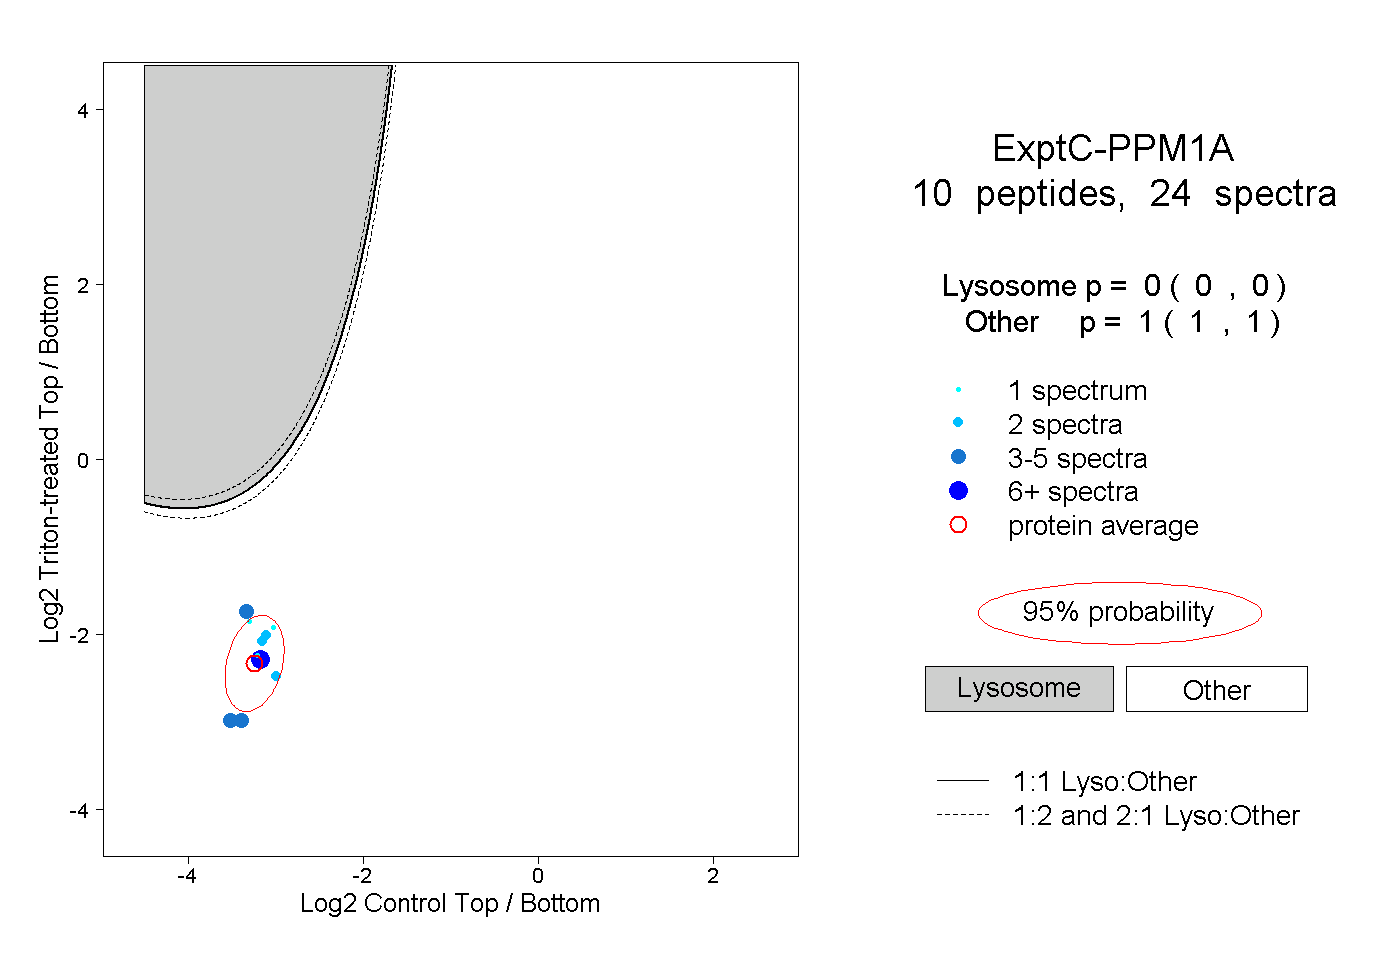
0.000 | 0.000
1.000 | 1.000
2peptides
spectra
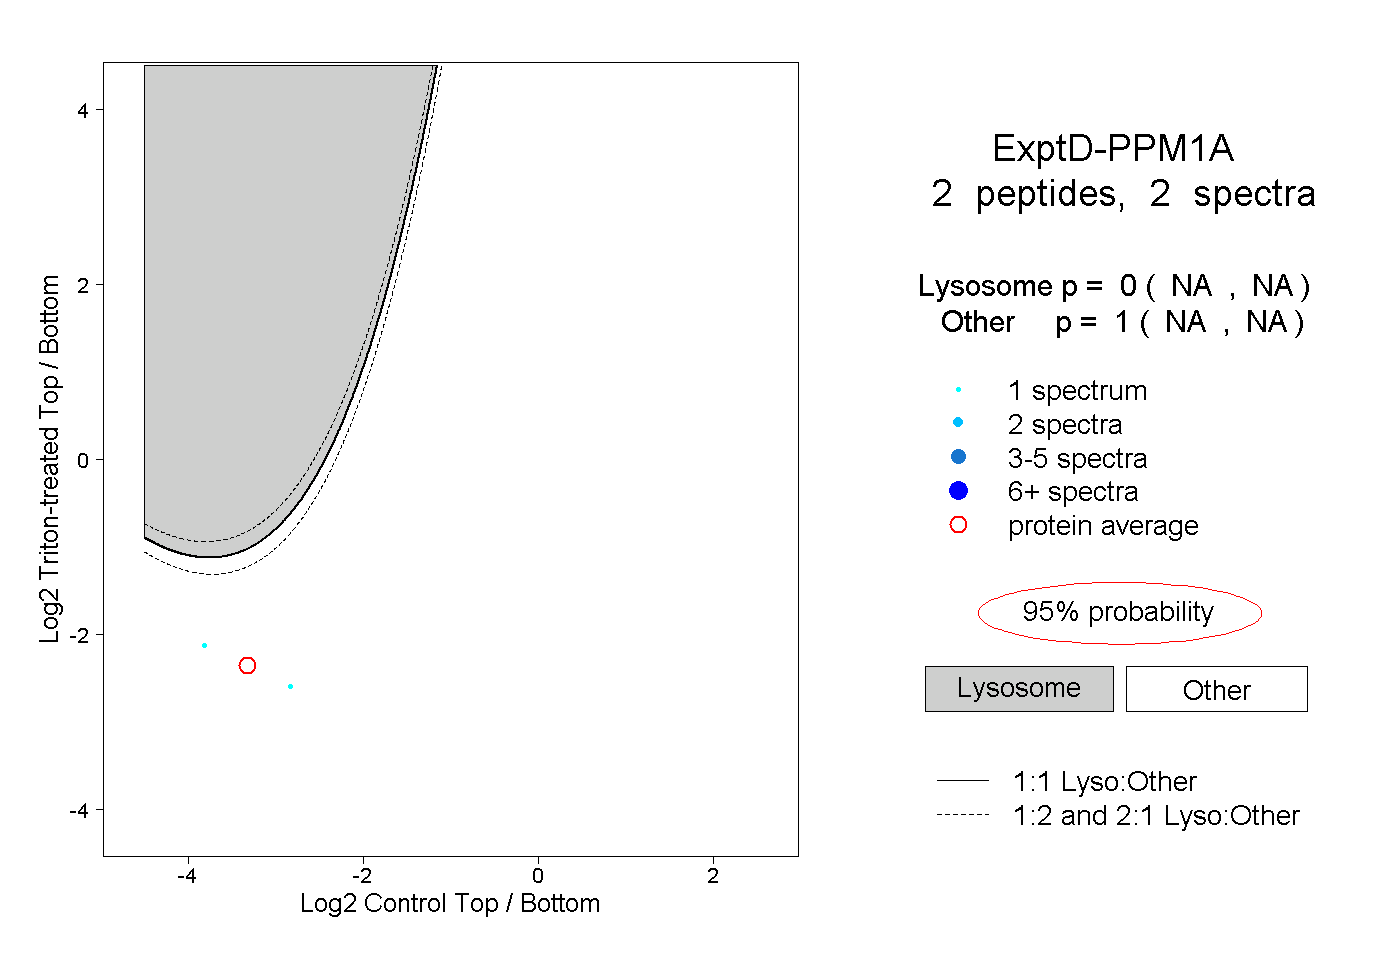
NA | NA
NA | NA