 14
14peptides
spectra

0.000 | 0.000
0.007 | 0.029
0.009 | 0.039
0.012 | 0.056
0.000 | 0.038
0.000 | 0.000
0.894 | 0.908
0.000 | 0.000
| Plot | Mito | Lyso | Perox | ER | Golgi | PM | Cytosol | Nucleus | |||||
| Expt A |
14 peptides |
61 spectra |
|
0.000 0.000 | 0.000 |
0.021 0.007 | 0.029 |
0.022 0.009 | 0.039 |
0.042 0.012 | 0.056 |
0.012 0.000 | 0.038 |
0.000 0.000 | 0.000 |
0.902 0.894 | 0.908 |
0.000 0.000 | 0.000 |
| 1 spectrum, GSAGAPSVENVK | 0.000 | 0.000 | 0.000 | 0.000 | 0.000 | 0.000 | 0.909 | 0.091 | ||
| 2 spectra, DNMSVILICFPNAPK | 0.040 | 0.000 | 0.000 | 0.069 | 0.000 | 0.000 | 0.890 | 0.001 | ||
| 11 spectra, LEVTDDLEK | 0.000 | 0.000 | 0.000 | 0.000 | 0.032 | 0.000 | 0.960 | 0.008 | ||
| 11 spectra, IQNAGGSVMIQR | 0.000 | 0.000 | 0.088 | 0.028 | 0.048 | 0.000 | 0.836 | 0.000 | ||
| 4 spectra, VNGSLAVSR | 0.000 | 0.106 | 0.012 | 0.000 | 0.000 | 0.039 | 0.843 | 0.000 | ||
| 7 spectra, YGLSSMQGWR | 0.000 | 0.006 | 0.000 | 0.000 | 0.000 | 0.000 | 0.994 | 0.000 | ||
| 5 spectra, TGFLEIDEHMR | 0.000 | 0.139 | 0.080 | 0.000 | 0.045 | 0.000 | 0.736 | 0.000 | ||
| 1 spectrum, VHFFTQDHKPSNPLEK | 0.000 | 0.020 | 0.000 | 0.000 | 0.004 | 0.177 | 0.799 | 0.000 | ||
| 7 spectra, ALGDFDYK | 0.000 | 0.000 | 0.000 | 0.000 | 0.000 | 0.000 | 1.000 | 0.000 | ||
| 1 spectrum, YCCEHLLDHITNNQDFK | 0.000 | 0.000 | 0.000 | 0.035 | 0.000 | 0.000 | 0.919 | 0.046 | ||
| 2 spectra, HNAQGQGNGLR | 0.000 | 0.109 | 0.000 | 0.000 | 0.000 | 0.076 | 0.815 | 0.000 | ||
| 5 spectra, QGEGVPDLVHVMR | 0.000 | 0.000 | 0.095 | 0.131 | 0.000 | 0.000 | 0.775 | 0.000 | ||
| 2 spectra, NVIEAVYNR | 0.060 | 0.000 | 0.000 | 0.046 | 0.010 | 0.000 | 0.885 | 0.000 | ||
| 2 spectra, VSAEAVK | 0.000 | 0.000 | 0.000 | 0.235 | 0.000 | 0.000 | 0.765 | 0.000 |
| Plot | Mito | Lyso or Perox | ER | Golgi | PM | Cytosol | Nucleus | ||||||
| Expt B |
7 peptides |
15 spectra |
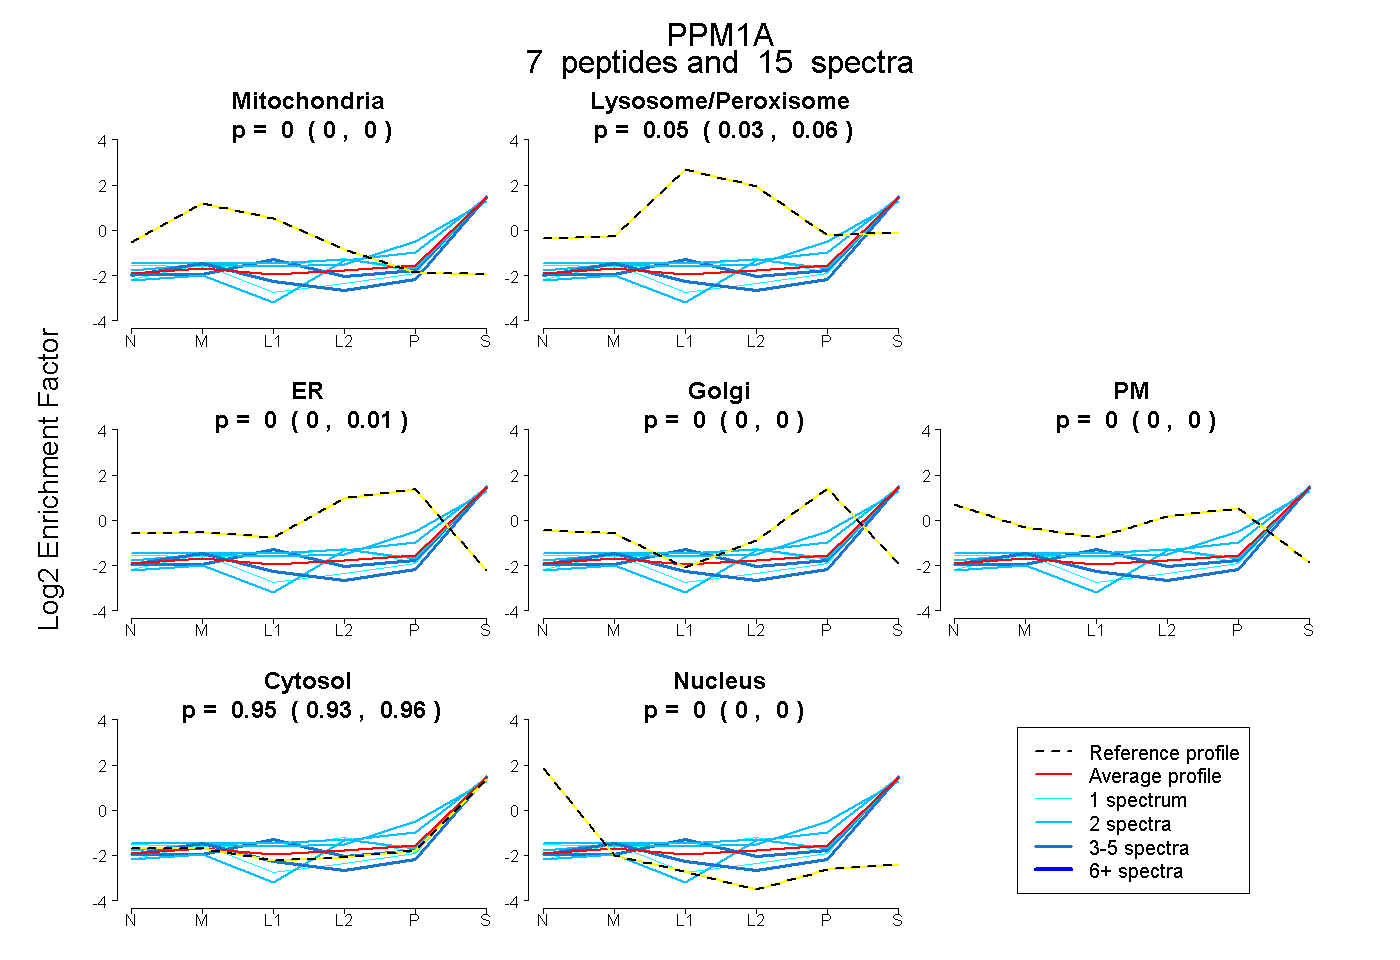 |
0.000 0.000 | 0.000 |
0.049 0.026 | 0.063 |
0.000 0.000 | 0.011 |
0.000 0.000 | 0.000 |
0.000 0.000 | 0.000 |
0.951 0.933 | 0.965 |
0.000 0.000 | 0.000 |
|||
| Plot | Lyso | Other | |||||||||||
| Expt C |
10 peptides |
24 spectra |
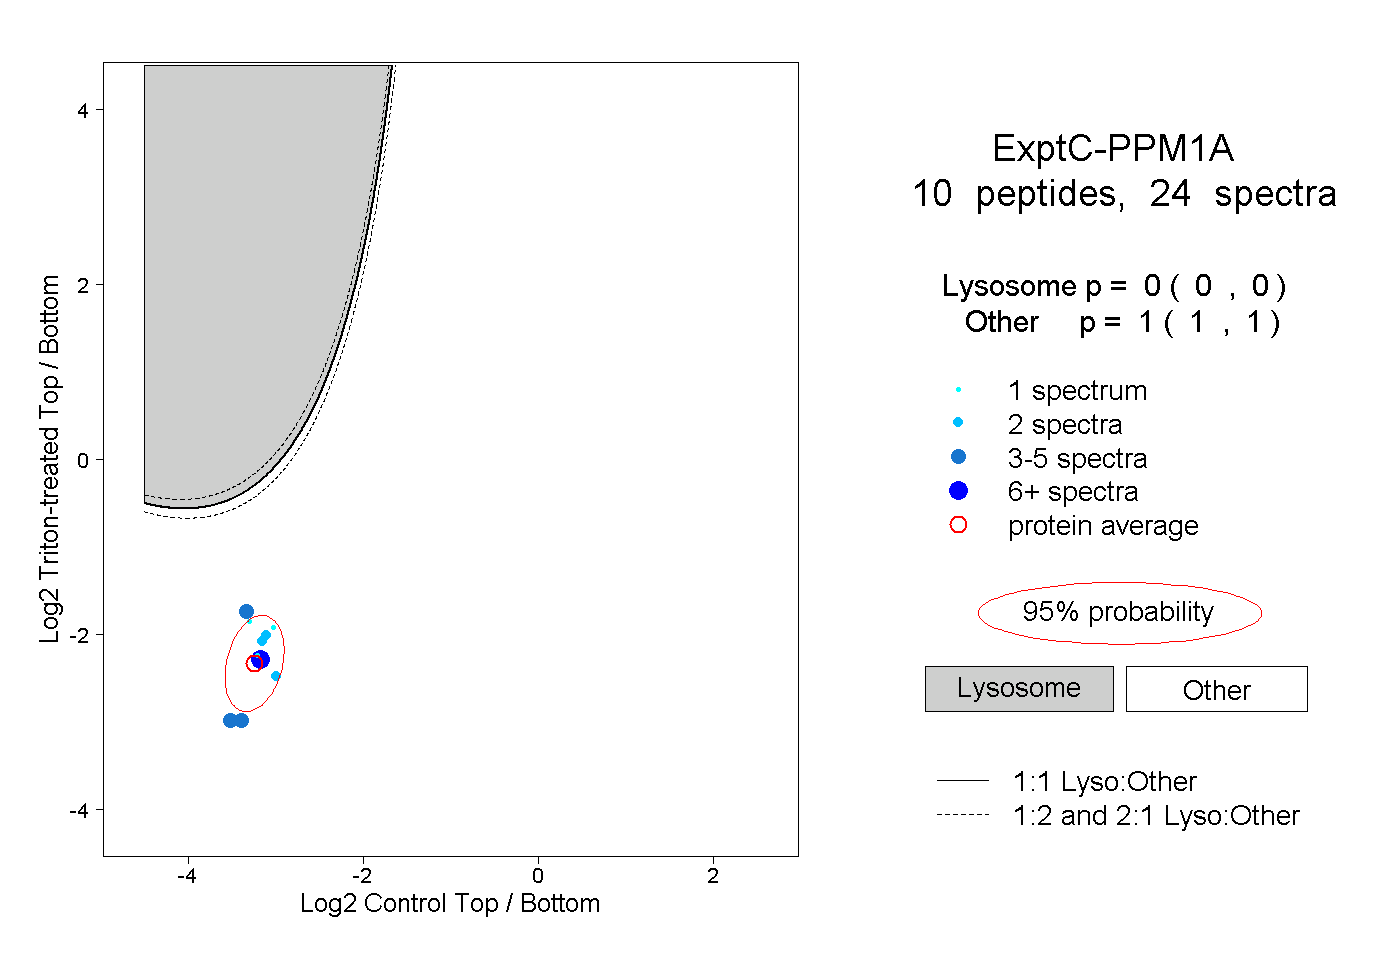 |
0.000 0.000 | 0.000 |
1.000 1.000 | 1.000 |
||||||||
| Plot | Lyso | Other | |||||||||||
| Expt D |
2 peptides |
2 spectra |
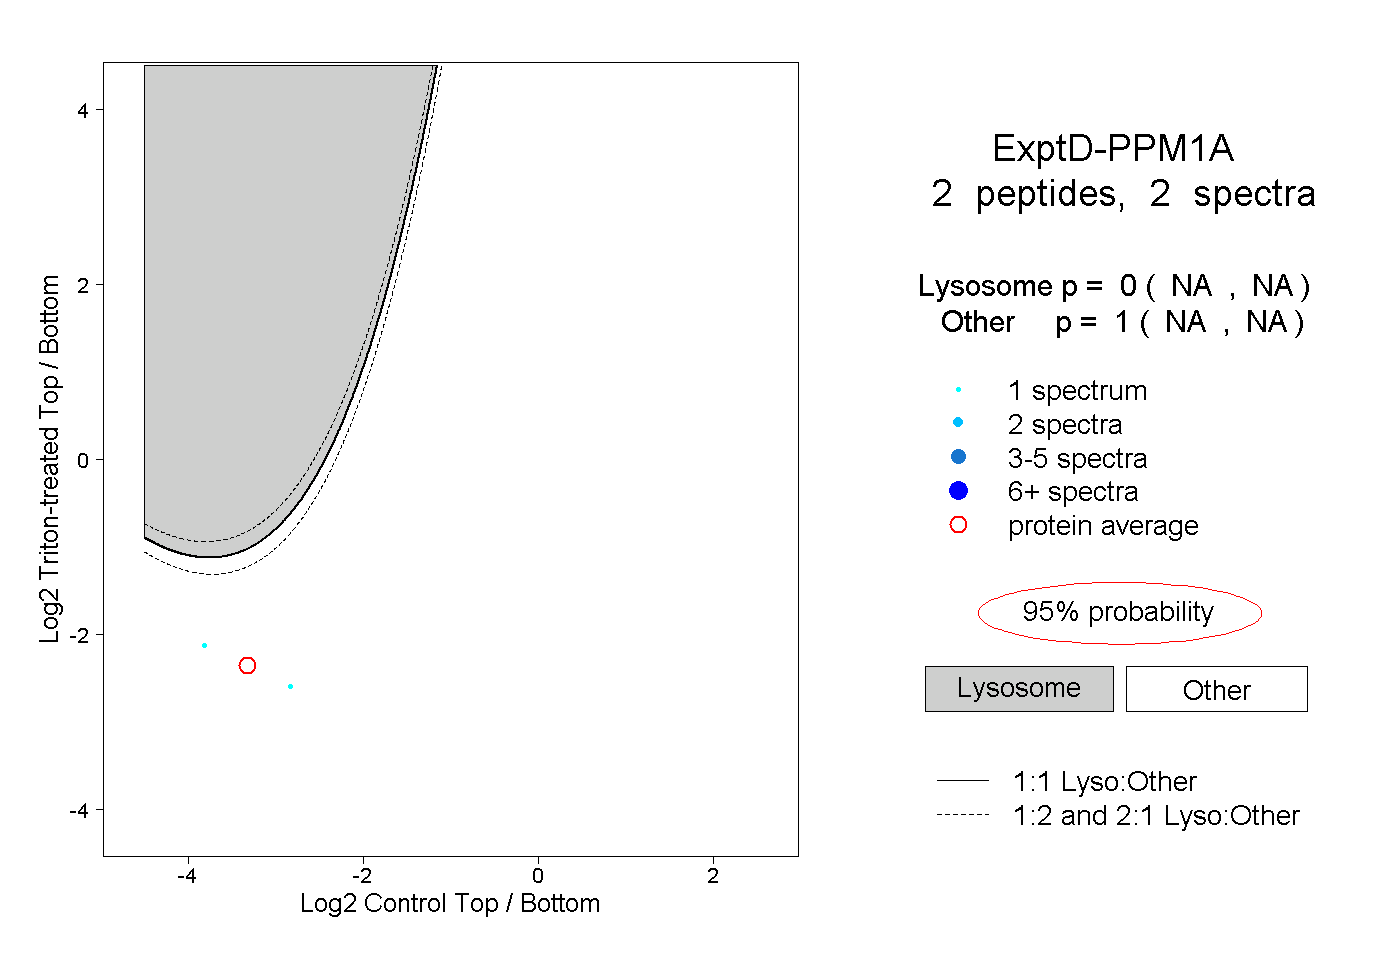 |
0.000 NA | NA |
1.000 NA | NA |