 10
10peptides
spectra
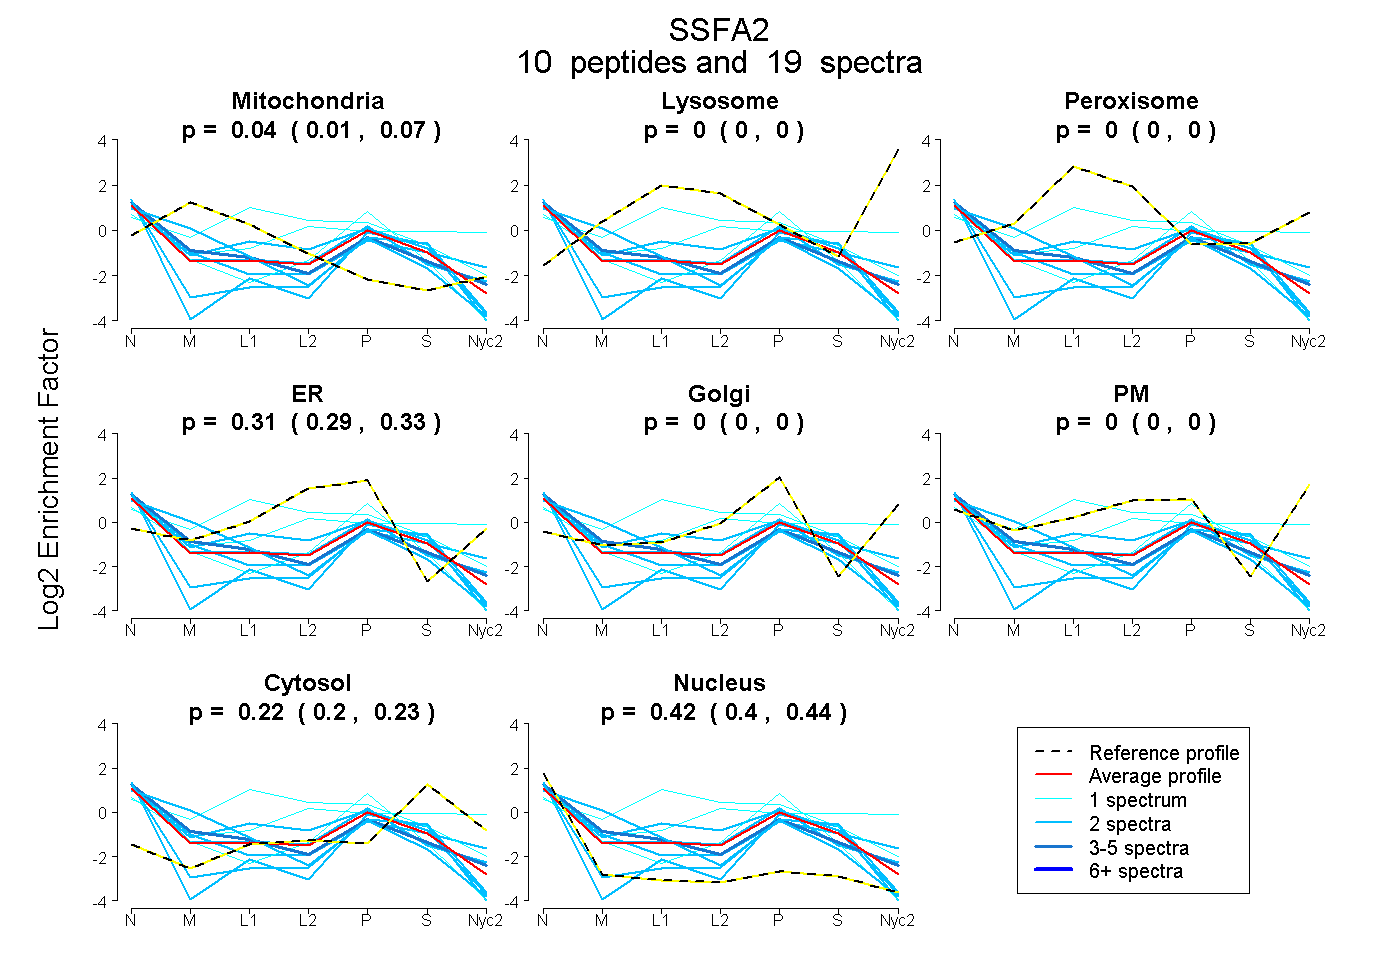
0.012 | 0.075
0.000 | 0.000
0.000 | 0.000
0.294 | 0.332
0.000 | 0.000
0.000 | 0.000
0.199 | 0.231
0.399 | 0.443
3peptides
spectra
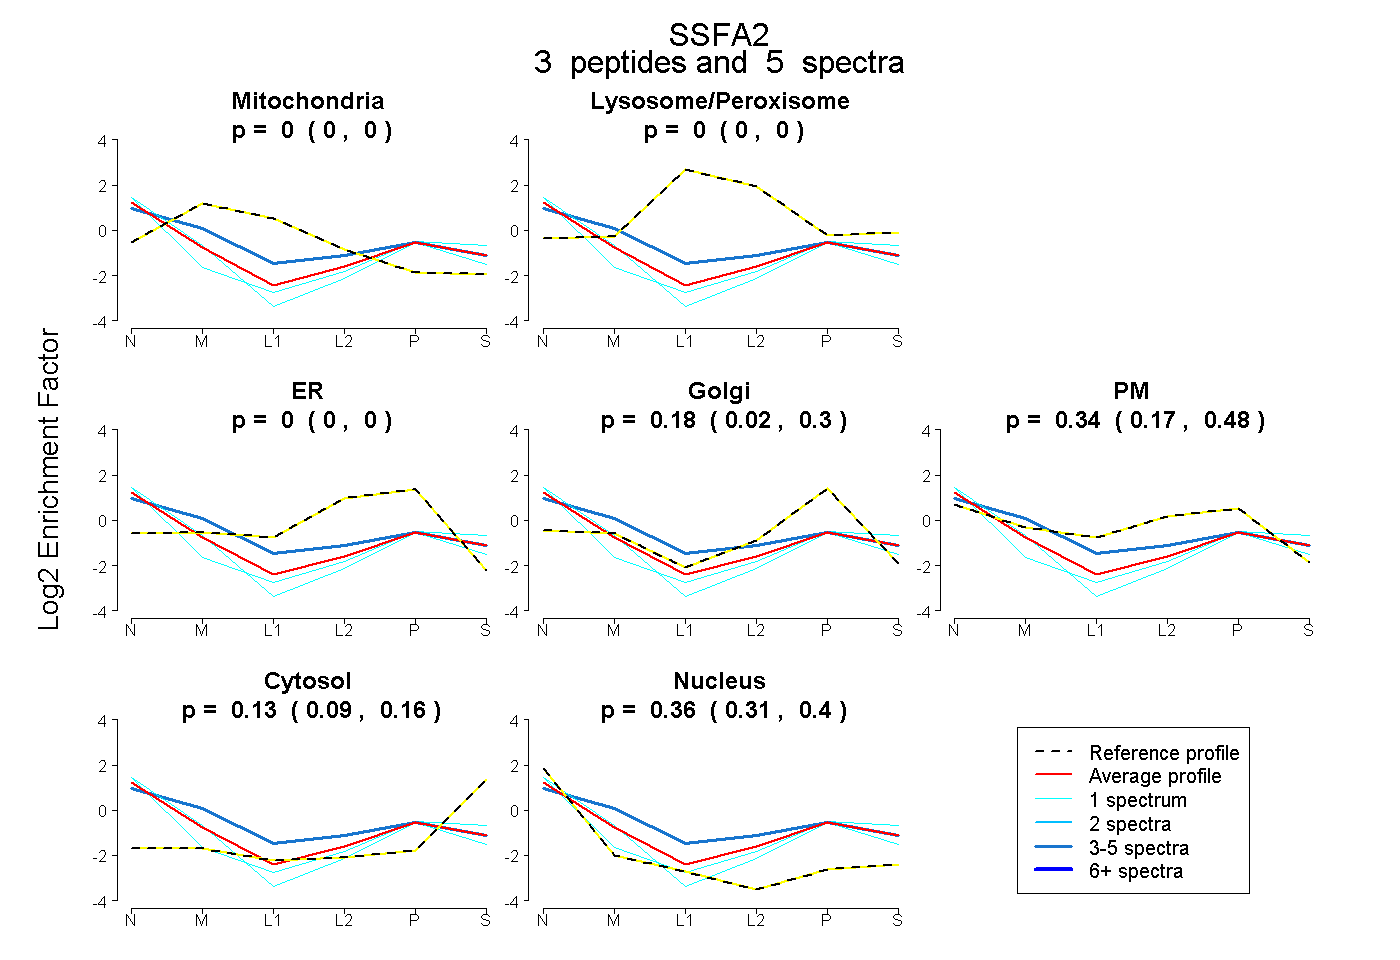
0.000 | 0.000
0.000 | 0.000
0.000 | 0.000
0.023 | 0.296
0.169 | 0.481
0.086 | 0.158
0.311 | 0.401
1peptide
spectrum
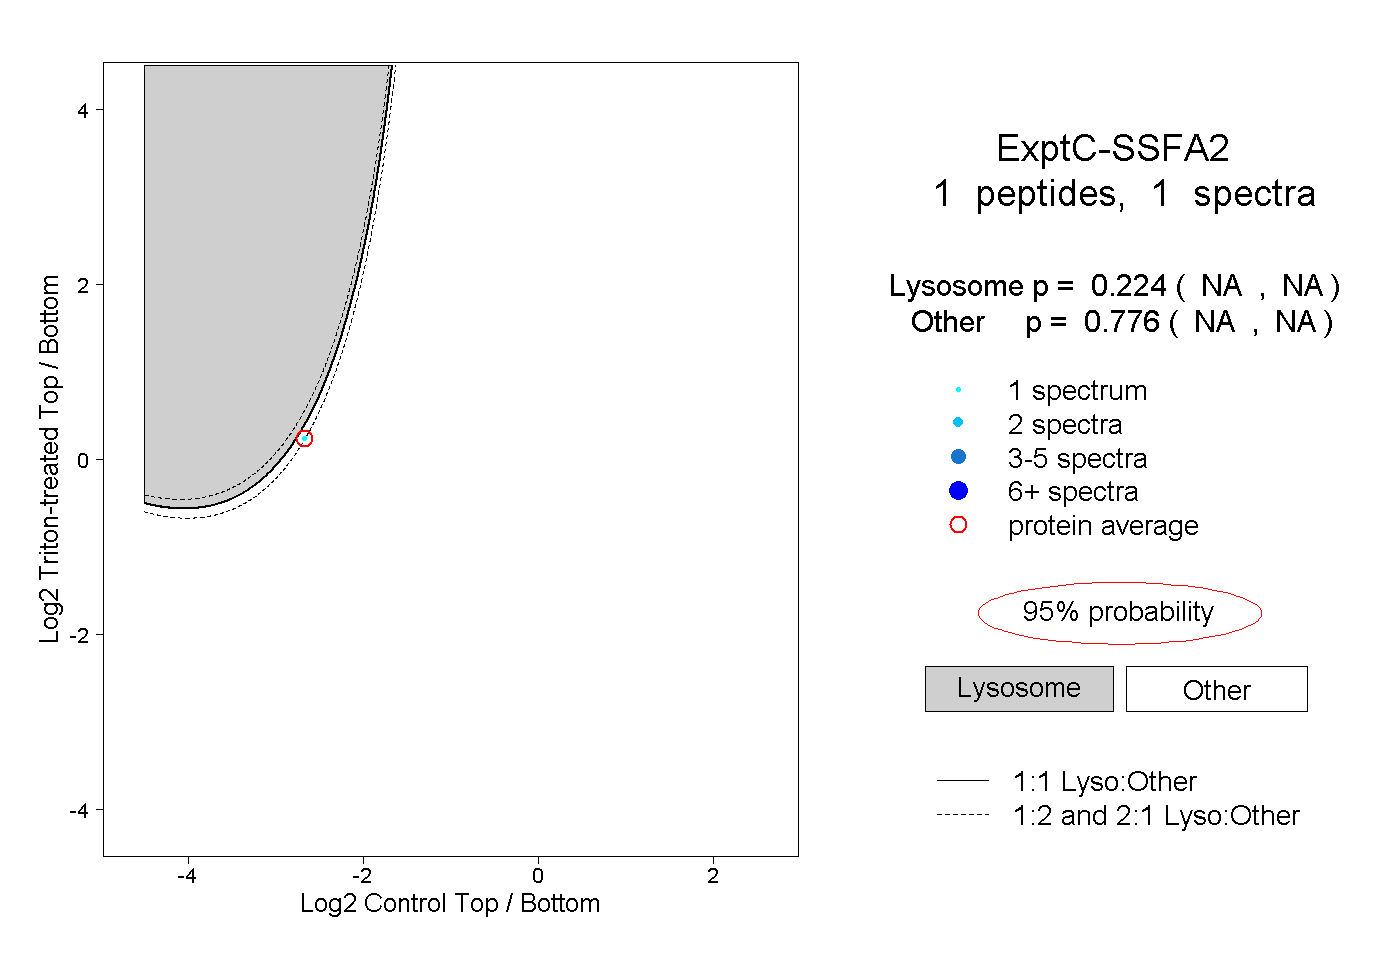
NA | NA
NA | NA