SSFA2
[ENSRNOP00000008046]
Main page
| | | Plot |
Mito |
Lyso |
|
Perox |
ER |
Golgi |
PM |
Cytosol |
Nucleus |
|
| Expt A |
 10
10
peptides |
19
spectra |
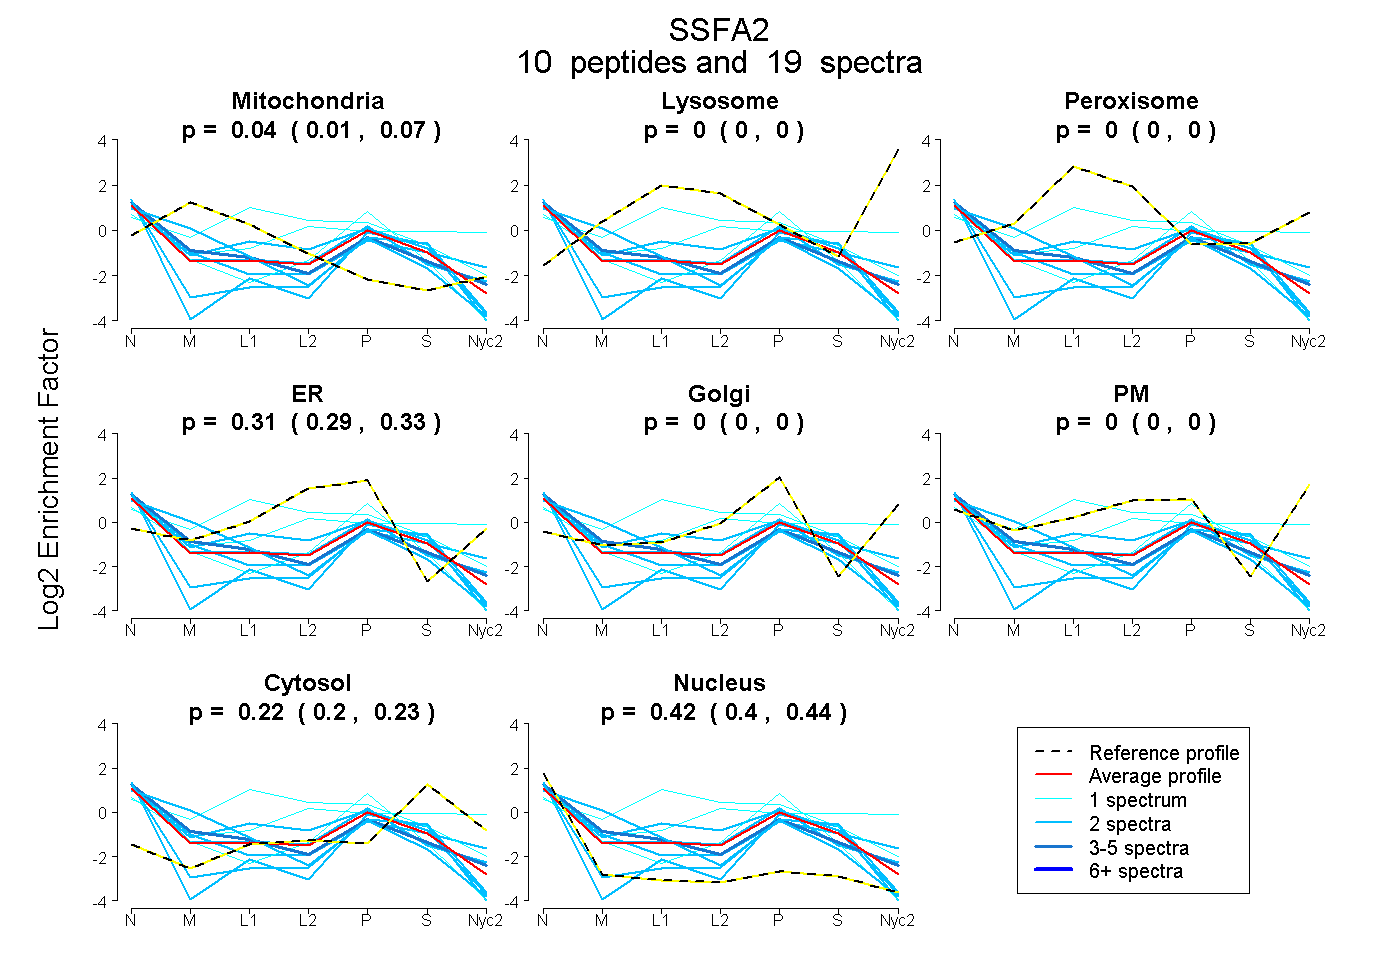 |
0.045
0.012 | 0.075 |
0.000
0.000 | 0.000 |
|
0.000
0.000 | 0.000 |
0.315
0.294 | 0.332 |
0.000
0.000 | 0.000 |
0.000
0.000 | 0.000 |
0.217
0.199 | 0.231 |
0.423
0.399 | 0.443 |
|
| | | Plot |
Mito |
|
Lyso or Perox |
|
ER |
Golgi |
PM |
Cytosol |
Nucleus |
|
| Expt B |
3
peptides |
5
spectra |
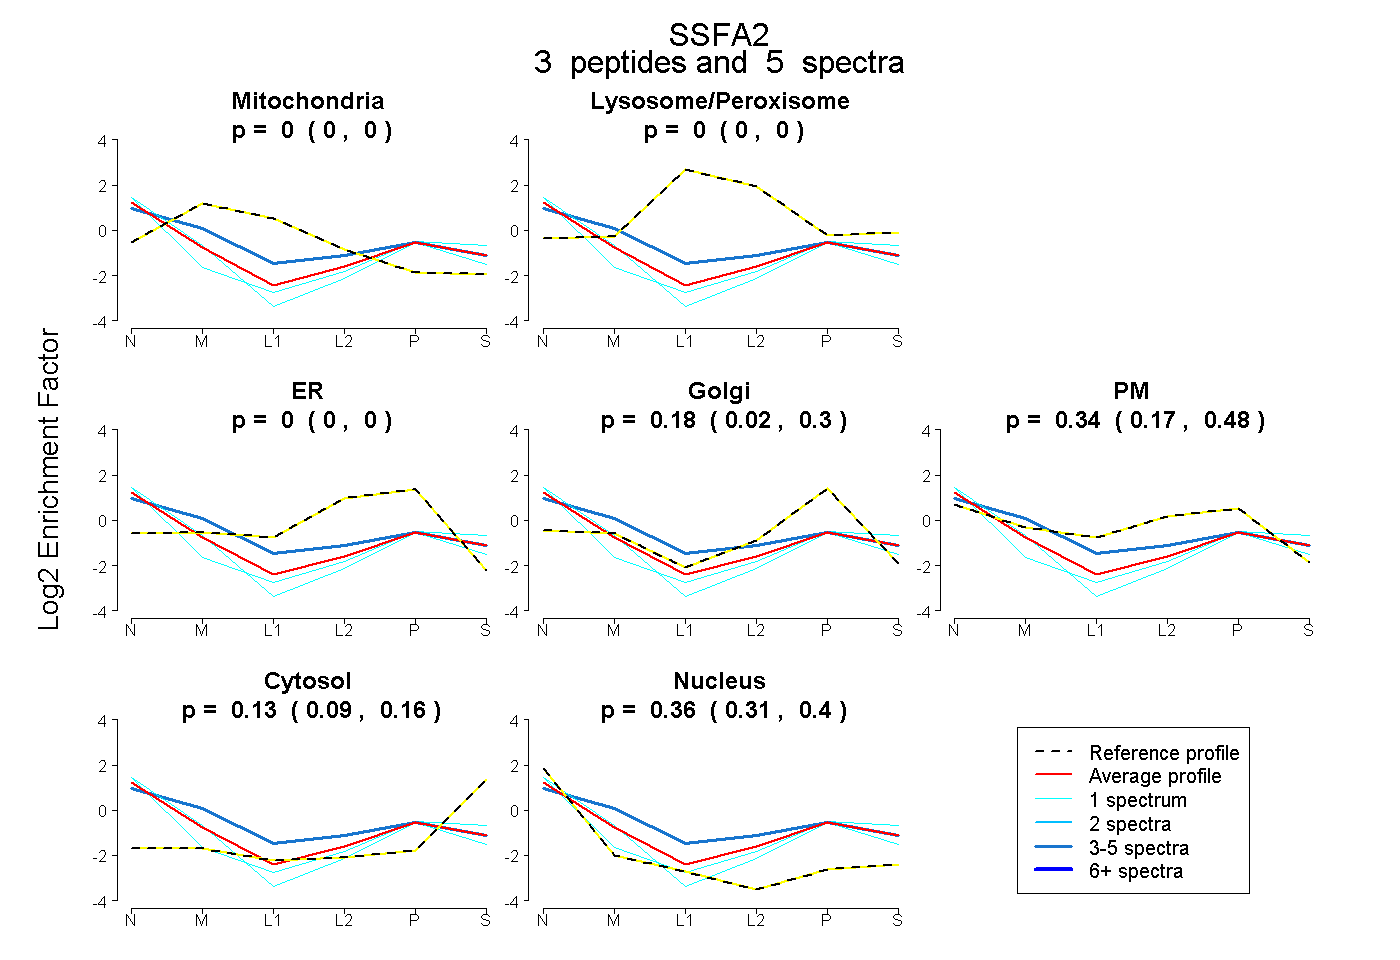 |
0.000
0.000 | 0.000 |
|
0.000
0.000 | 0.000 |
|
0.000
0.000 | 0.000 |
0.176
0.023 | 0.296 |
0.337
0.169 | 0.481 |
0.126
0.086 | 0.158 |
0.361
0.311 | 0.401 |
|
| 3 spectra, VLHDIR |
0.114 |
|
0.000 |
|
0.000 |
0.000 |
0.565 |
0.125 |
0.196 |
|
| 1 spectrum, ASVALTPTAPSR |
0.000 |
|
0.000 |
|
0.000 |
0.220 |
0.173 |
0.186 |
0.420 |
|
| 1 spectrum, VVSSVNVR |
0.000 |
|
0.000 |
|
0.000 |
0.473 |
0.000 |
0.003 |
0.524 |
|
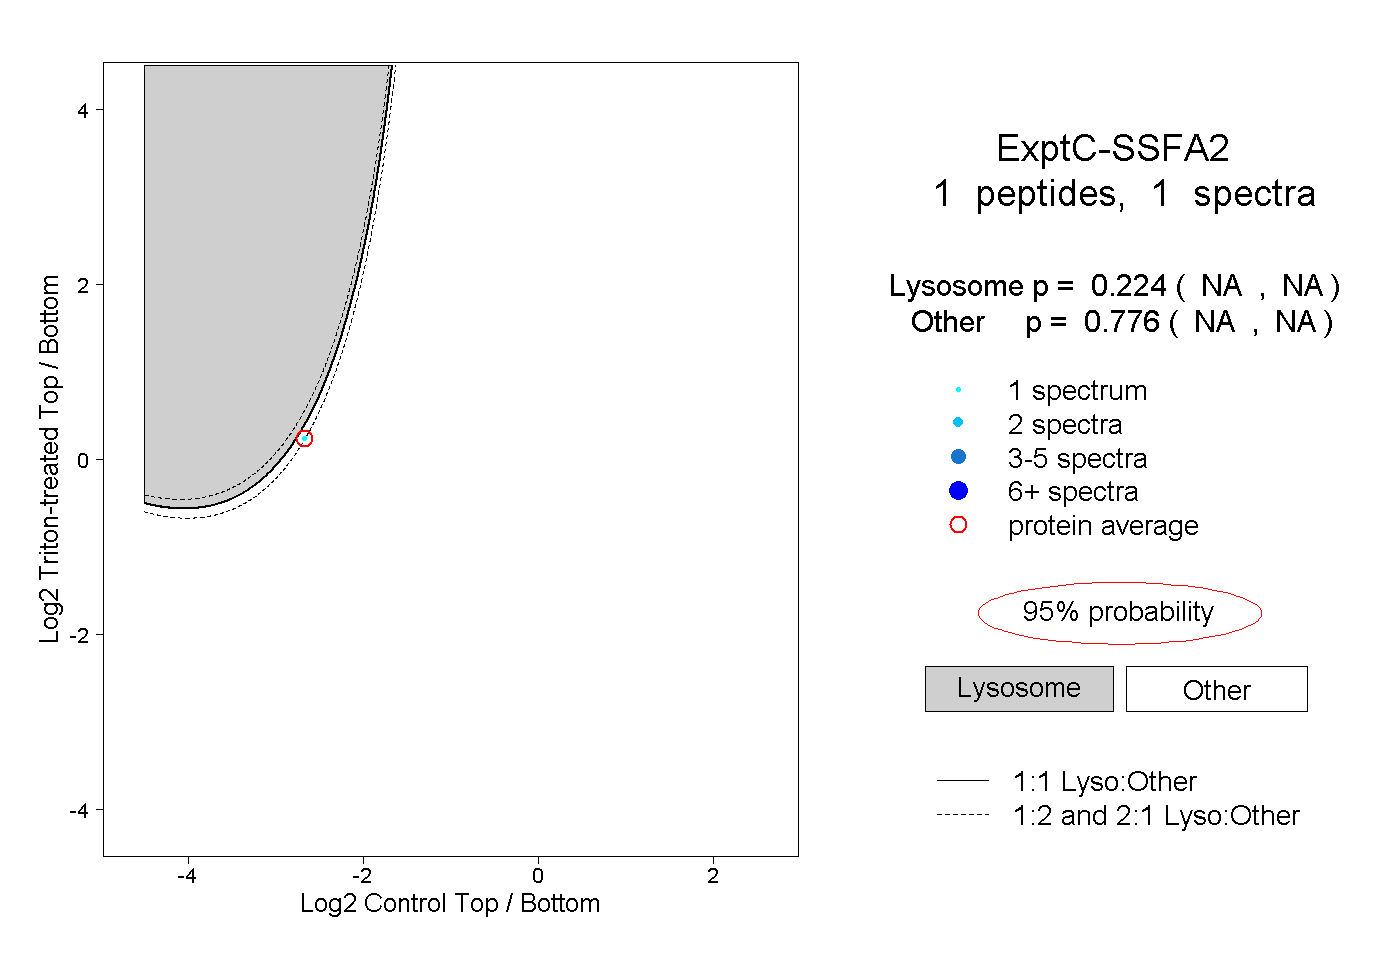
| | | Plot |
|
Lyso |
|
|
|
|
|
|
|
Other |
| Expt C |
1
peptide |
1
spectrum |
 |
|
0.224
NA | NA |
|
|
|
|
|
|
|
0.776
NA | NA |