 10
10peptides
spectra
0.012 | 0.075
0.000 | 0.000
0.000 | 0.000
0.294 | 0.332
0.000 | 0.000
0.000 | 0.000
0.199 | 0.231
0.399 | 0.443
| Plot | Mito | Lyso | Perox | ER | Golgi | PM | Cytosol | Nucleus | |||||
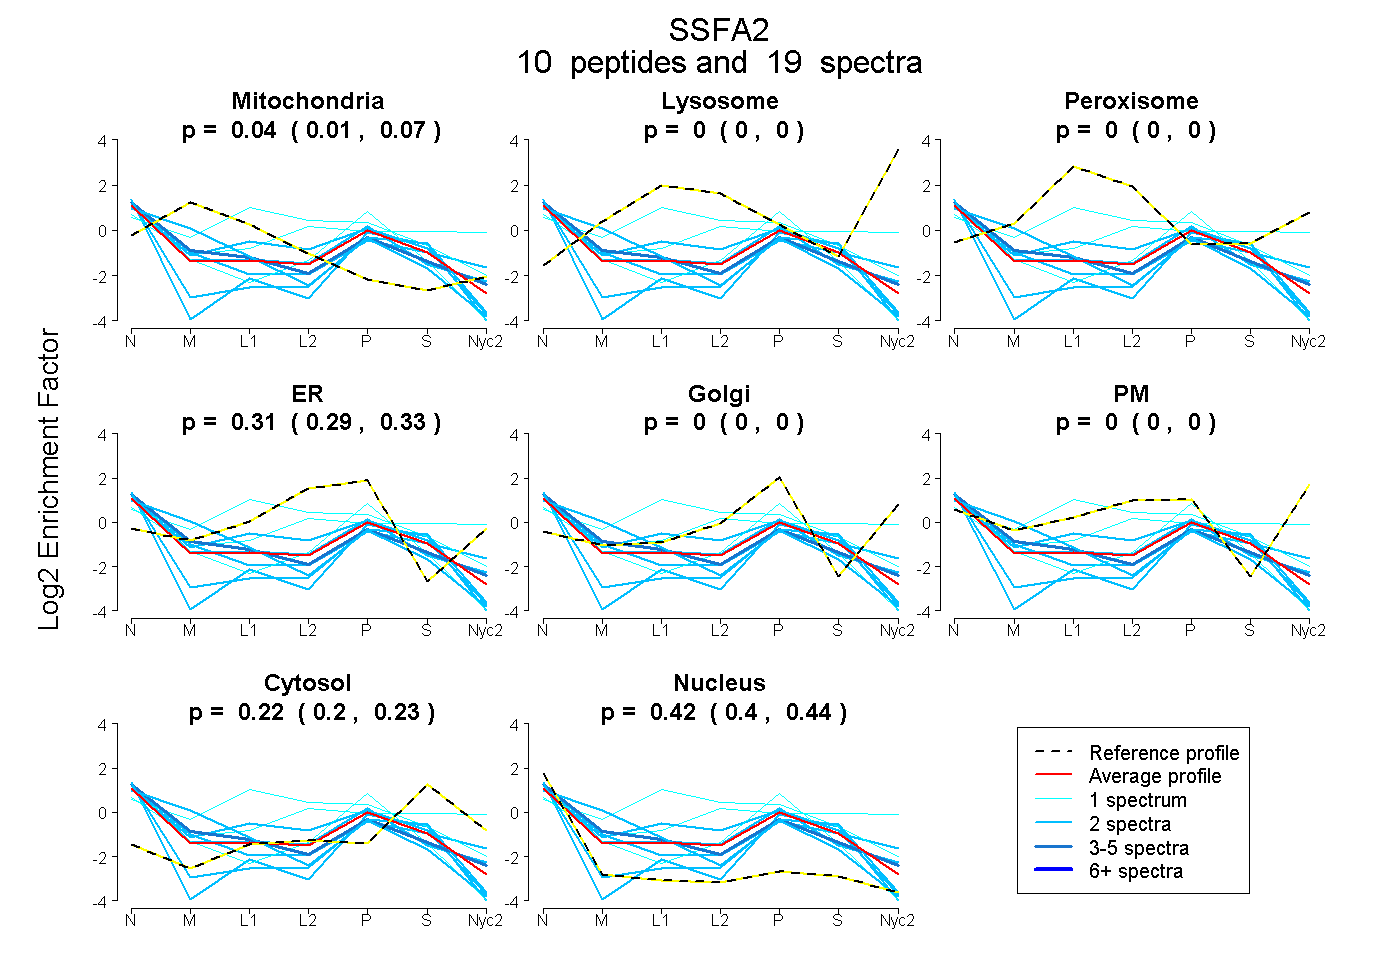
| Expt A |
10 peptides |
19 spectra |
|
0.045 0.012 | 0.075 |
0.000 0.000 | 0.000 |
0.000 0.000 | 0.000 |
0.315 0.294 | 0.332 |
0.000 0.000 | 0.000 |
0.000 0.000 | 0.000 |
0.217 0.199 | 0.231 |
0.423 0.399 | 0.443 |
| 2 spectra, GPDLAAAPYSTQK | 0.114 | 0.000 | 0.067 | 0.299 | 0.000 | 0.000 | 0.138 | 0.383 | ||
| 2 spectra, LEECHHGR | 0.086 | 0.000 | 0.000 | 0.000 | 0.225 | 0.076 | 0.220 | 0.393 | ||
| 1 spectrum, EAADCPPPLTR | 0.000 | 0.000 | 0.073 | 0.004 | 0.000 | 0.437 | 0.415 | 0.071 | ||
| 1 spectrum, MELQDLELQLEER | 0.000 | 0.000 | 0.000 | 0.393 | 0.000 | 0.000 | 0.054 | 0.553 | ||
| 1 spectrum, NVEQDELQQVIR | 0.072 | 0.000 | 0.415 | 0.274 | 0.000 | 0.000 | 0.054 | 0.185 | ||
| 4 spectra, SLNLFR | 0.203 | 0.000 | 0.017 | 0.098 | 0.164 | 0.000 | 0.114 | 0.404 | ||
| 2 spectra, ASVALTPTAPSR | 0.000 | 0.000 | 0.000 | 0.020 | 0.000 | 0.000 | 0.316 | 0.664 | ||
| 2 spectra, DEPDIASK | 0.020 | 0.000 | 0.025 | 0.315 | 0.089 | 0.000 | 0.101 | 0.449 | ||
| 2 spectra, VFLSAQMQR | 0.439 | 0.000 | 0.000 | 0.120 | 0.000 | 0.000 | 0.016 | 0.425 | ||
| 2 spectra, VVSSVNVR | 0.000 | 0.000 | 0.000 | 0.070 | 0.000 | 0.000 | 0.315 | 0.615 |
| Plot | Mito | Lyso or Perox | ER | Golgi | PM | Cytosol | Nucleus | ||||||
| Expt B |
3 peptides |
5 spectra |
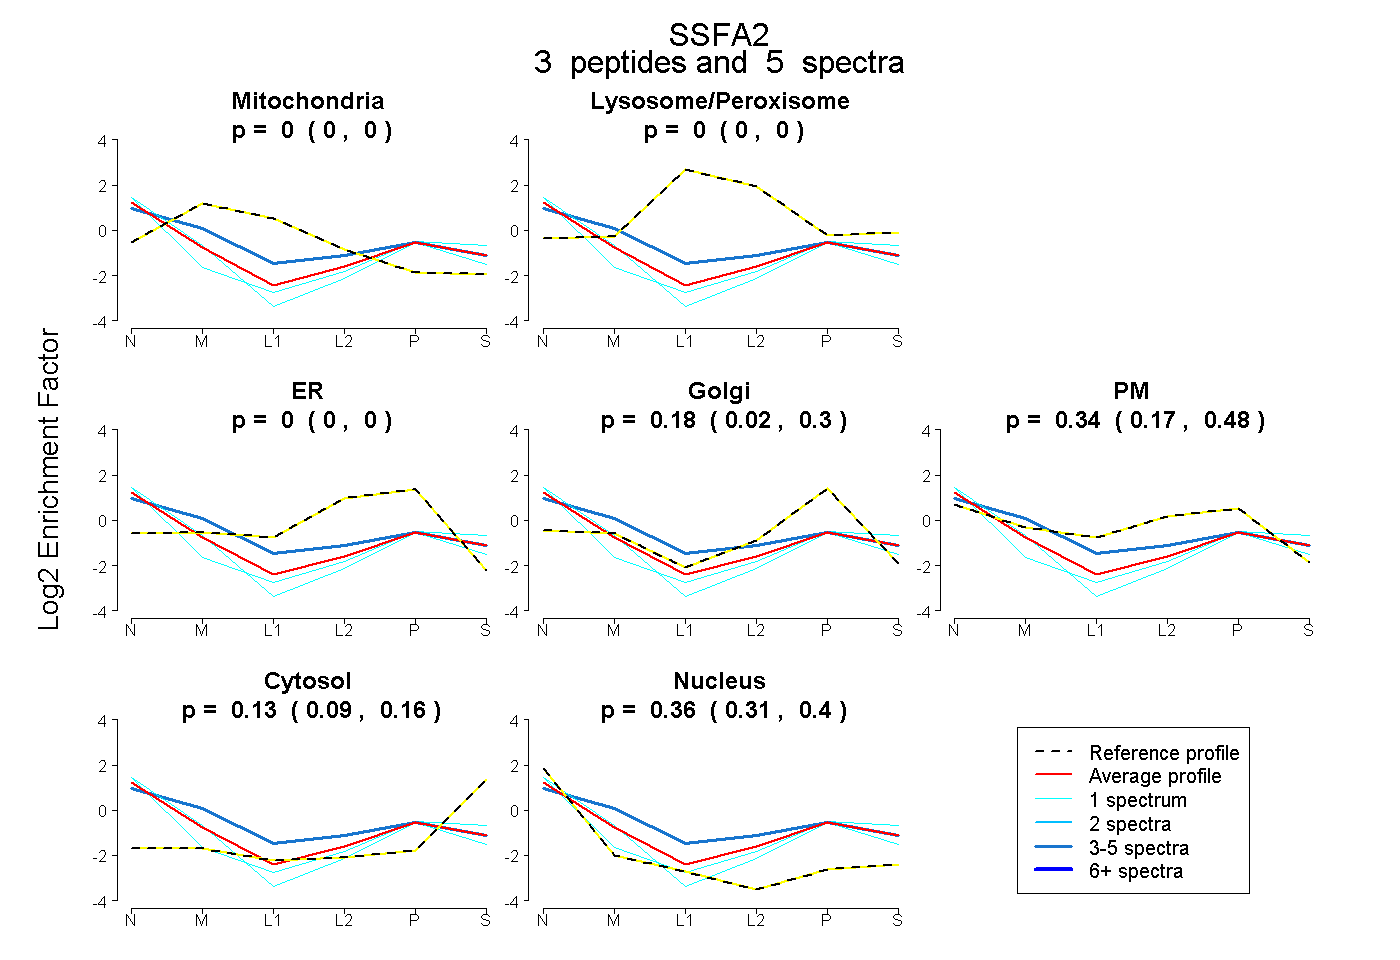 |
0.000 0.000 | 0.000 |
0.000 0.000 | 0.000 |
0.000 0.000 | 0.000 |
0.176 0.023 | 0.296 |
0.337 0.169 | 0.481 |
0.126 0.086 | 0.158 |
0.361 0.311 | 0.401 |
|||
| Plot | Lyso | Other | |||||||||||
| Expt C |
1 peptide |
1 spectrum |
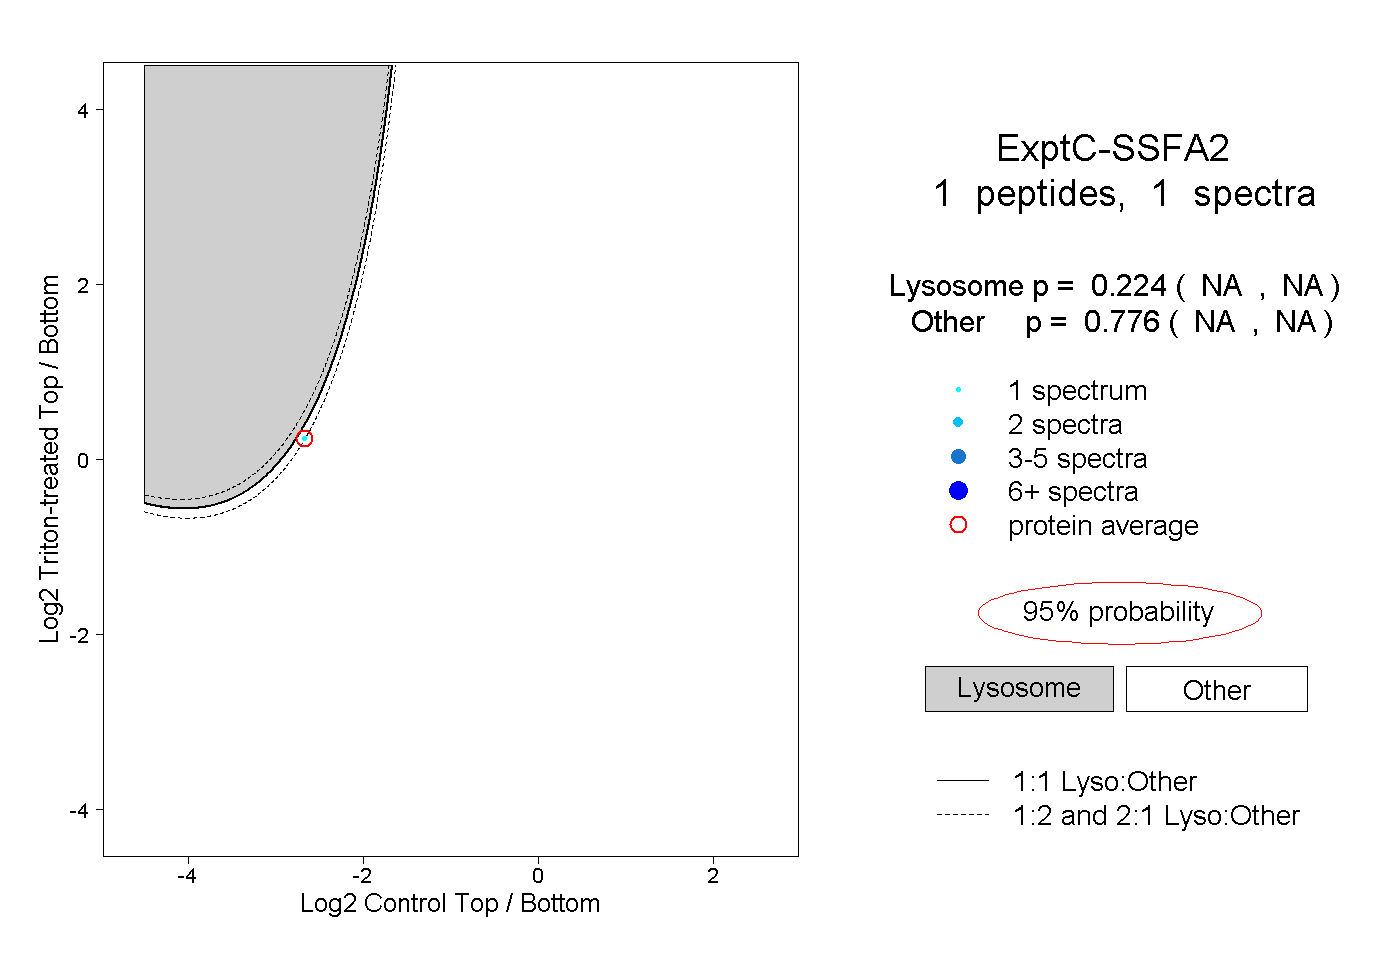 |
0.224 NA | NA |
0.776 NA | NA |