 9
9peptides
spectra
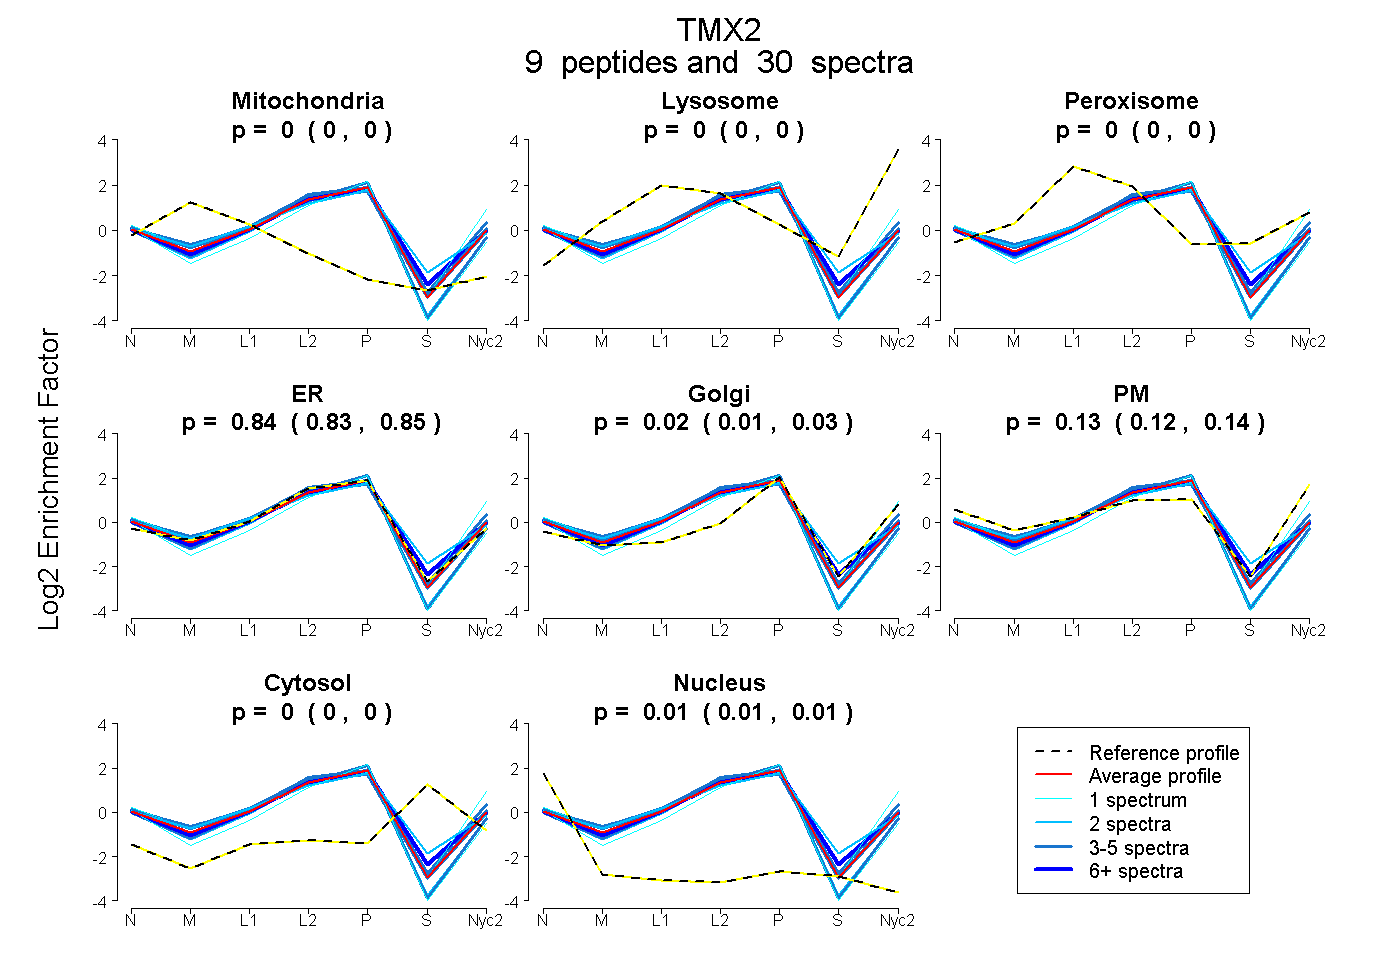
0.000 | 0.000
0.000 | 0.000
0.000 | 0.000
0.827 | 0.853
0.006 | 0.026
0.119 | 0.139
0.000 | 0.000
0.010 | 0.015
6peptides
spectra
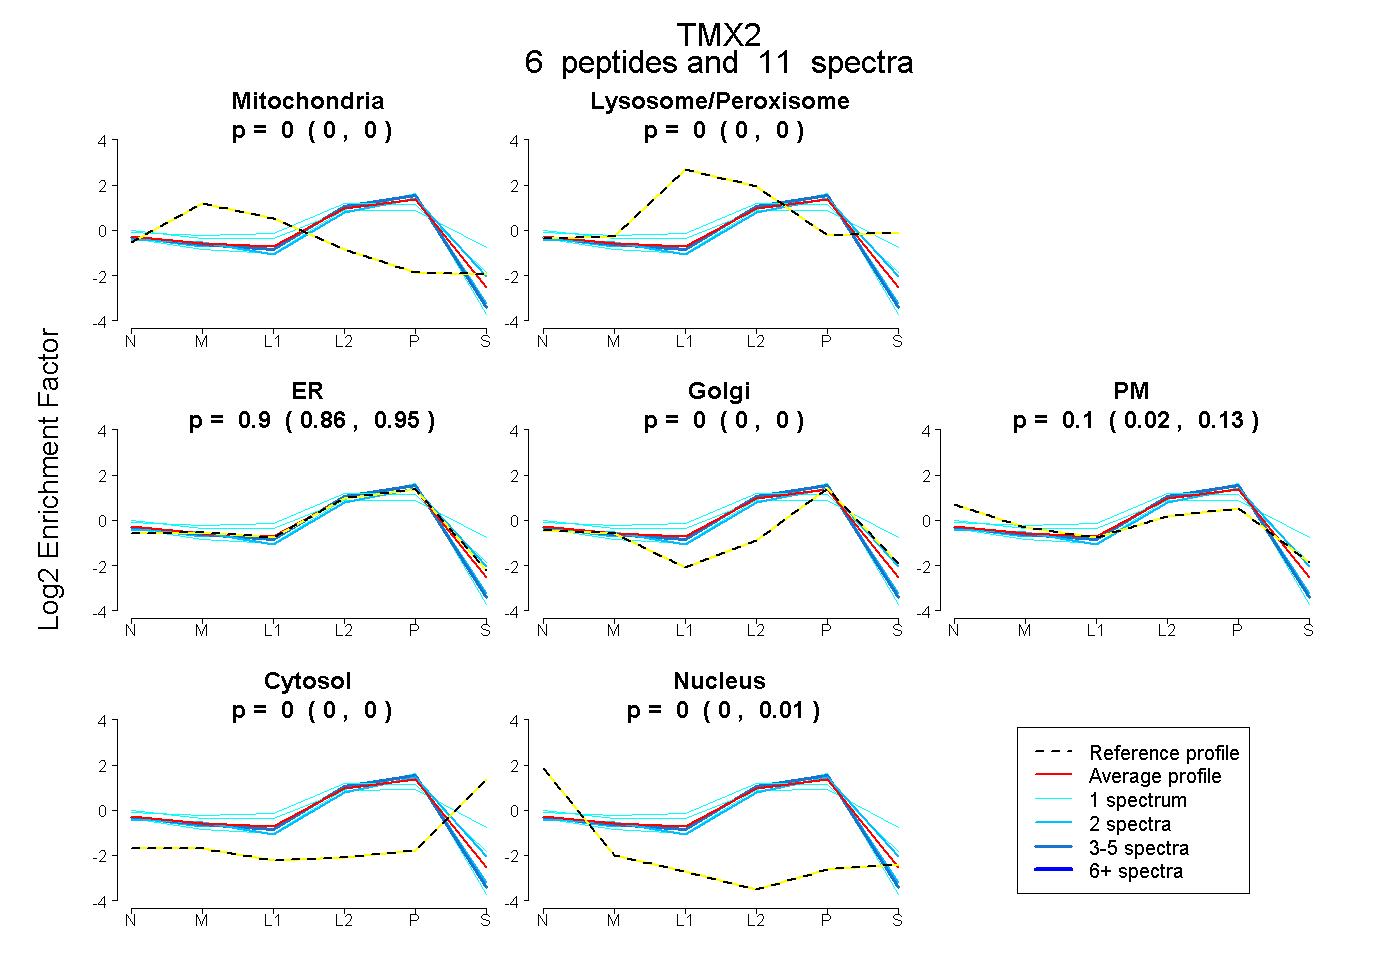
0.000 | 0.000
0.000 | 0.000
0.863 | 0.954
0.000 | 0.000
0.017 | 0.129
0.000 | 0.000
0.000 | 0.015
9peptides
spectra
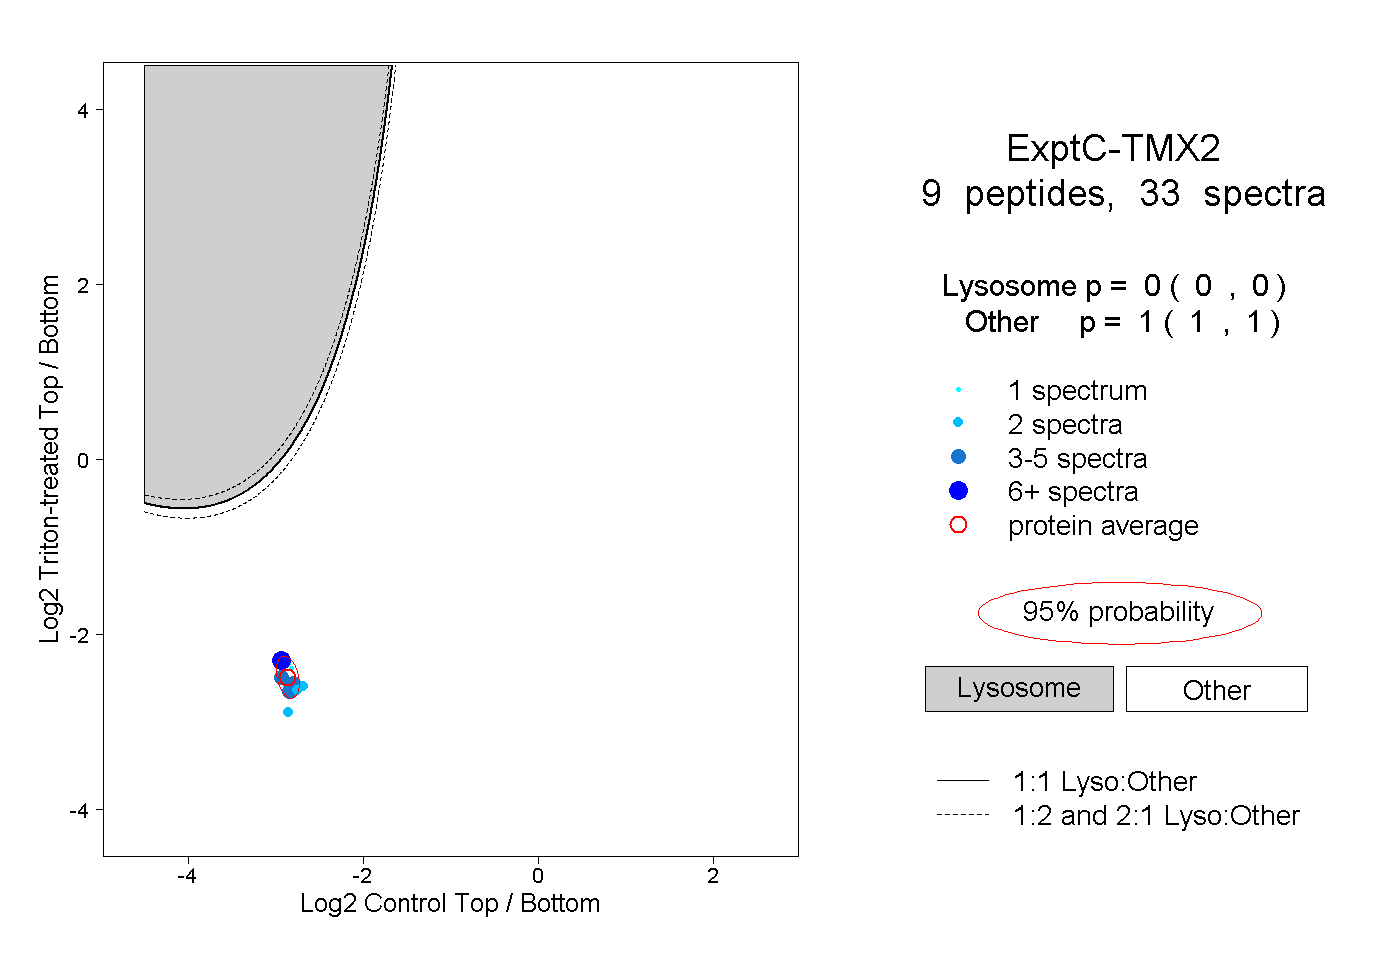
0.000 | 0.000
1.000 | 1.000
4peptides
spectra
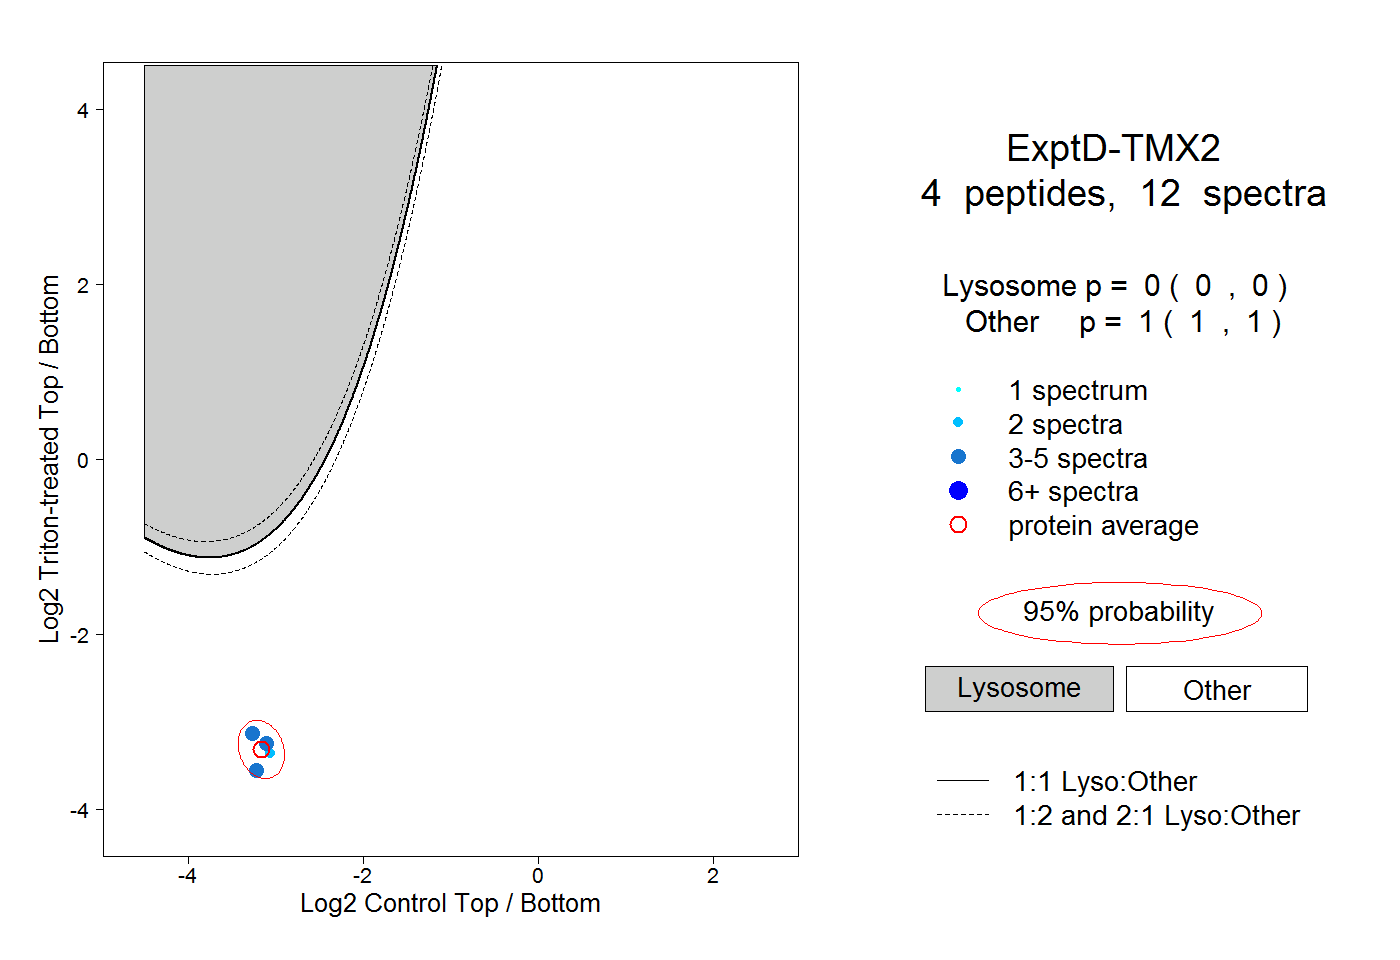
0.000 | 0.000
1.000 | 1.000