 9
9peptides
spectra
0.000 | 0.000
0.000 | 0.000
0.000 | 0.000
0.827 | 0.853
0.006 | 0.026
0.119 | 0.139
0.000 | 0.000
0.010 | 0.015
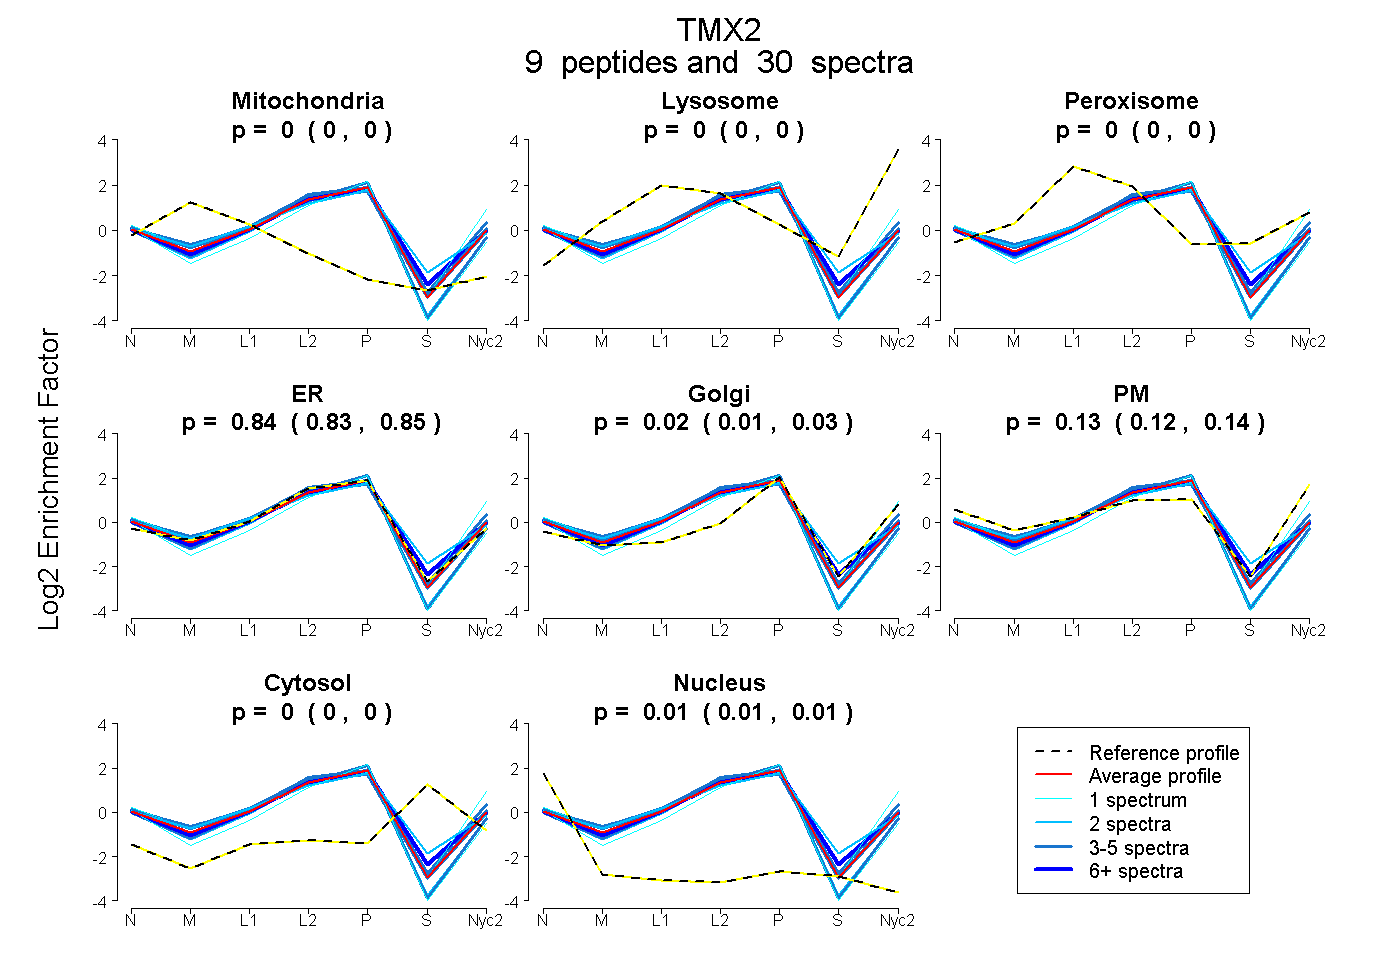
| Plot | Mito | Lyso | Perox | ER | Golgi | PM | Cytosol | Nucleus | |||||
| Expt A |
9 peptides |
30 spectra |
|
0.000 0.000 | 0.000 |
0.000 0.000 | 0.000 |
0.000 0.000 | 0.000 |
0.841 0.827 | 0.853 |
0.017 0.006 | 0.026 |
0.130 0.119 | 0.139 |
0.000 0.000 | 0.000 |
0.012 0.010 | 0.015 |
| 1 spectrum, YTDVSTR | 0.000 | 0.000 | 0.000 | 0.891 | 0.037 | 0.000 | 0.000 | 0.072 | ||
| 1 spectrum, VANAILFFR | 0.000 | 0.000 | 0.000 | 0.435 | 0.086 | 0.479 | 0.000 | 0.000 | ||
| 4 spectra, EDGNPCDFDWR | 0.000 | 0.000 | 0.000 | 0.669 | 0.026 | 0.305 | 0.000 | 0.000 | ||
| 4 spectra, EFNLNELYQR | 0.000 | 0.000 | 0.000 | 0.977 | 0.000 | 0.000 | 0.000 | 0.023 | ||
| 2 spectra, YNCSGLNFGK | 0.000 | 0.000 | 0.077 | 0.738 | 0.053 | 0.067 | 0.065 | 0.000 | ||
| 3 spectra, QLPTLILFQGGK | 0.005 | 0.000 | 0.000 | 0.835 | 0.000 | 0.155 | 0.000 | 0.005 | ||
| 3 spectra, VSTSPLTK | 0.000 | 0.000 | 0.000 | 0.838 | 0.000 | 0.162 | 0.000 | 0.000 | ||
| 2 spectra, AVSWTFSEENVIR | 0.000 | 0.000 | 0.000 | 0.974 | 0.000 | 0.000 | 0.000 | 0.026 | ||
| 10 spectra, TIDEELER | 0.000 | 0.000 | 0.000 | 0.805 | 0.041 | 0.124 | 0.029 | 0.001 |
| Plot | Mito | Lyso or Perox | ER | Golgi | PM | Cytosol | Nucleus | ||||||
| Expt B |
6 peptides |
11 spectra |
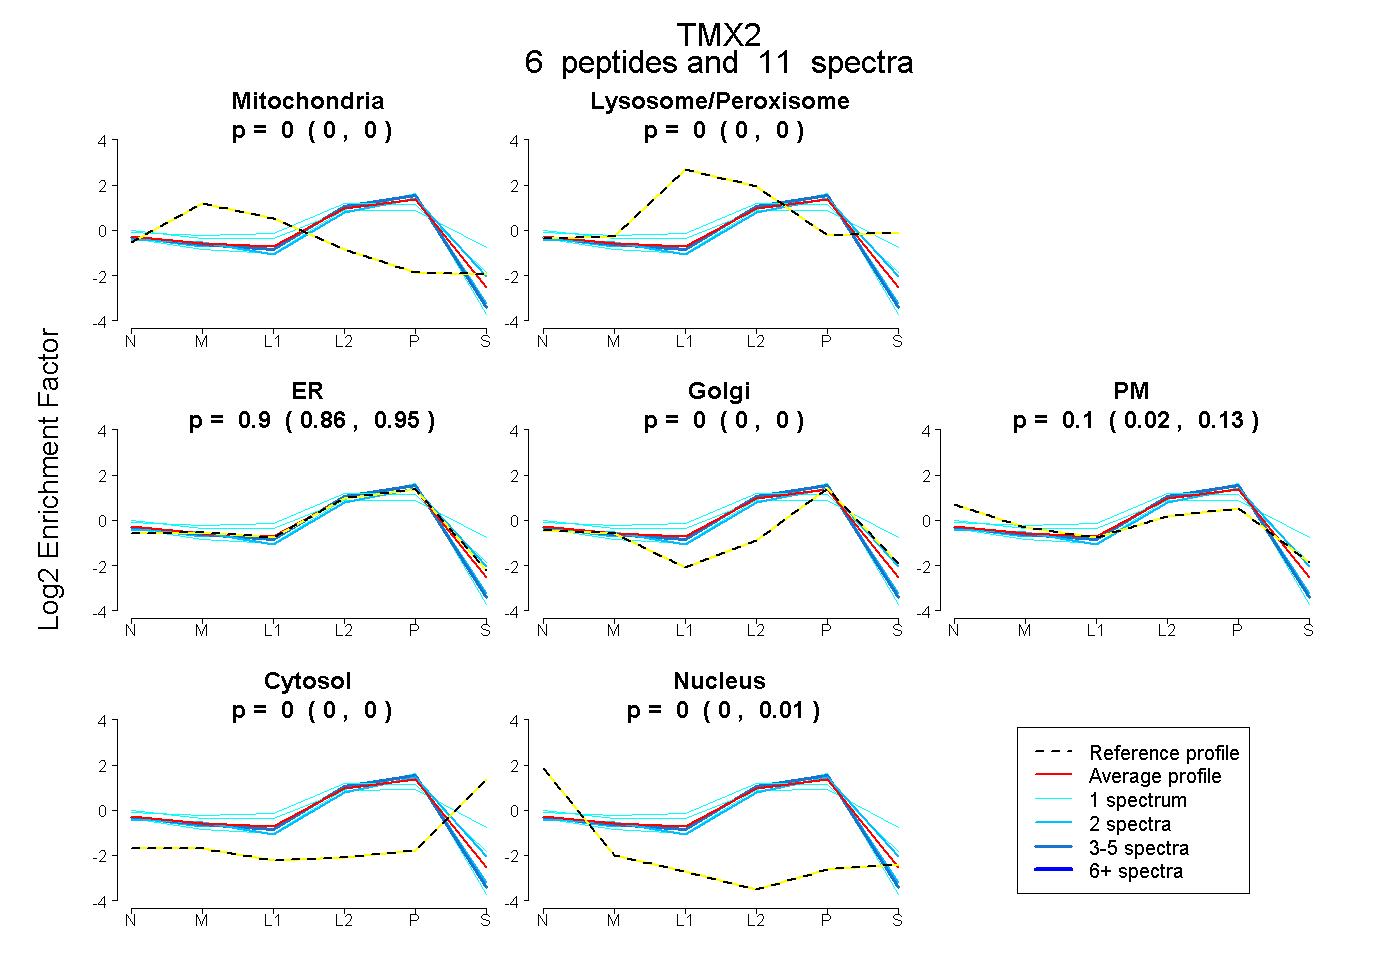 |
0.000 0.000 | 0.000 |
0.000 0.000 | 0.000 |
0.900 0.863 | 0.954 |
0.000 0.000 | 0.000 |
0.100 0.017 | 0.129 |
0.000 0.000 | 0.000 |
0.000 0.000 | 0.015 |
|||
| Plot | Lyso | Other | |||||||||||
| Expt C |
9 peptides |
33 spectra |
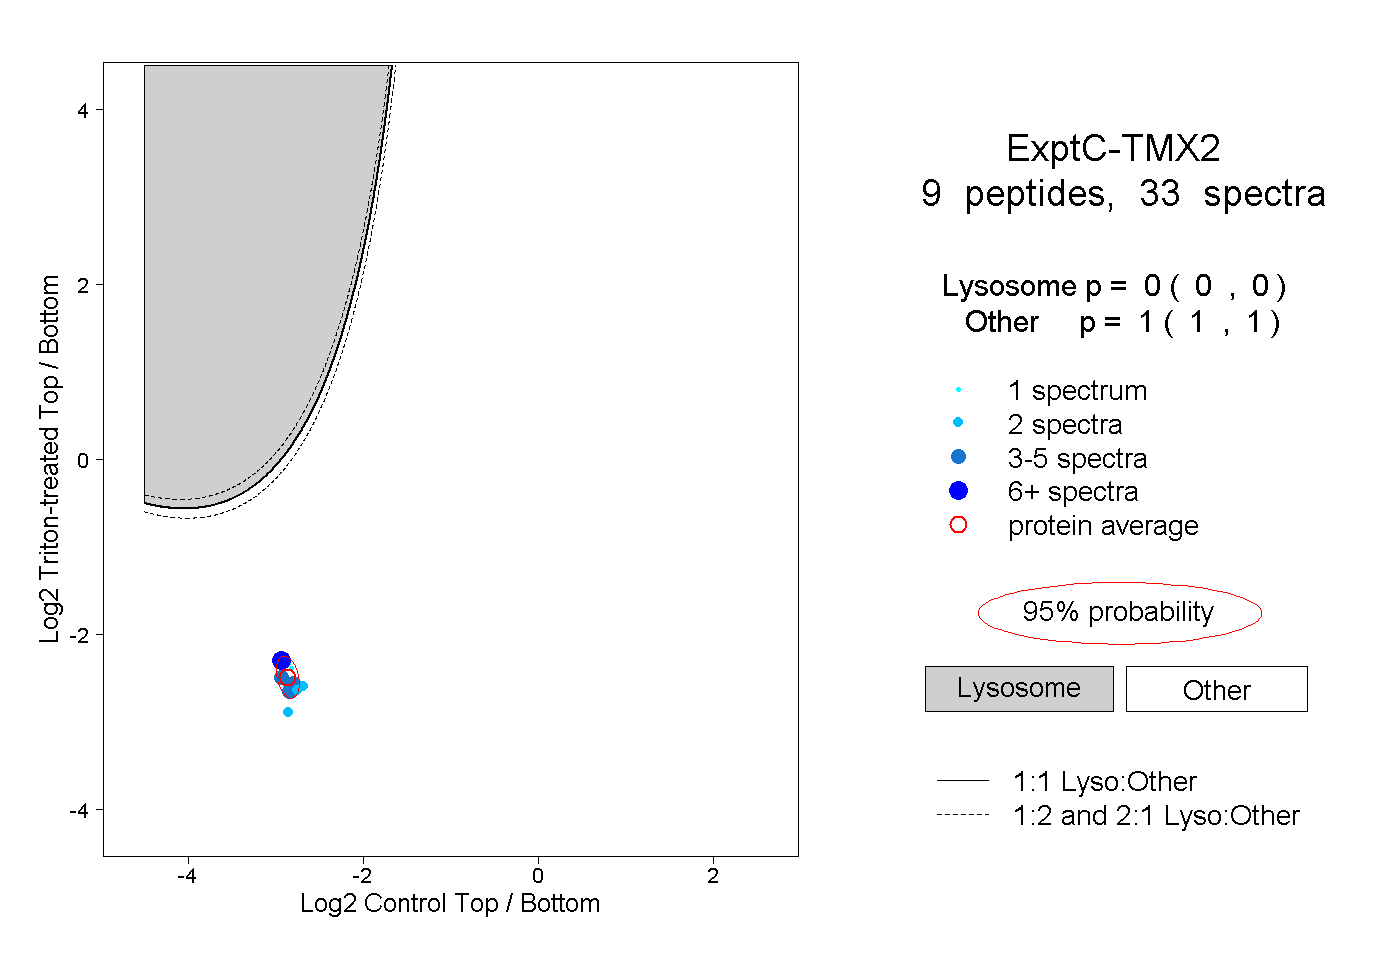 |
0.000 0.000 | 0.000 |
1.000 1.000 | 1.000 |
||||||||
| Plot | Lyso | Other | |||||||||||
| Expt D |
4 peptides |
12 spectra |
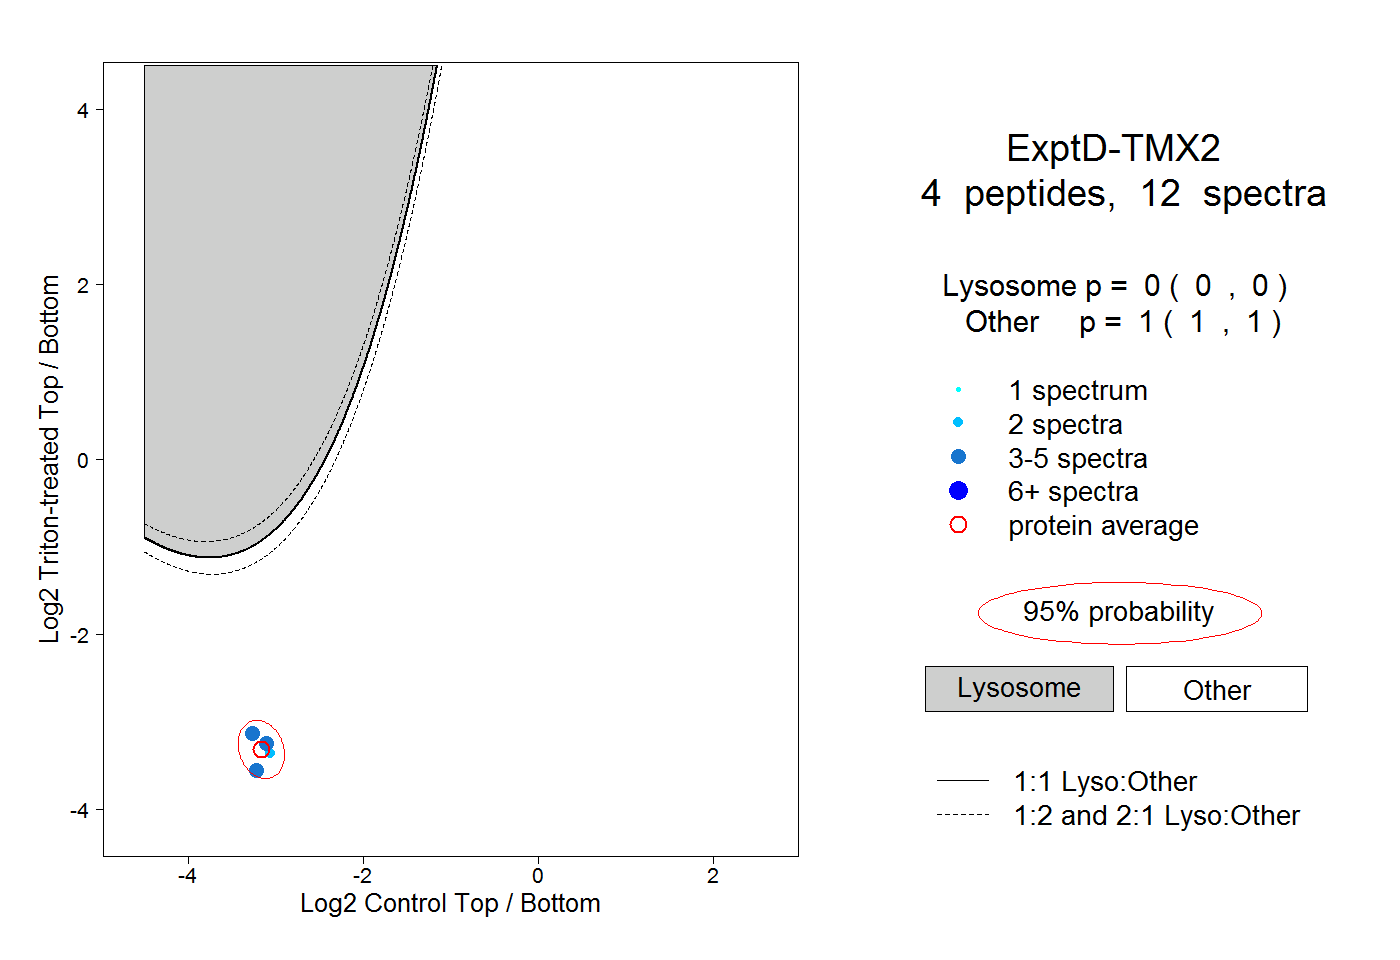 |
0.000 0.000 | 0.000 |
1.000 1.000 | 1.000 |