TMX2
[ENSRNOP00000007914]
Main page
| | | Plot |
Mito |
Lyso |
|
Perox |
ER |
Golgi |
PM |
Cytosol |
Nucleus |
|
| Expt A |
 9
9
peptides |
30
spectra |
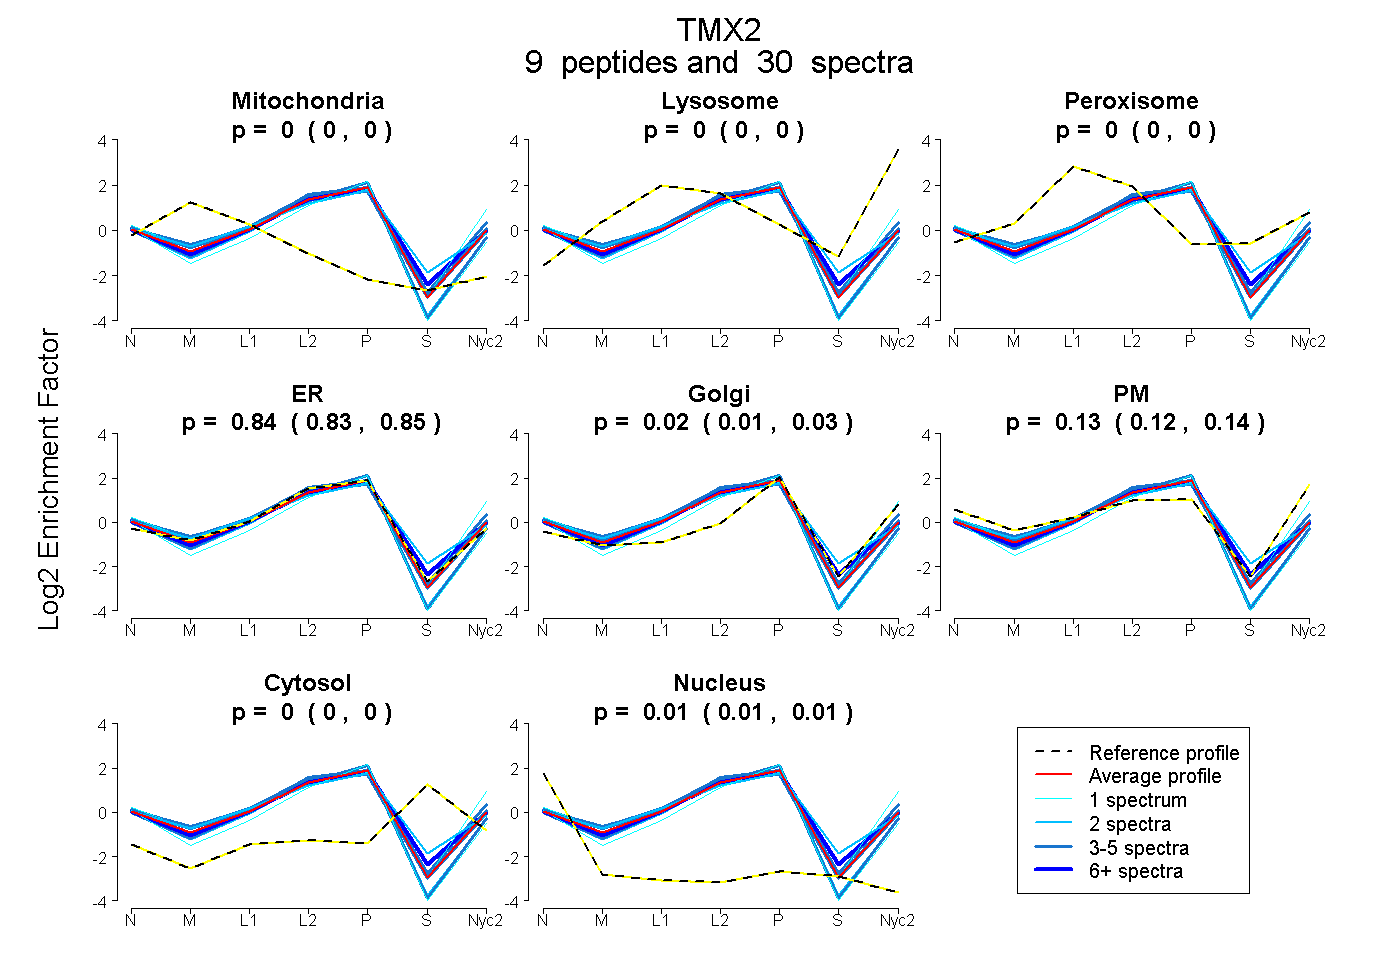 |
0.000
0.000 | 0.000 |
0.000
0.000 | 0.000 |
|
0.000
0.000 | 0.000 |
0.841
0.827 | 0.853 |
0.017
0.006 | 0.026 |
0.130
0.119 | 0.139 |
0.000
0.000 | 0.000 |
0.012
0.010 | 0.015 |
|
| | | Plot |
Mito |
|
Lyso or Perox |
|
ER |
Golgi |
PM |
Cytosol |
Nucleus |
|
| Expt B |
6
peptides |
11
spectra |
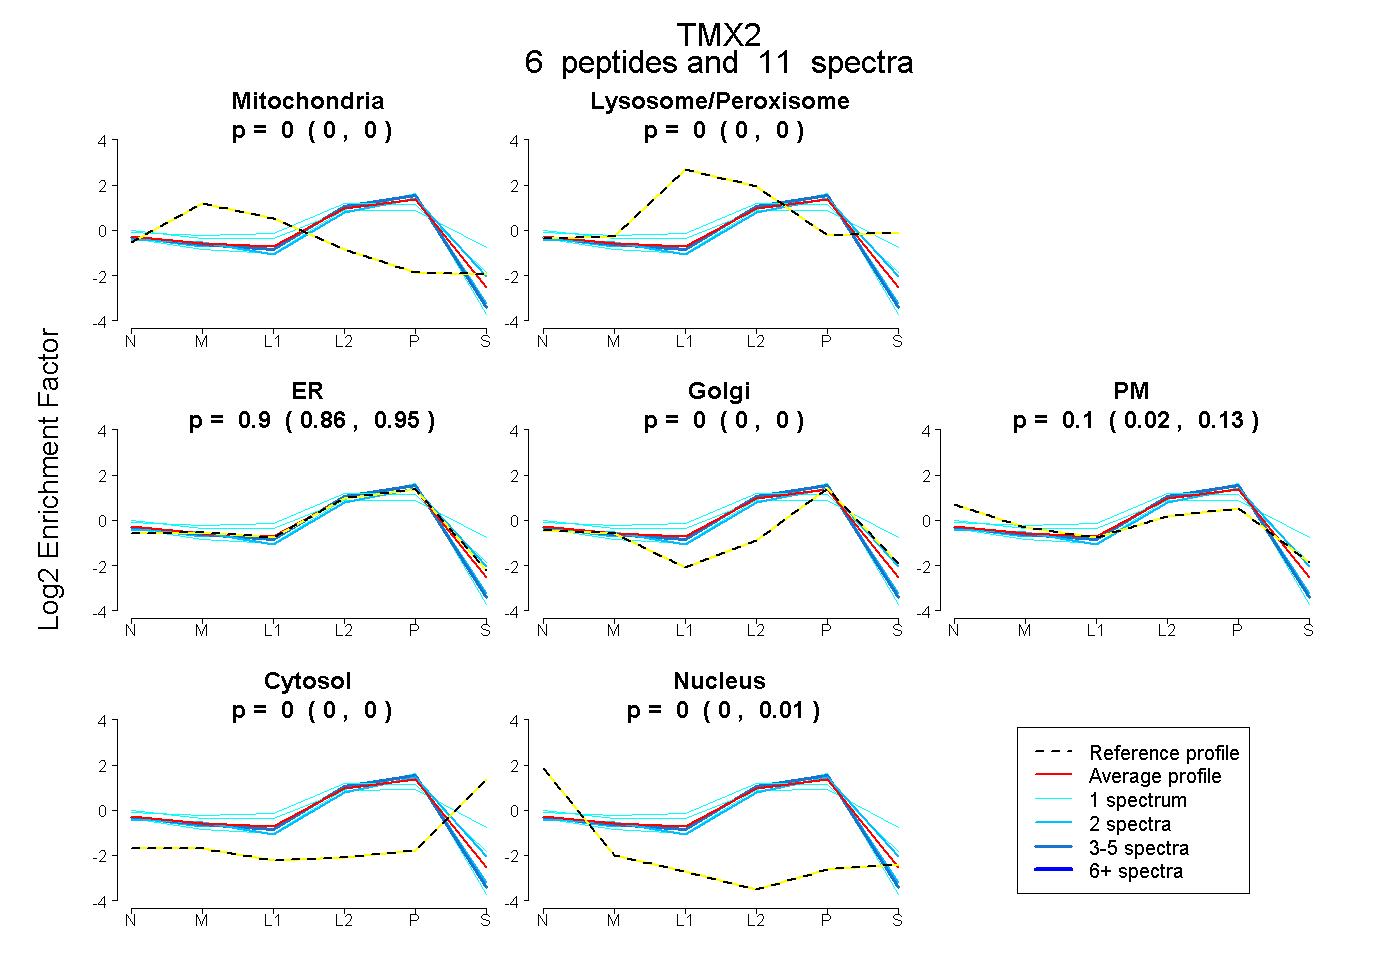 |
0.000
0.000 | 0.000 |
|
0.000
0.000 | 0.000 |
|
0.900
0.863 | 0.954 |
0.000
0.000 | 0.000 |
0.100
0.017 | 0.129 |
0.000
0.000 | 0.000 |
0.000
0.000 | 0.015 |
|
| 2 spectra, YTDVSTR |
0.000 |
|
0.000 |
|
0.814 |
0.133 |
0.053 |
0.000 |
0.000 |
|
| 1 spectrum, YNCSGLNFGK |
0.000 |
|
0.290 |
|
0.247 |
0.193 |
0.224 |
0.047 |
0.000 |
|
| 1 spectrum, VANAILFFR |
0.000 |
|
0.167 |
|
0.665 |
0.000 |
0.167 |
0.000 |
0.000 |
|
| 2 spectra, QLPTLILFQGGK |
0.000 |
|
0.000 |
|
0.994 |
0.000 |
0.000 |
0.000 |
0.006 |
|
| 4 spectra, TIDEELER |
0.000 |
|
0.000 |
|
0.996 |
0.000 |
0.000 |
0.000 |
0.004 |
|
| 1 spectrum, EFNLNELYQR |
0.000 |
|
0.000 |
|
0.979 |
0.000 |
0.000 |
0.000 |
0.021 |
|
| | | Plot |
|
Lyso |
|
|
|
|
|
|
|
Other |
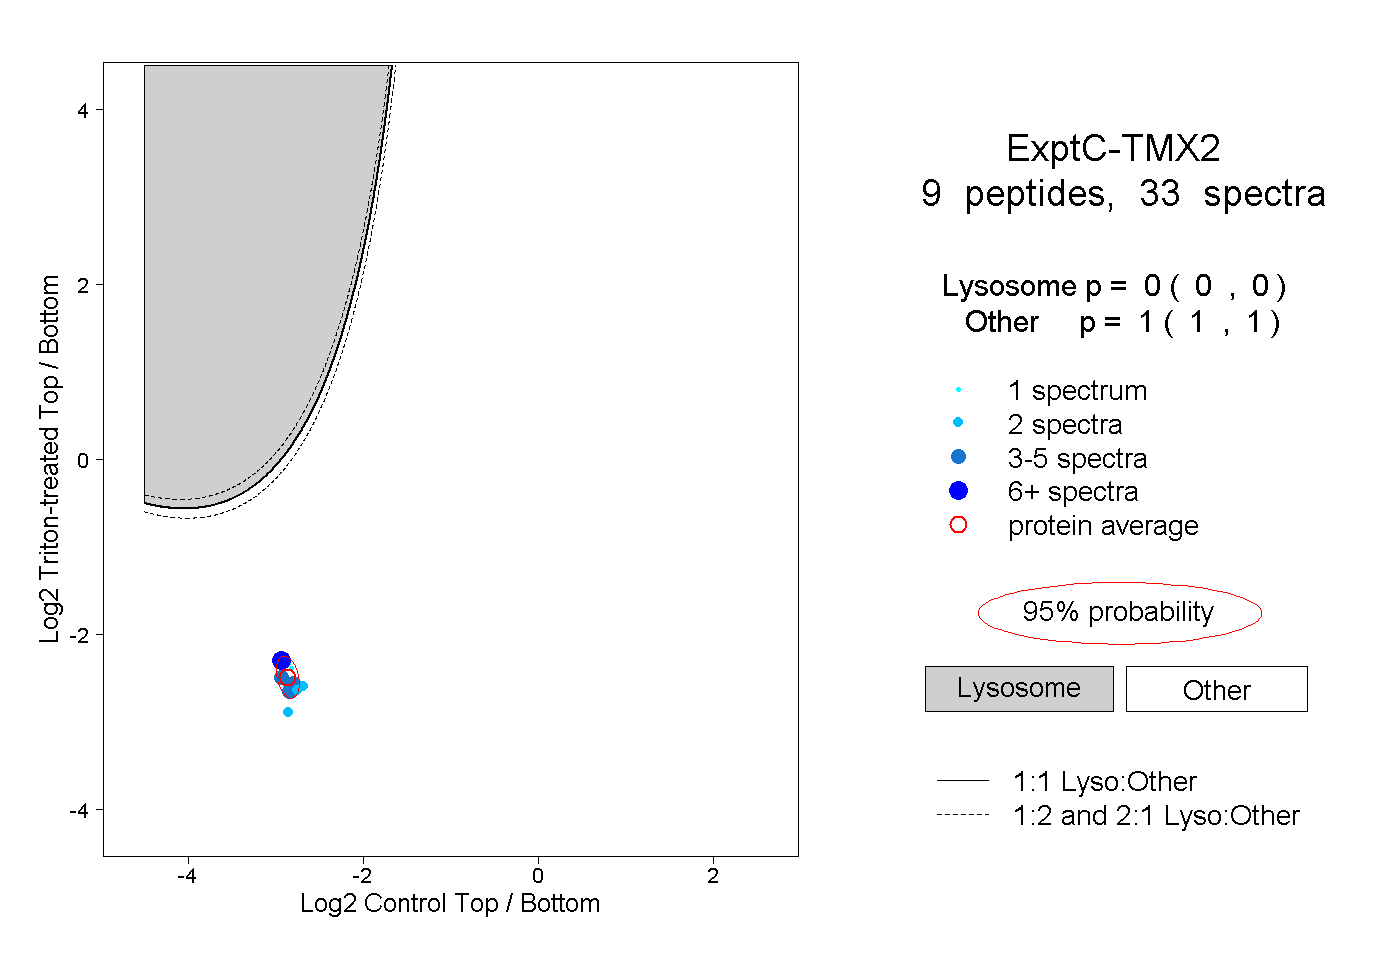
| Expt C |
9
peptides |
33
spectra |
 |
|
0.000
0.000 | 0.000 |
|
|
|
|
|
|
|
1.000
1.000 | 1.000 |
| | | Plot |
|
Lyso |
|
|
|
|
|
|
|
Other |
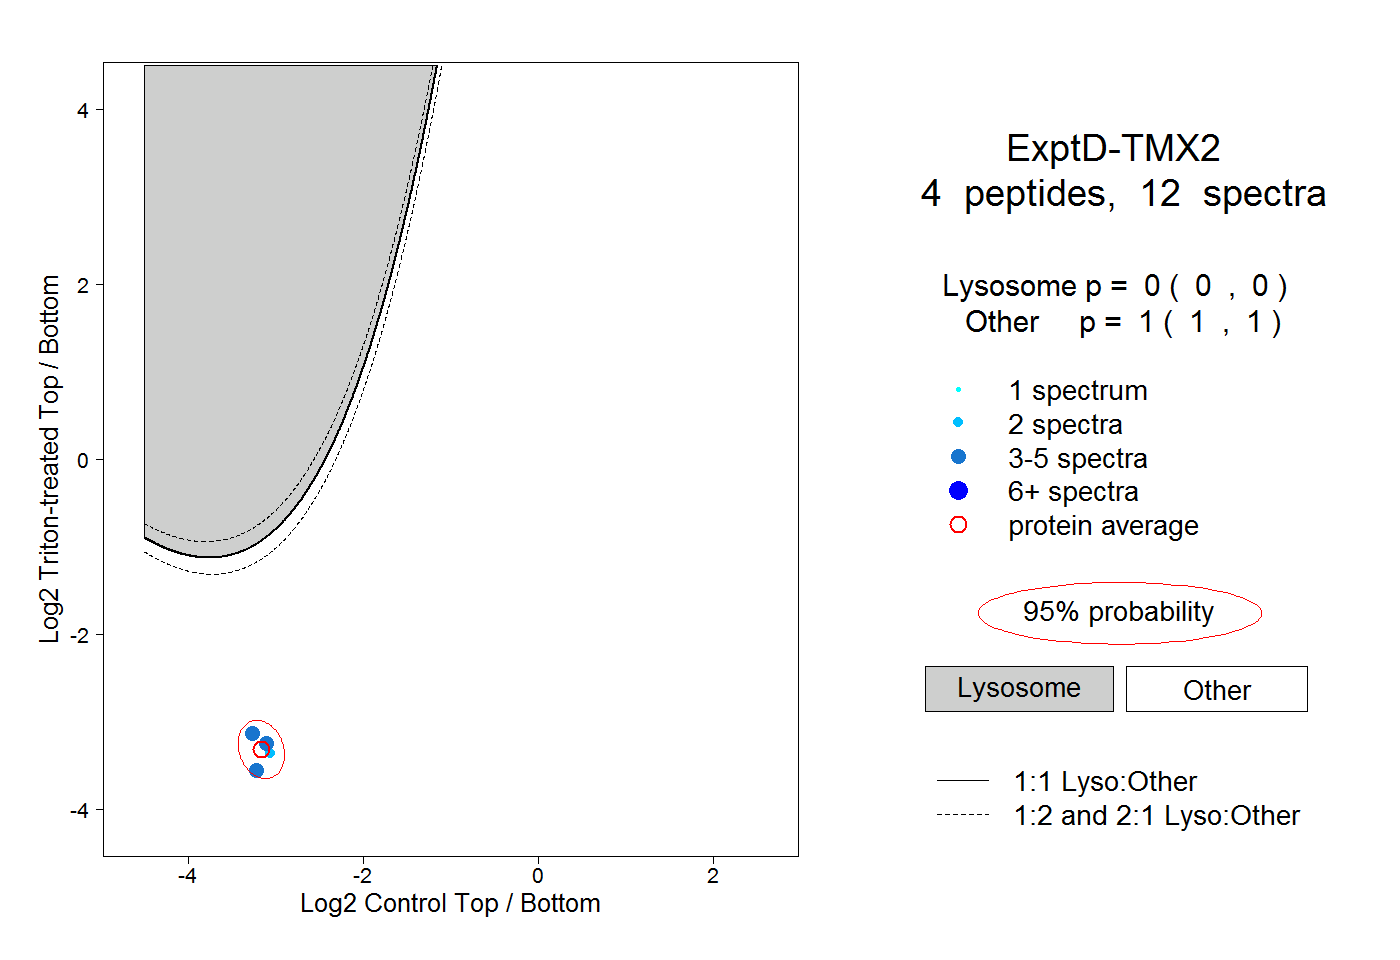
| Expt D |
4
peptides |
12
spectra |
 |
|
0.000
0.000 | 0.000 |
|
|
|
|
|
|
|
1.000
1.000 | 1.000 |