 15
15peptides
spectra
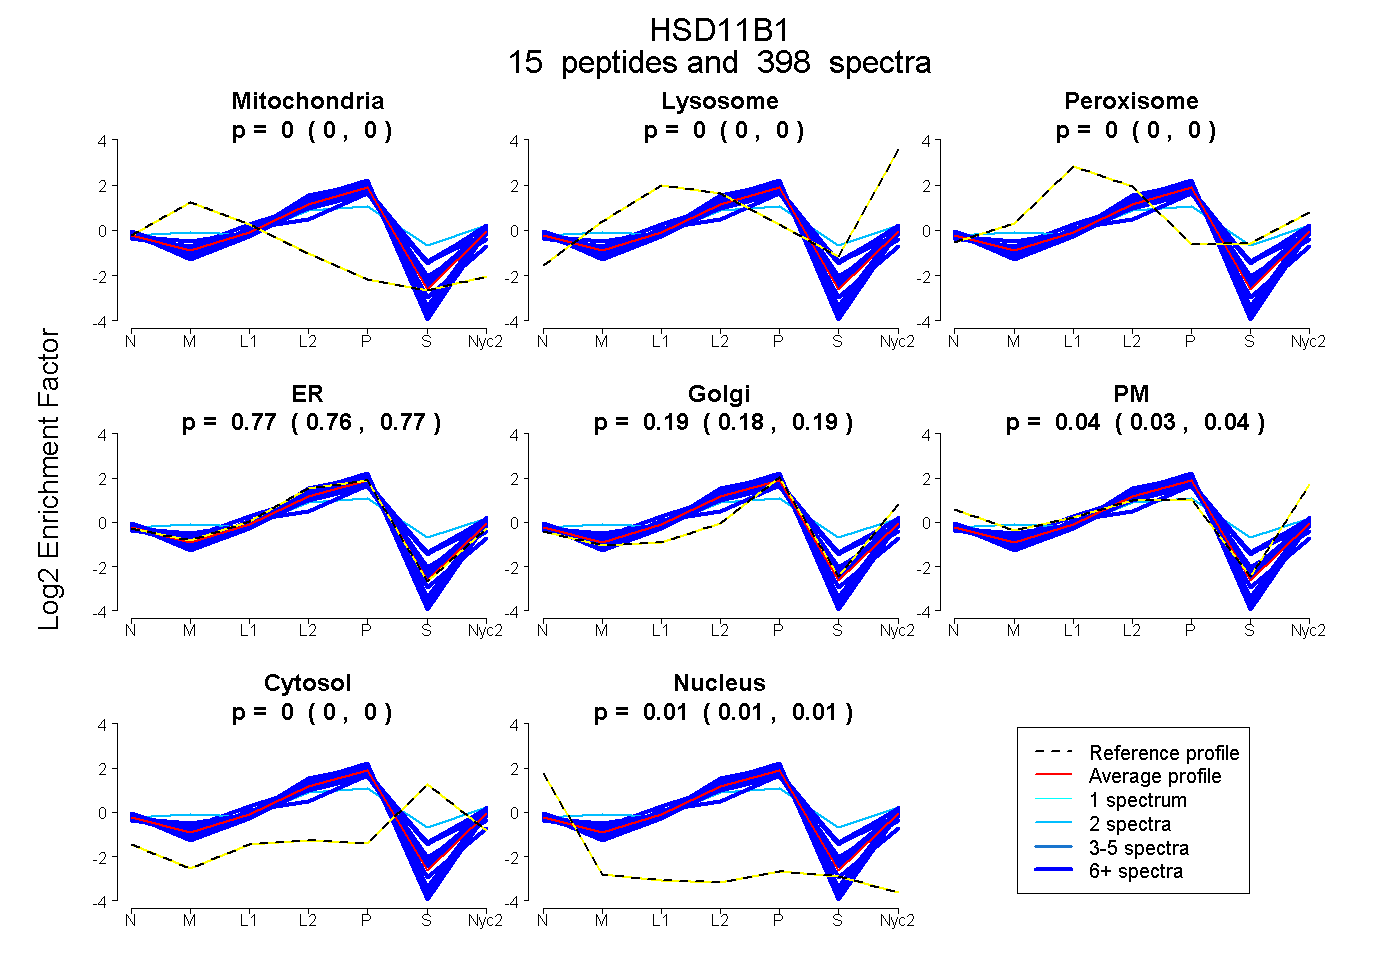
0.000 | 0.000
0.000 | 0.000
0.000 | 0.004
0.762 | 0.771
0.183 | 0.192
0.030 | 0.038
0.000 | 0.000
0.009 | 0.010
13peptides
spectra
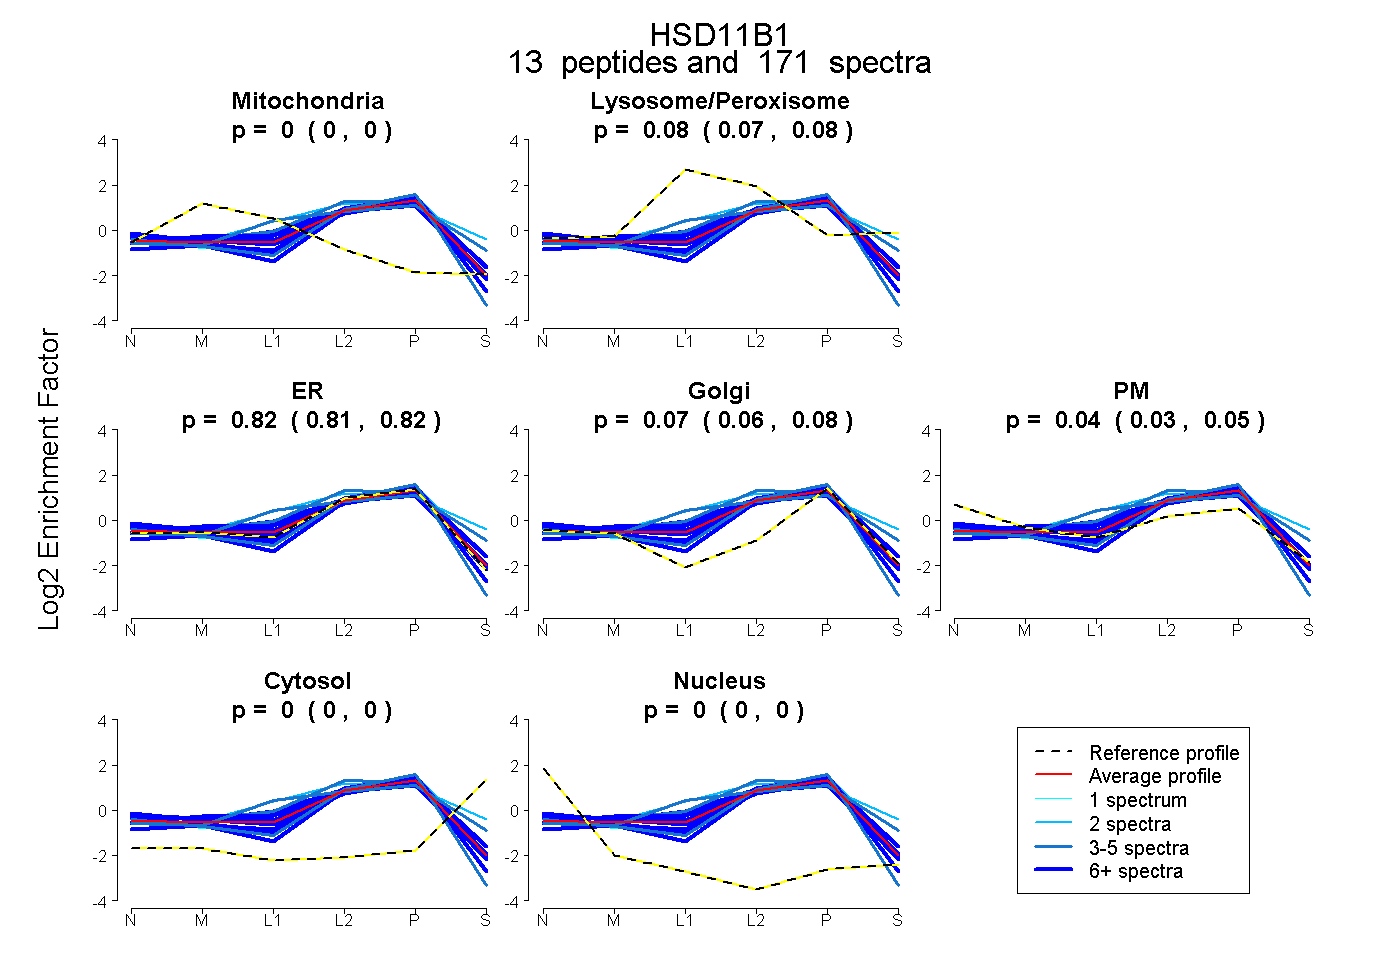
0.000 | 0.000
0.070 | 0.083
0.806 | 0.824
0.059 | 0.077
0.029 | 0.045
0.000 | 0.000
0.000 | 0.000
16peptides
spectra

0.000 | 0.000
1.000 | 1.000
9peptides
spectra
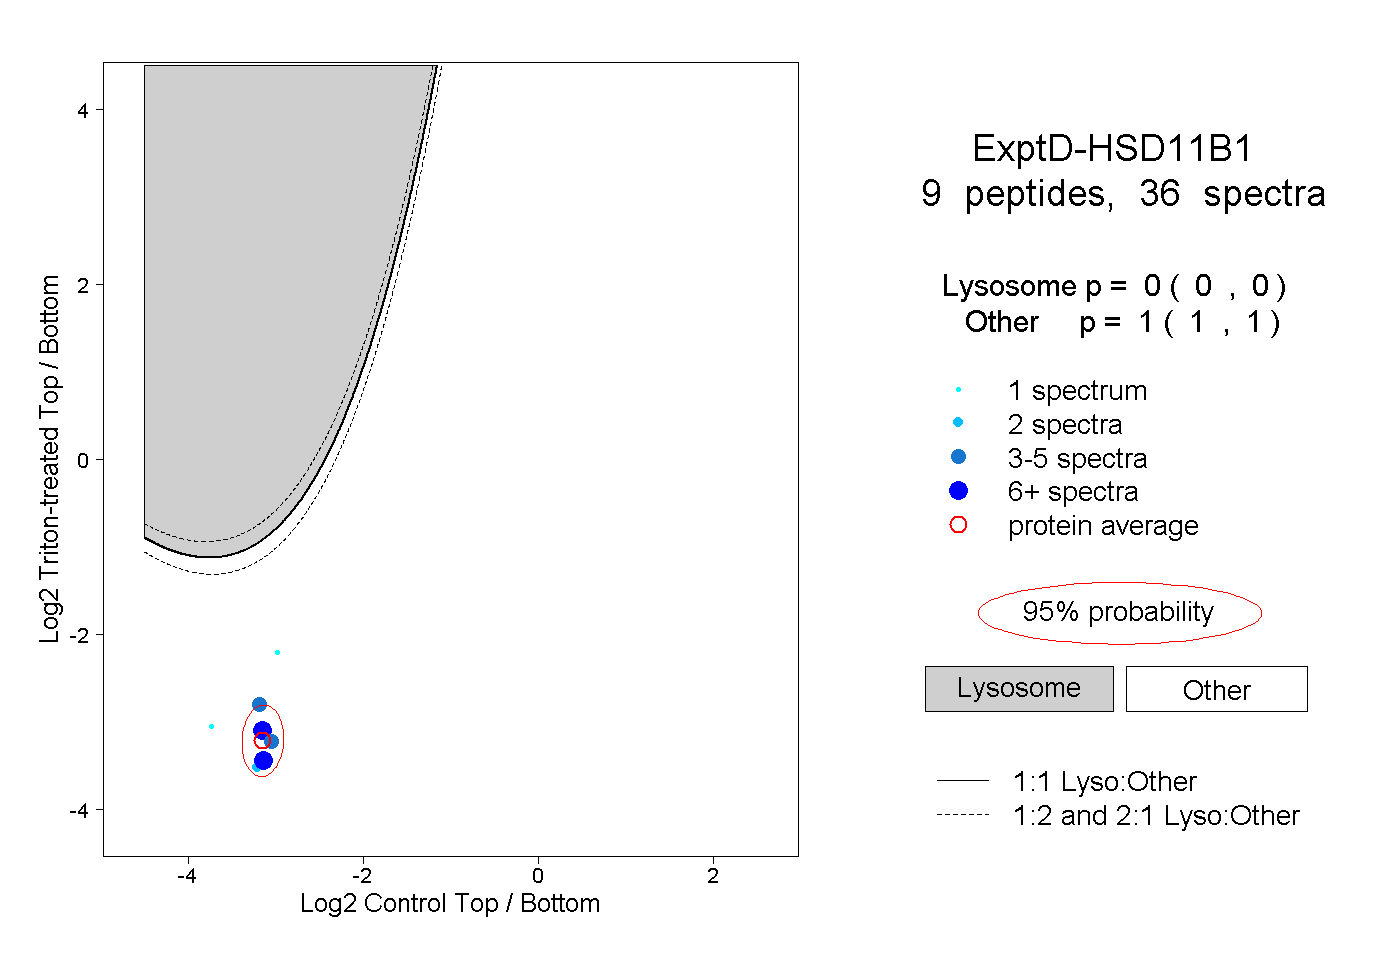
0.000 | 0.000
1.000 | 1.000