 15
15peptides
spectra
0.000 | 0.000
0.000 | 0.000
0.000 | 0.004
0.762 | 0.771
0.183 | 0.192
0.030 | 0.038
0.000 | 0.000
0.009 | 0.010
| Plot | Mito | Lyso | Perox | ER | Golgi | PM | Cytosol | Nucleus | |||||
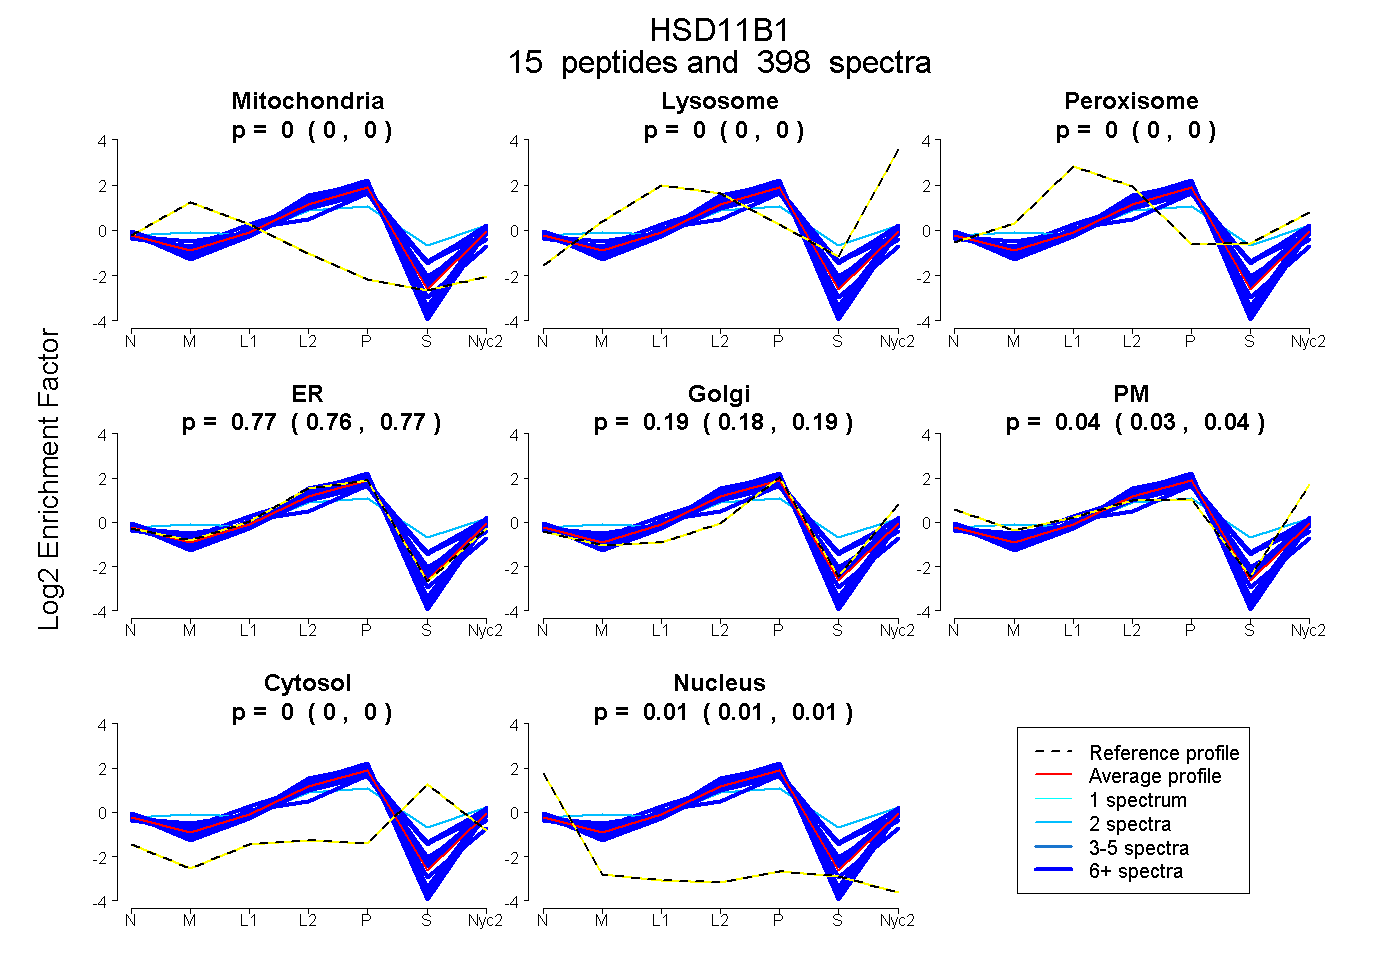
| Expt A |
15 peptides |
398 spectra |
|
0.000 0.000 | 0.000 |
0.000 0.000 | 0.000 |
0.000 0.000 | 0.004 |
0.768 0.762 | 0.771 |
0.186 0.183 | 0.192 |
0.036 0.030 | 0.038 |
0.000 0.000 | 0.000 |
0.010 0.009 | 0.010 |
| 22 spectra, SEEGLQK | 0.000 | 0.000 | 0.000 | 0.701 | 0.110 | 0.130 | 0.059 | 0.000 | ||
| 75 spectra, IMEFLSLR | 0.000 | 0.000 | 0.000 | 0.883 | 0.066 | 0.052 | 0.000 | 0.000 | ||
| 10 spectra, FVVEAGK | 0.000 | 0.000 | 0.000 | 0.760 | 0.240 | 0.000 | 0.000 | 0.000 | ||
| 10 spectra, CLELGAASAHYIAGTMEDMAFAER | 0.000 | 0.000 | 0.072 | 0.813 | 0.053 | 0.000 | 0.062 | 0.000 | ||
| 22 spectra, MTQPLIASYSASK | 0.000 | 0.000 | 0.147 | 0.463 | 0.286 | 0.000 | 0.104 | 0.000 | ||
| 40 spectra, FALDGFFSTIR | 0.000 | 0.000 | 0.000 | 0.843 | 0.157 | 0.000 | 0.000 | 0.000 | ||
| 9 spectra, ETSGIILSQAAPK | 0.000 | 0.017 | 0.020 | 0.745 | 0.200 | 0.010 | 0.007 | 0.000 | ||
| 21 spectra, EHLMTK | 0.000 | 0.000 | 0.000 | 0.702 | 0.110 | 0.018 | 0.170 | 0.000 | ||
| 9 spectra, EMAYHLSK | 0.000 | 0.000 | 0.139 | 0.317 | 0.429 | 0.000 | 0.115 | 0.000 | ||
| 23 spectra, VIVTGASK | 0.000 | 0.000 | 0.000 | 0.839 | 0.161 | 0.000 | 0.000 | 0.000 | ||
| 2 spectra, DLFVSN | 0.000 | 0.000 | 0.246 | 0.254 | 0.254 | 0.069 | 0.176 | 0.000 | ||
| 100 spectra, MGAHVVLTAR | 0.037 | 0.000 | 0.073 | 0.597 | 0.277 | 0.015 | 0.000 | 0.000 | ||
| 27 spectra, SSWTPLLLGNPGR | 0.000 | 0.000 | 0.000 | 0.936 | 0.064 | 0.000 | 0.000 | 0.000 | ||
| 20 spectra, EECALEIIK | 0.000 | 0.000 | 0.000 | 0.941 | 0.000 | 0.000 | 0.000 | 0.059 | ||
| 8 spectra, DEVYYDK | 0.000 | 0.000 | 0.000 | 0.837 | 0.150 | 0.000 | 0.000 | 0.013 |
| Plot | Mito | Lyso or Perox | ER | Golgi | PM | Cytosol | Nucleus | ||||||
| Expt B |
13 peptides |
171 spectra |
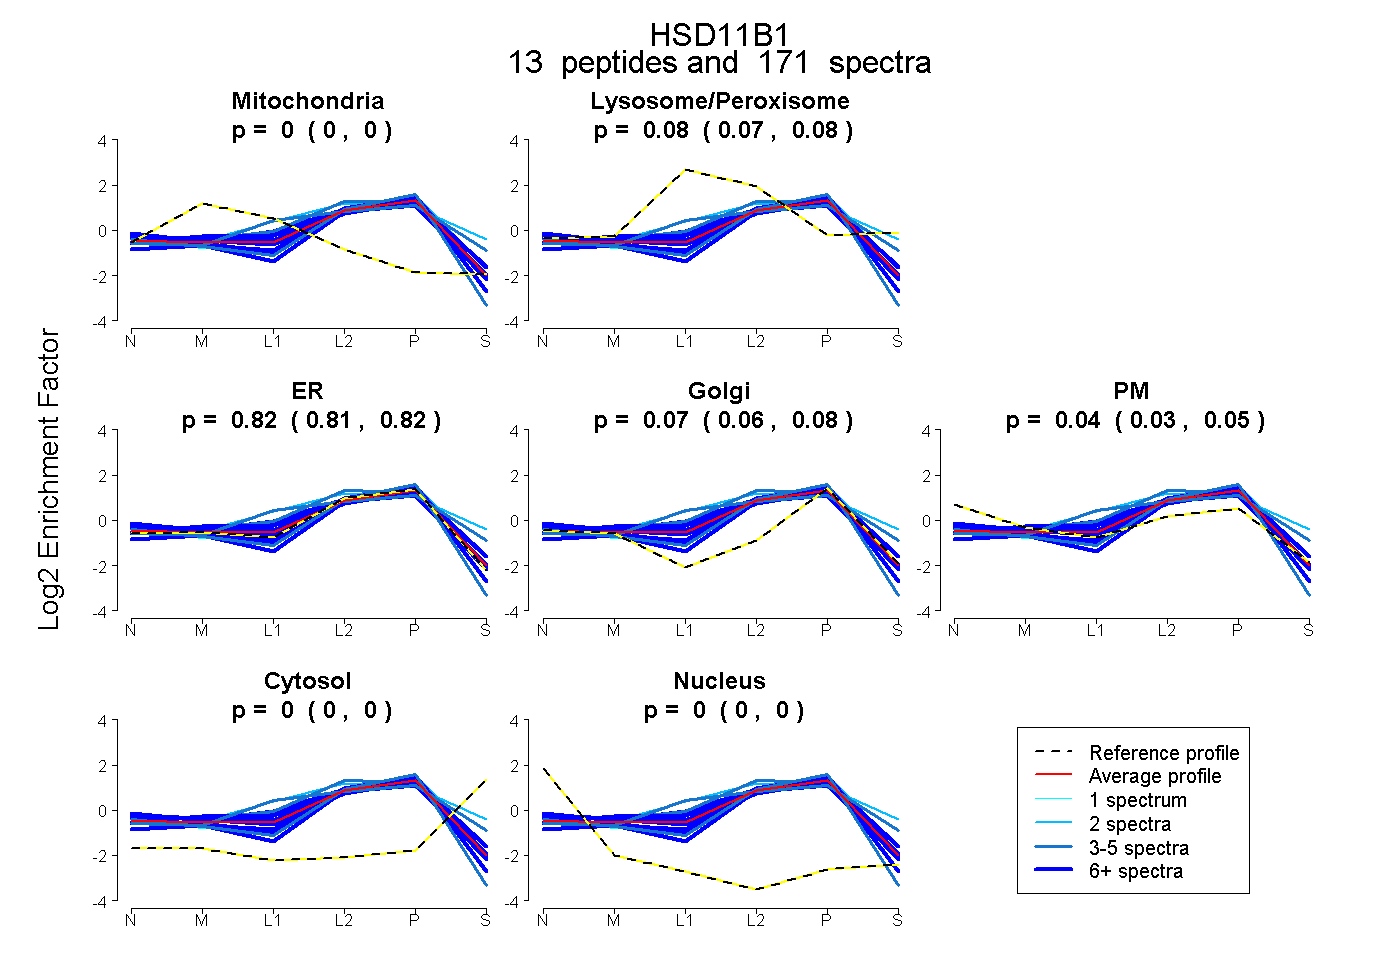 |
0.000 0.000 | 0.000 |
0.077 0.070 | 0.083 |
0.816 0.806 | 0.824 |
0.069 0.059 | 0.077 |
0.038 0.029 | 0.045 |
0.000 0.000 | 0.000 |
0.000 0.000 | 0.000 |
|||
| Plot | Lyso | Other | |||||||||||
| Expt C |
16 peptides |
404 spectra |
 |
0.000 0.000 | 0.000 |
1.000 1.000 | 1.000 |
||||||||
| Plot | Lyso | Other | |||||||||||
| Expt D |
9 peptides |
36 spectra |
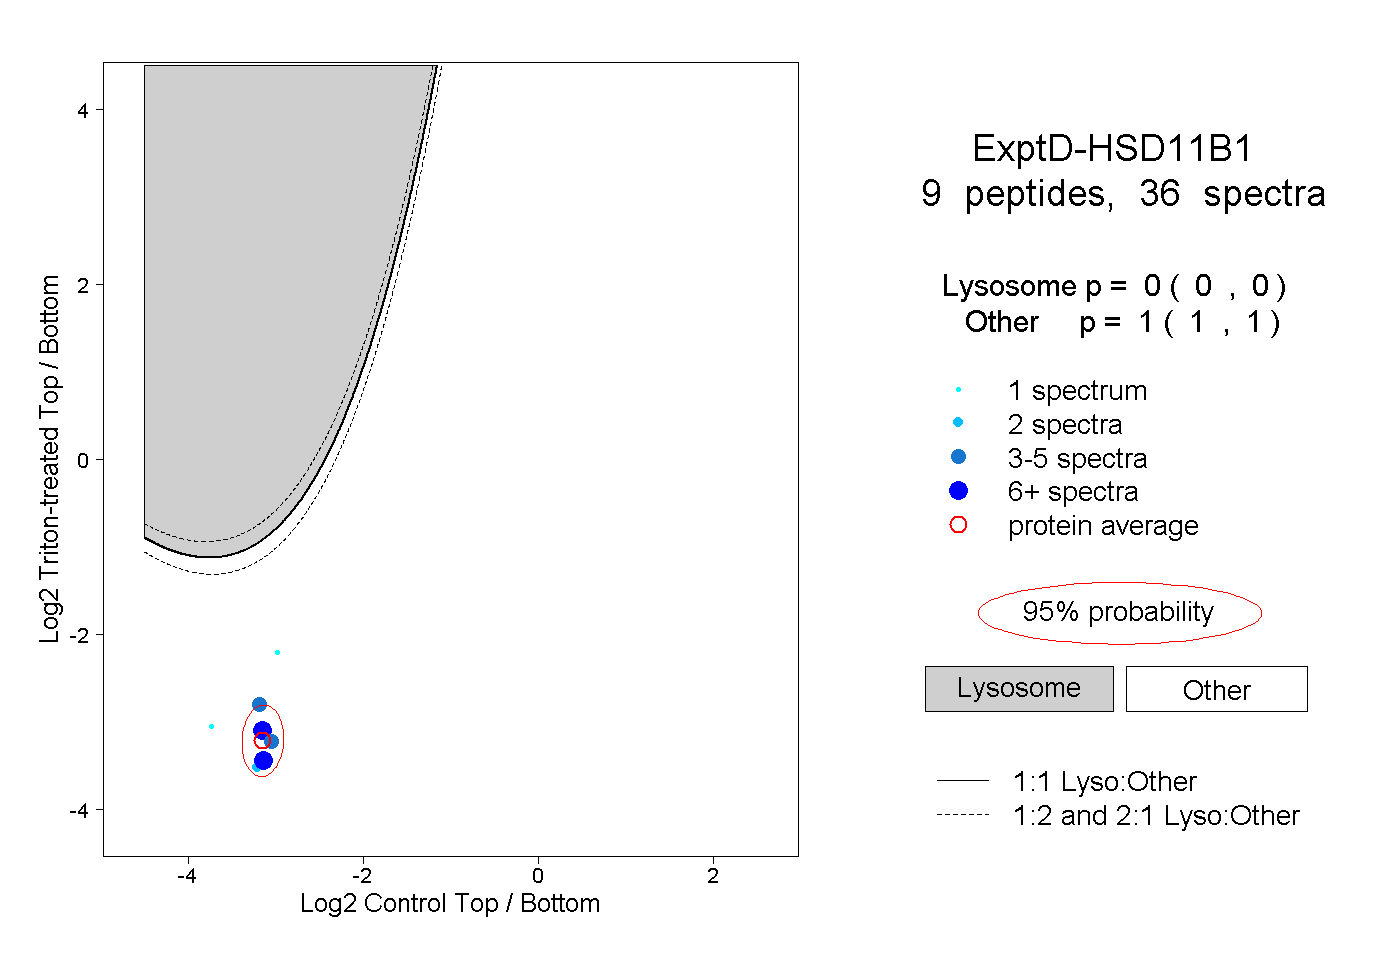 |
0.000 0.000 | 0.000 |
1.000 1.000 | 1.000 |