 13
13peptides
spectra
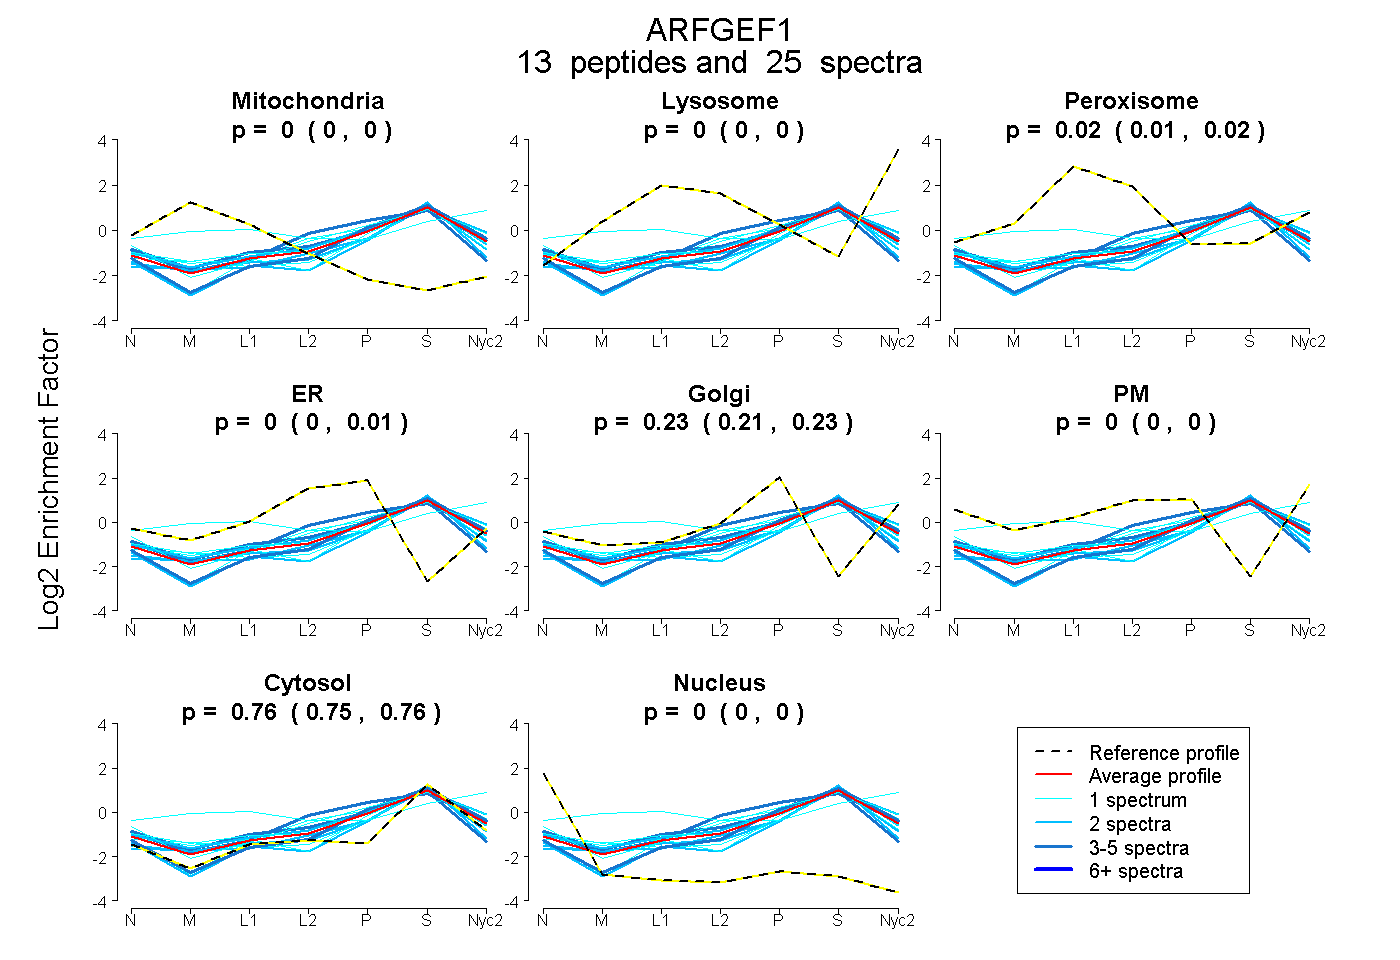
0.000 | 0.000
0.000 | 0.000
0.006 | 0.024
0.000 | 0.009
0.211 | 0.232
0.000 | 0.000
0.751 | 0.765
0.000 | 0.000
8peptides
spectra
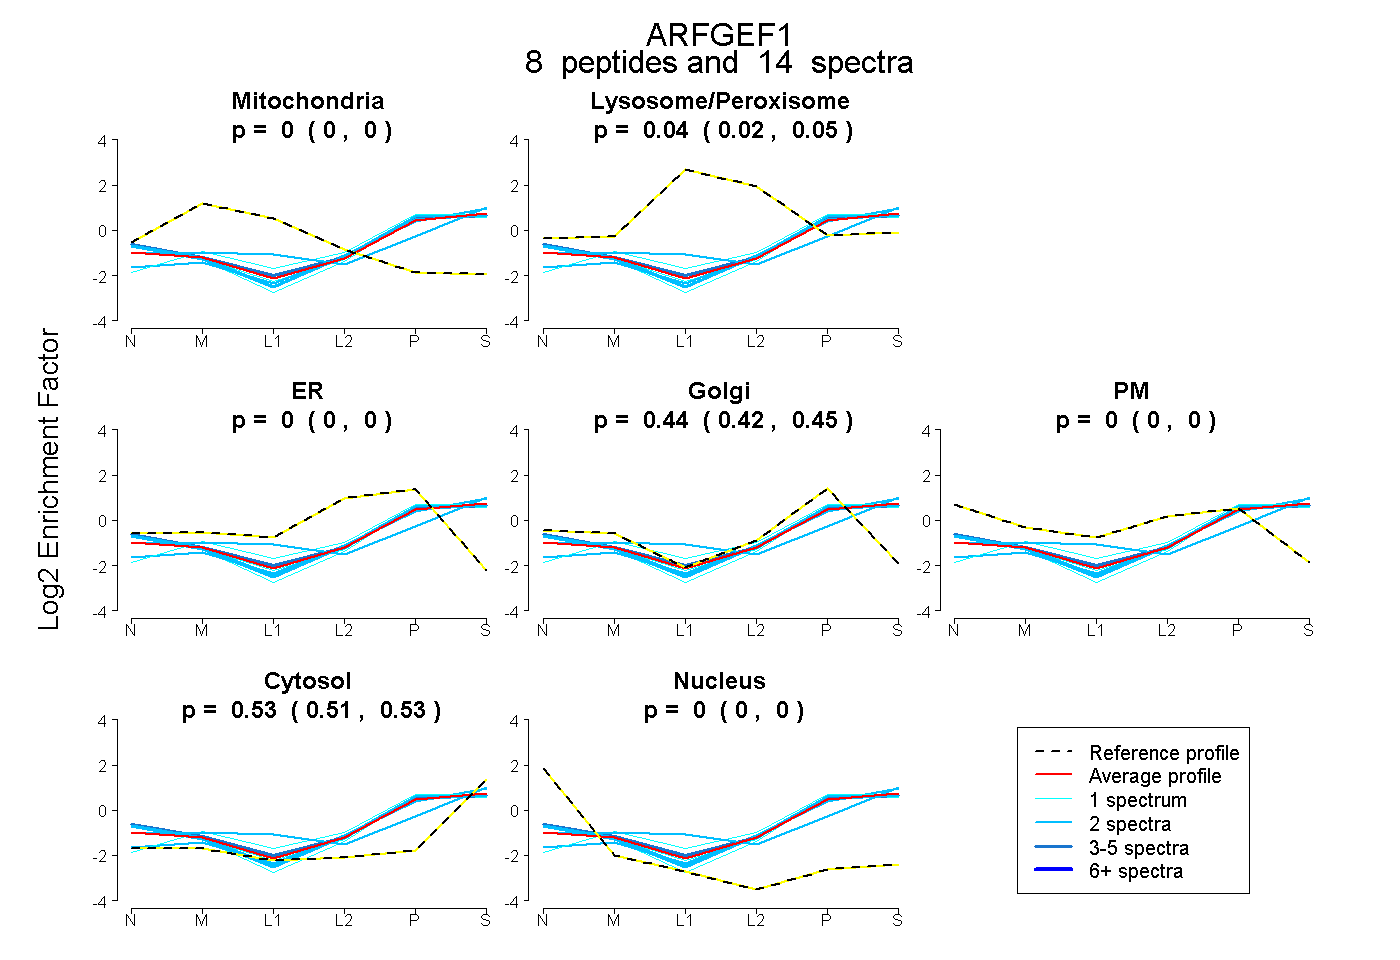
0.000 | 0.000
0.025 | 0.052
0.000 | 0.000
0.421 | 0.448
0.000 | 0.000
0.514 | 0.534
0.000 | 0.000
6peptides
spectra
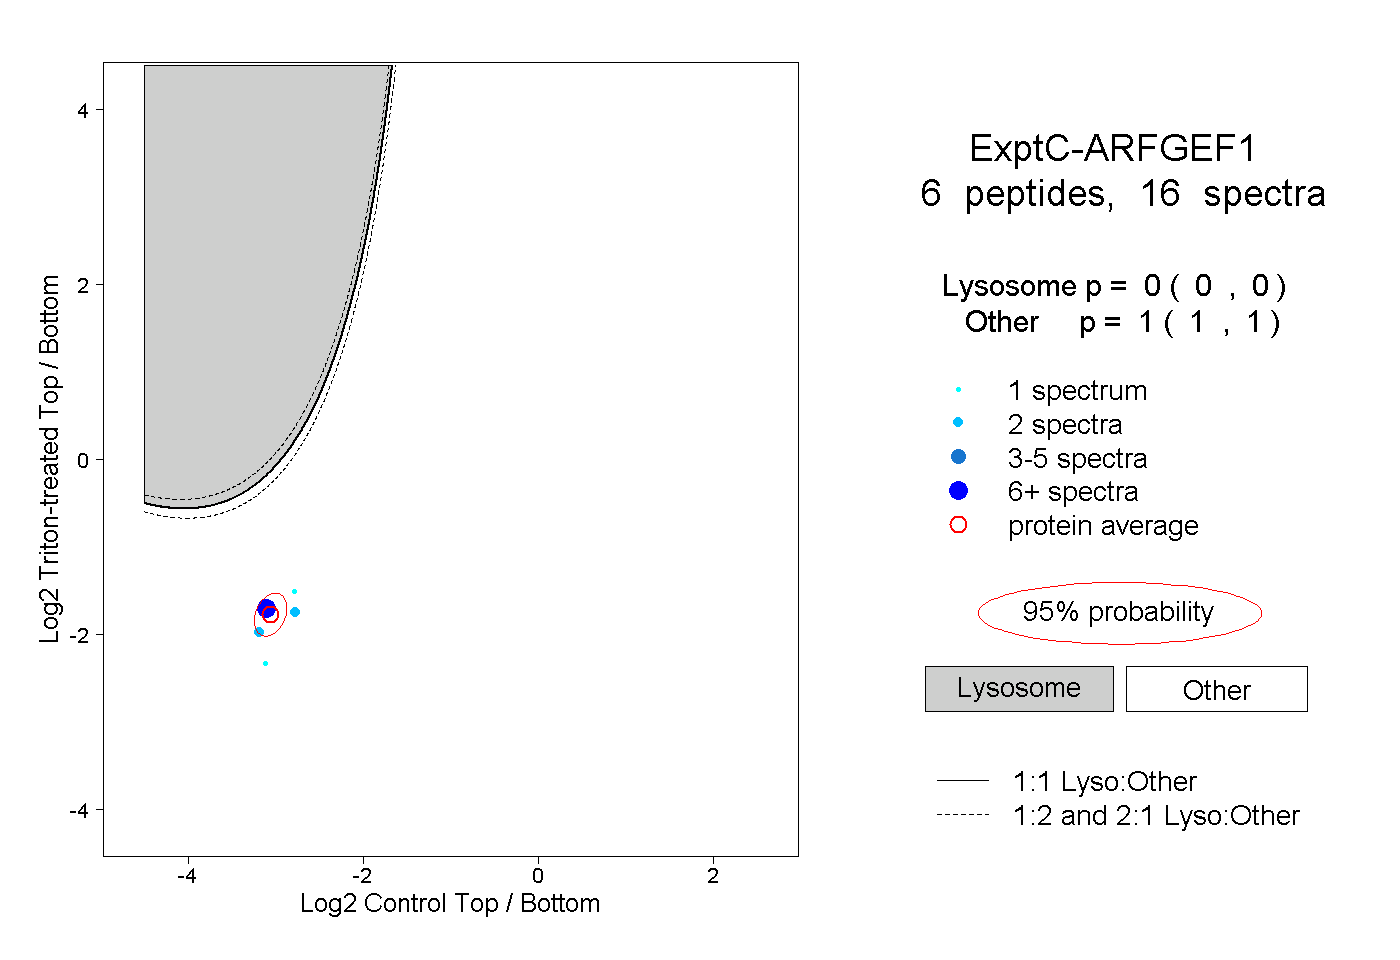
0.000 | 0.000
1.000 | 1.000
1peptide
spectrum
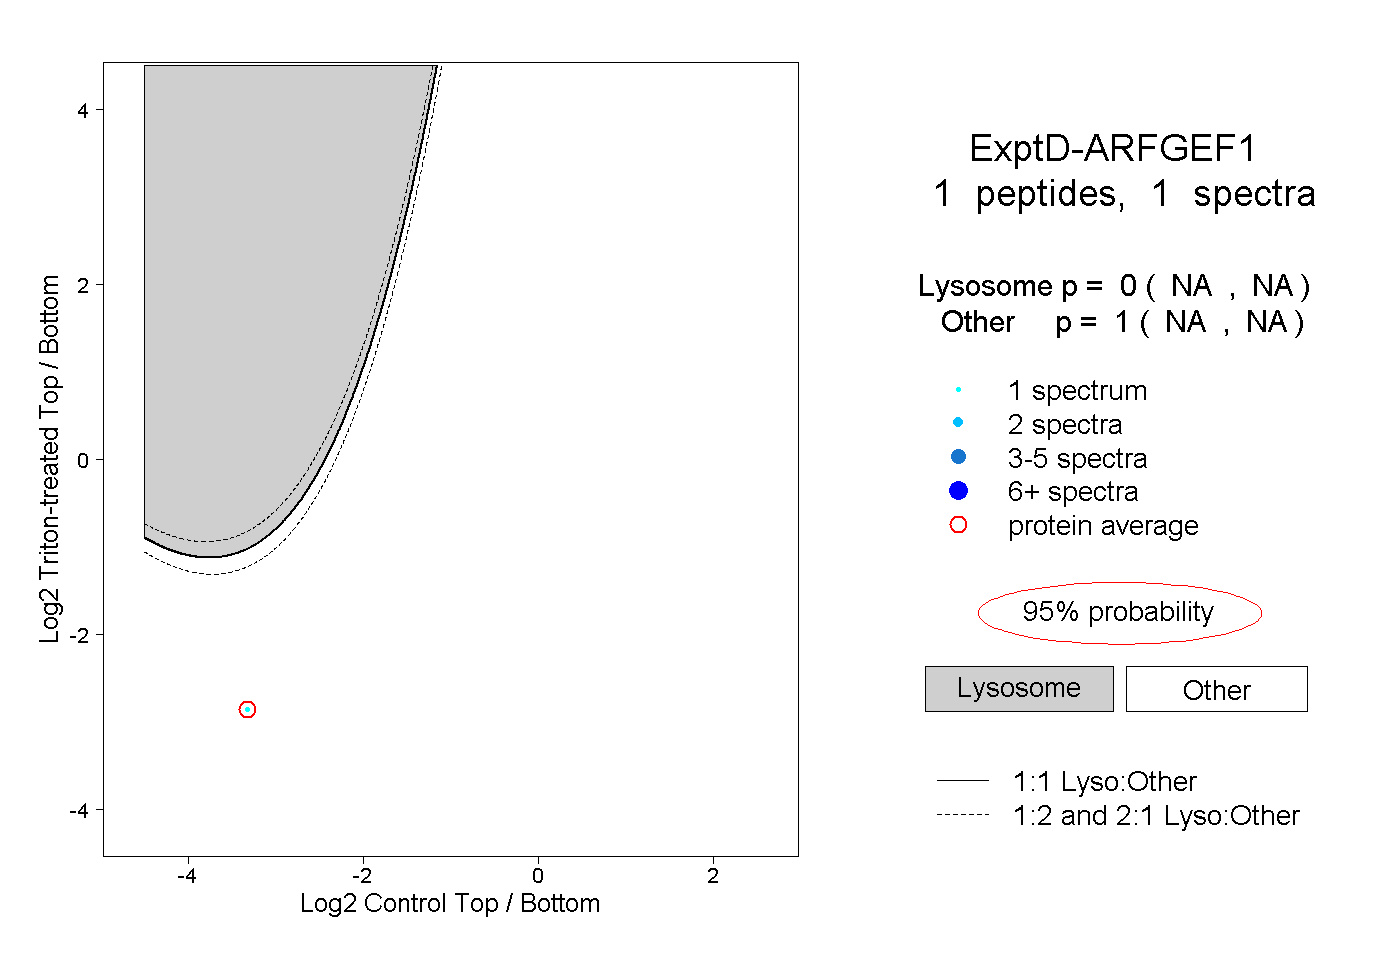
NA | NA
NA | NA