ARFGEF1
[ENSRNOP00000007766]
Main page
| | | Plot |
Mito |
Lyso |
|
Perox |
ER |
Golgi |
PM |
Cytosol |
Nucleus |
|
| Expt A |
 13
13
peptides |
25
spectra |
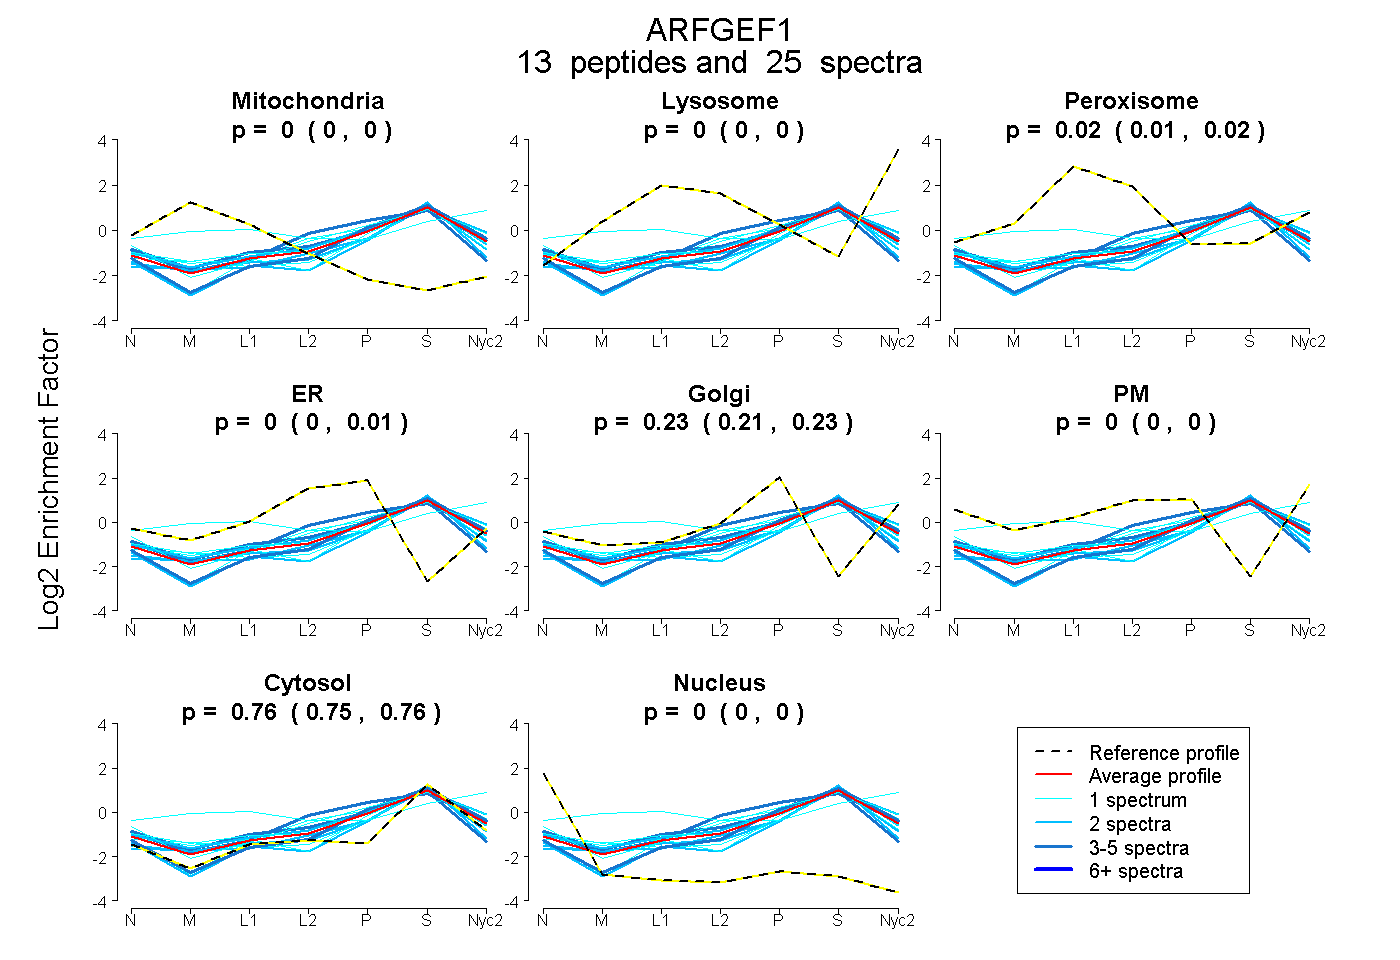 |
0.000
0.000 | 0.000 |
0.000
0.000 | 0.000 |
|
0.016
0.006 | 0.024 |
0.000
0.000 | 0.009 |
0.226
0.211 | 0.232 |
0.000
0.000 | 0.000 |
0.758
0.751 | 0.765 |
0.000
0.000 | 0.000 |
|
| | | Plot |
Mito |
|
Lyso or Perox |
|
ER |
Golgi |
PM |
Cytosol |
Nucleus |
|
| Expt B |
8
peptides |
14
spectra |
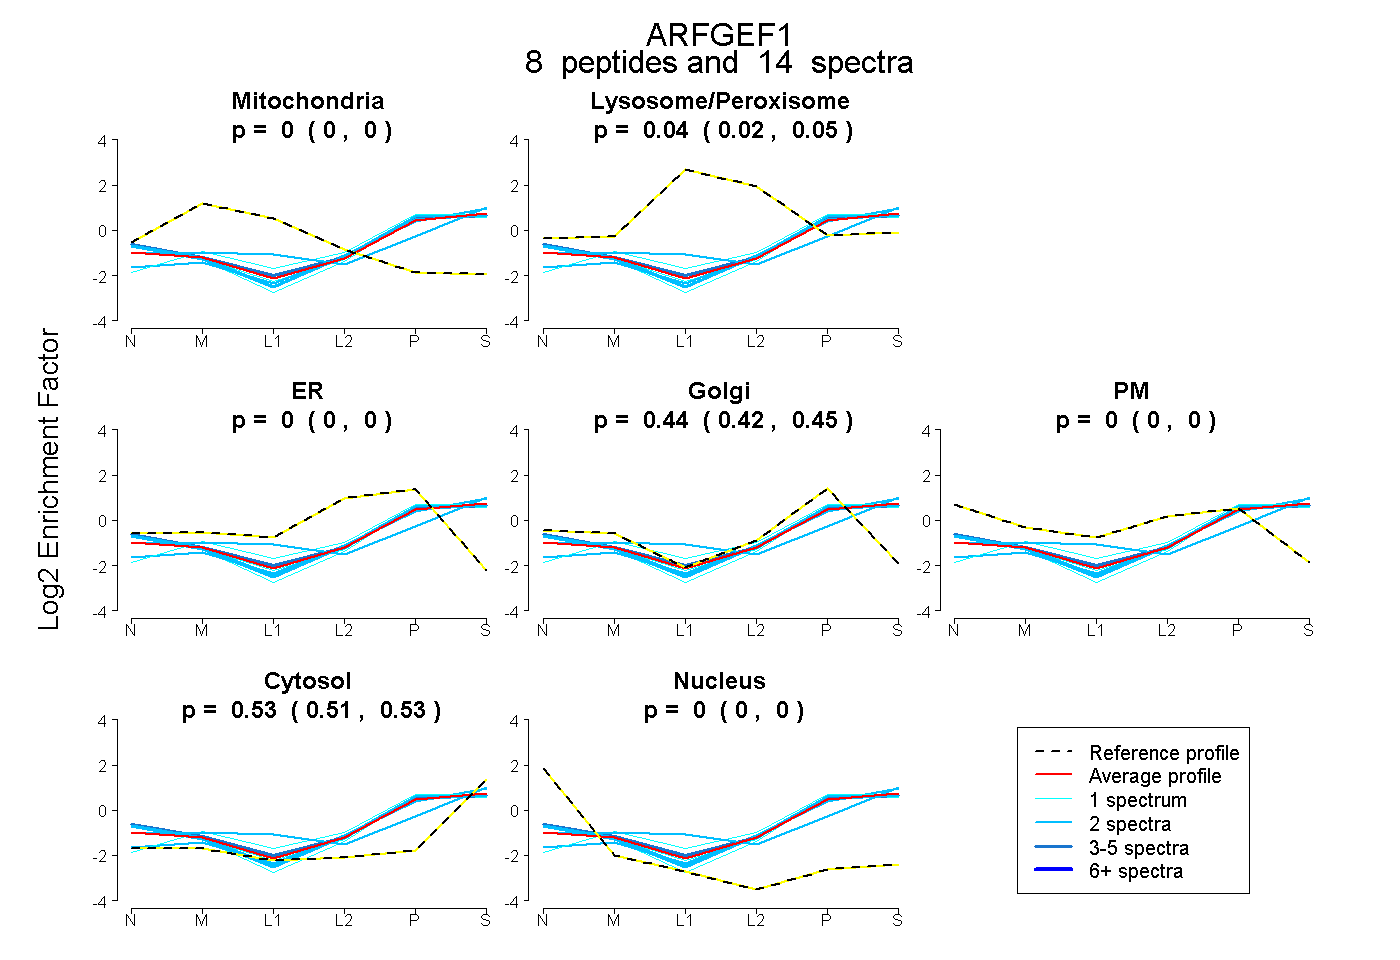 |
0.000
0.000 | 0.000 |
|
0.039
0.025 | 0.052 |
|
0.000
0.000 | 0.000 |
0.435
0.421 | 0.448 |
0.000
0.000 | 0.000 |
0.525
0.514 | 0.534 |
0.000
0.000 | 0.000 |
|
| 2 spectra, DFLRPFEHIMK |
0.000 |
|
0.000 |
|
0.089 |
0.281 |
0.000 |
0.630 |
0.000 |
|
| 1 spectrum, DAFLVFR |
0.000 |
|
0.000 |
|
0.000 |
0.507 |
0.000 |
0.493 |
0.000 |
|
| 1 spectrum, FSHILQK |
0.000 |
|
0.058 |
|
0.143 |
0.276 |
0.000 |
0.523 |
0.000 |
|
| 1 spectrum, DAYVQALAR |
0.000 |
|
0.015 |
|
0.000 |
0.507 |
0.000 |
0.478 |
0.000 |
|
| 2 spectra, IFTGSTR |
0.000 |
|
0.001 |
|
0.000 |
0.494 |
0.000 |
0.505 |
0.000 |
|
| 2 spectra, LDGNAIVDFVR |
0.000 |
|
0.000 |
|
0.000 |
0.504 |
0.000 |
0.496 |
0.000 |
|
| 2 spectra, LLDCLLESHR |
0.000 |
|
0.186 |
|
0.000 |
0.194 |
0.000 |
0.620 |
0.000 |
|
| 3 spectra, HWWQDLFR |
0.000 |
|
0.064 |
|
0.000 |
0.456 |
0.000 |
0.481 |
0.000 |
|
| | | Plot |
|
Lyso |
|
|
|
|
|
|
|
Other |
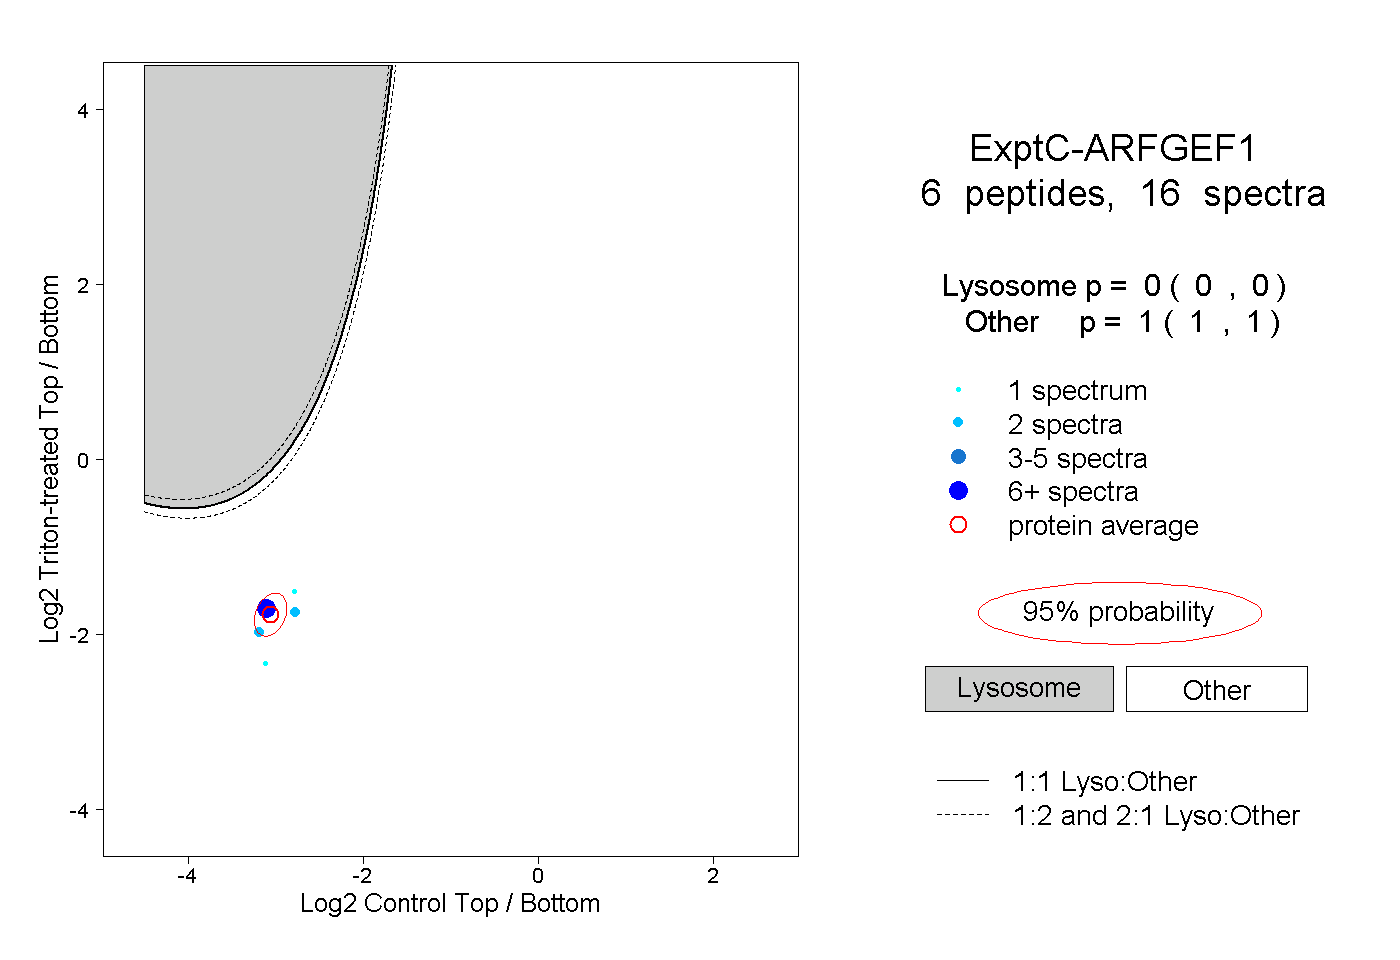
| Expt C |
6
peptides |
16
spectra |
 |
|
0.000
0.000 | 0.000 |
|
|
|
|
|
|
|
1.000
1.000 | 1.000 |
| | | Plot |
|
Lyso |
|
|
|
|
|
|
|
Other |
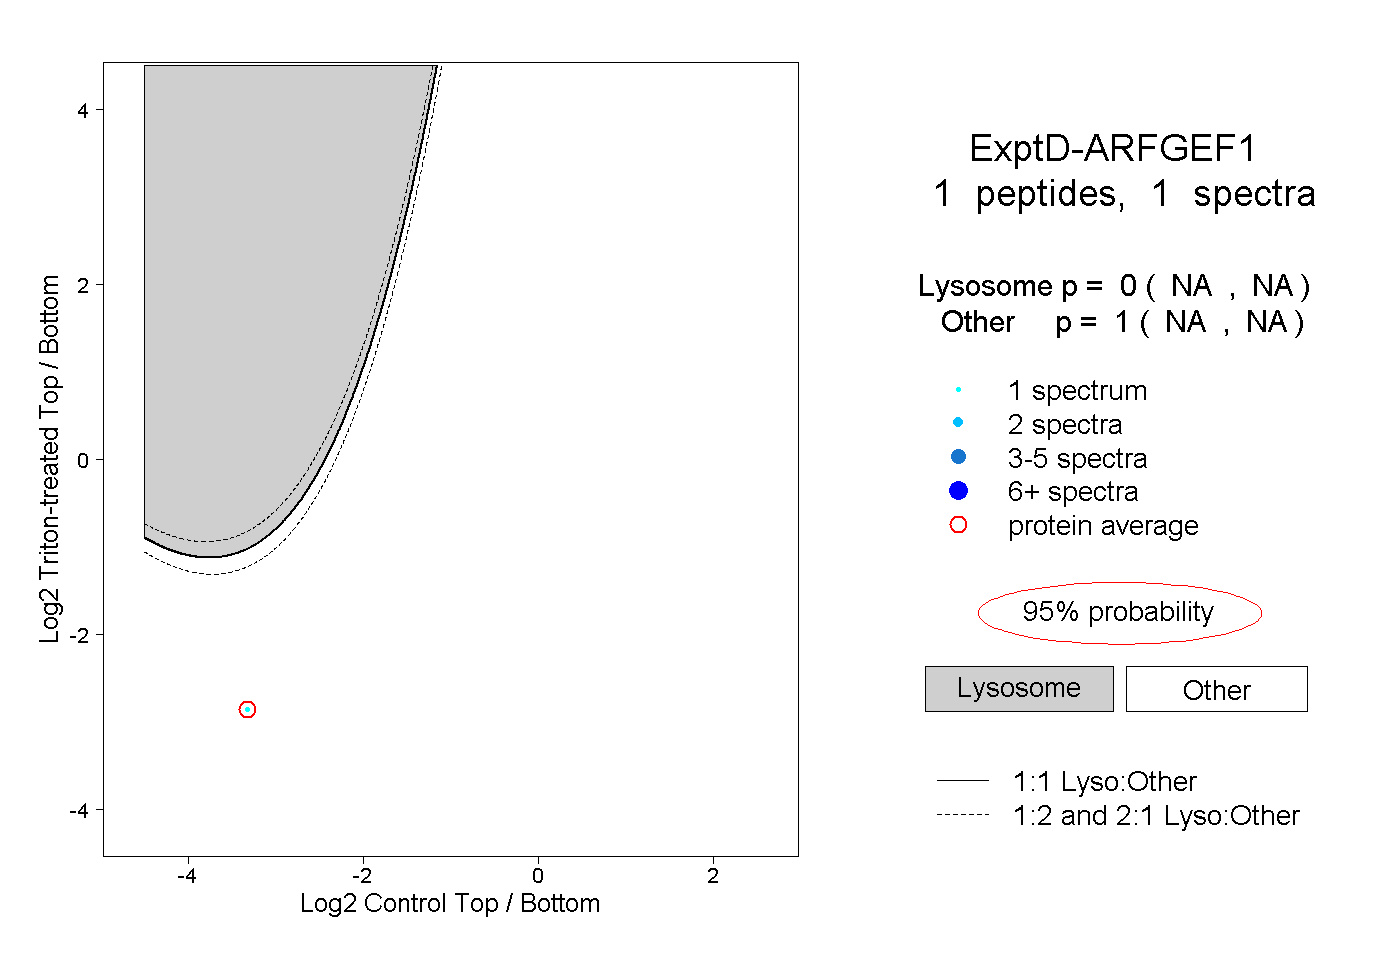
| Expt D |
1
peptide |
1
spectrum |
 |
|
0.000
NA | NA |
|
|
|
|
|
|
|
1.000
NA | NA |